Subscribers questions
A fascinating week lies ahead with a very strong open by stocks anticipated this morning, primarily courtesy of an excellent performance from the battered resources sector on Friday night in the overseas markets e.g. BHP is set to open up 2.7% this morning. However the question we are asking ourselves is whether the market is simply going to experience a reversal of the last few months sector performance i.e. it’s time for banks to trade lower and resources higher. If this is the case the ASX200 is highly likely to fall due to its domination by our banking / financial stocks.
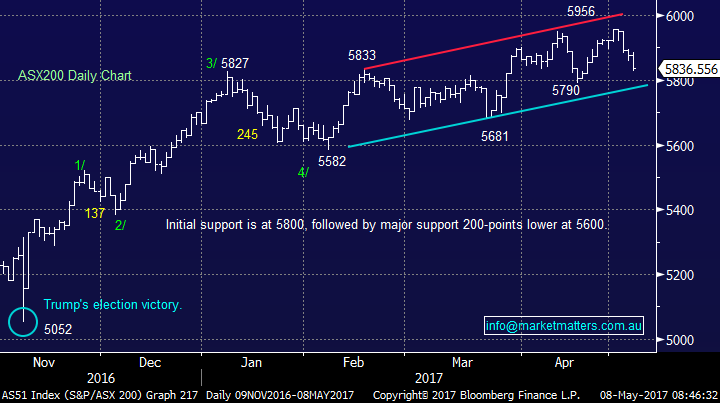
Overall our view remains that the ASX200 is looking for a top with a high probability that the fresh 2-year high at 5956 touched last Monday will remain the top for May / June. If that becomes the case we should see a break of 5800 in May and a high likelihood of a test of 5600 in June. Remember we also believe US equities are extremely close to an inflection point with a ~5% pullback very close at hand. Context is important and since the US election last November the ASX200 has rallied 17.9% and the S&P500 +15.2%, hence a 5% pullback is a relatively small correction.
ASX200 Daily Chart
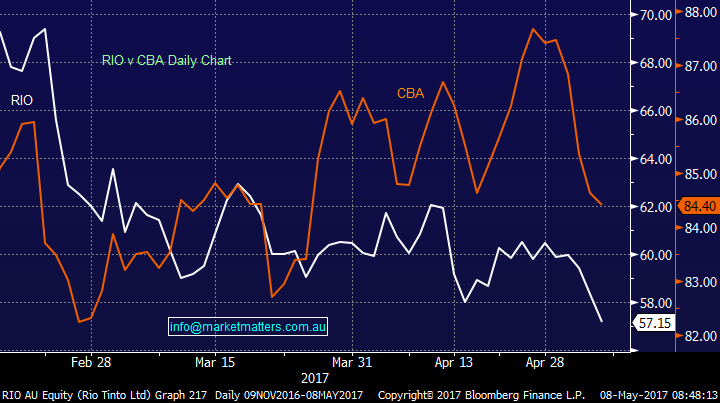
Let’s look at the performance of our resource stocks compared to the banks from mid-February through to last Monday, by comparing RIO to CBA, both of which have traded ex-dividend during this time period.
1. Since mid-February RIO has fallen $13.08 / 18.7% while paying a $1.63 dividend.
2. Conversely CBA had rallied $2.58 / 3% while paying a $1.99 fully franked dividend.
So although CBA fell a few dollars at the end of last week the outperformance is still up towards 20%. We don’t like making “out there” calls for the sake of it but we believe over the next 4-6 weeks its catch up time…..buy resources and sell banks is our overarching view.
RIO v CBA Daily Chart
Question 1
This week’s questions were dominated by OZ Minerals which is no great surprise as it’s our worst performer at present. Some examples are below:
“Hi, Should I sell OZL? (big loss)” - Thank you Frank.
“Notably OZL has taken the full brunt of the fall in copper, and then some as a result of their Carrapateena mine. With the majority of brokers targeting a price >$9 where do you see the technical bottom to allow purchasing opportunities?”- Peter
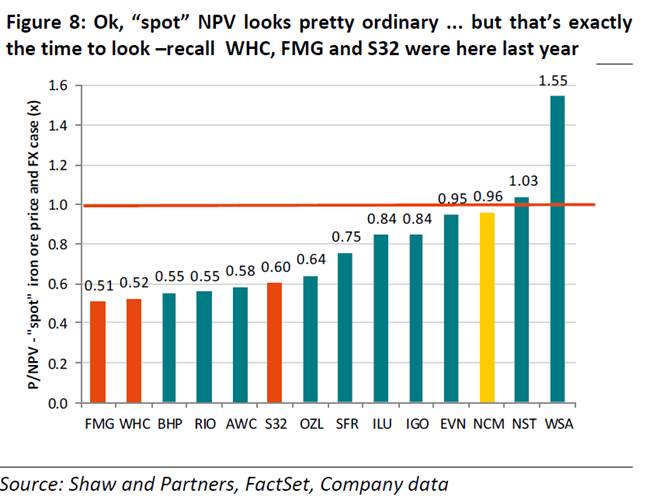
“Hi, Could someone give me a phone call to explain the NPV graph below?” Regards Robert.
“One more down day in OZL and I’m out . . . . . already down 10% from purchase price.” - Anthony
Firstly it’s important to understand that we regard OZL as both part of our overall portfolio and part of our resources basket of investments: We have a large 17.5% of the MM portfolio in BHP, RIO and of course OZL. Unfortunately at present all of these positions are underwater to varying degrees. Due to the current paper losses we have held back on adding AWC to this basket for simple risk reasons - our overall view of the ASX200 holds us back from being more aggressive towards the sector. On the portfolio front it should also be remembered we are holding ~30% in cash looking for lower prices to become buyers so on balance we expect our portfolio to experience some weakness during May / June.
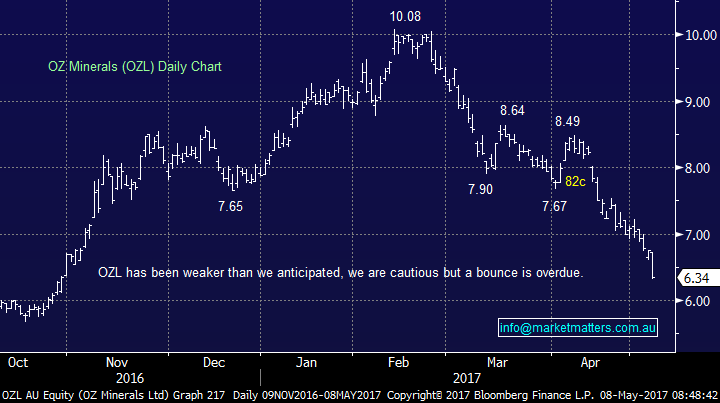
OZL has undoubtedly been far weaker than we anticipated falling on bad news around both copper and gold.
Technicals
Technically it should at least bounce over $7 in the coming days / weeks and we will consider trimming our resources exposure into this strength. Conversely as we said in the Weekend Report we will also consider trimming this exposure if Fridays panic lows fail to hold.
Fundamentals
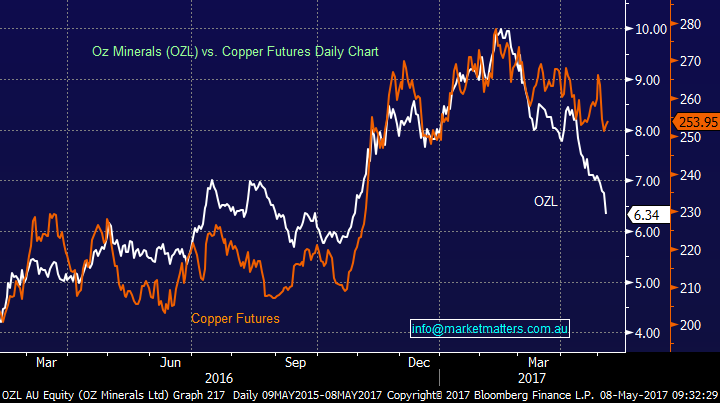
Firstly lets cover off the negative; their copper production was weak in the March quarter but it was mostly weather related and they maintained FY guidance. They also have an update on their Carrapateena feasibility and did not make a final investment decision on the project, however all the rhetoric suggests it’s on track & thirdly, Oz has been tracking weakness in the Copper price (i.e – these are short term sentiment issues). Now for the positive; They’re cheap in terms of their asset base, trading at ~60% of NPV (we’ll explain NPV shortly), but they are expensive in terms of earnings, trading on 19.2 exp FY17 earnings, they have cash, lots of it being the most cashed up in the global copper space and they have a very good looking long life project due for development, funded via free cash flow while maintaining a small dividend. Mining companies are cyclical and although this may go against common wisdom, the time to buy miners is when they are expensive in terms of earnings but cheap in terms of their assets, after all, we’re buying the cash flow produced in the future, not the past.
Price / Net Present Value
We had a specific question about the chart below on Friday afternoon which looks at the price of a miner versus their ‘Net Present Value’. This is a very typical way of comparing future value. In simple terms, if we take a Copper project, with all its Copper, all the costs to develop and process the Copper, all its incomes, and we think about what that is worth today, we get a NPV figure. Or in other words, look at future cash flows and discount them back to today. In terms of Oz Minerals, it has a NPV of around ~$10 yet it’s trading at $6.34. We used this metric to go ‘short’ Fortescue (FMG) a couple of months ago when it was trading above its projected NPV.
OZ Minerals (OZL) Daily Chart
Oz Minerals (OZL) versus Copper – When we see divergence, it typically re-correlates one way or another
Question 2
" Hi, With the banks copping a hit as we go into May, and some are due a dividend, the problem of do you sell now to protect the profits you have made in capital, or hold on for the dividend, and hope the capital drop does not exceed the dividend. As a previous buy and hold investor, this issues has come up many times...Maybe just a gamble?” - Geoff
Morning Geoff, when we look at stocks in the very short-term their price swings are certainly more random and very news / sentiment driven, hence you could easily say it’s a gamble trying to predict them.
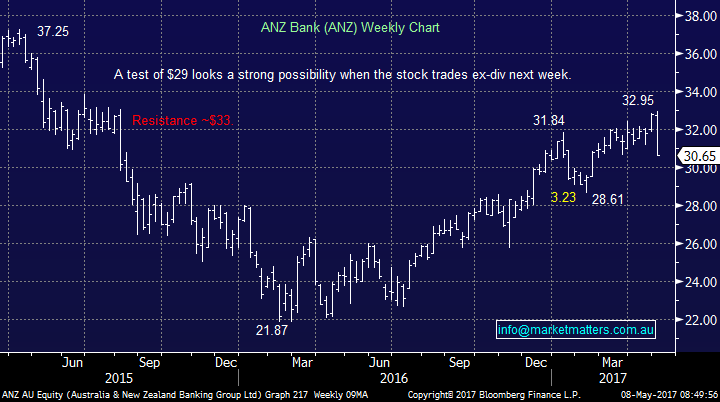
On balance we continue to believe our banking sector is set for a reasonable pull back but our planned action today does almost keep a foot in both camps!
1. We plan to sell our 8% holding in ANZ this morning with the stock trading ex. div. 80c fully franked.
2. We intend to allocate an additional 3.5% into NAB, taking our holding to 7.5% looking to receive its 99c fully franked dividend next week.
3. We are looking to allocate ~10% into CBA under $81, around 4% lower than Fridays close.
Overall a combination of your thoughts Geoff! Obviously individual investors need to take into account their personal financial positions, which we don’t.
ANZ Bank (ANZ) Weekly Chart
Question 3
"Hi MM, I have read that energy stocks are the best performers in May. Any comments about that? Apart from ORG are you looking at any others.” - Nick
Hi Nick, We also read that report and this month in particular it would not surprise us to see the energy sector perform solidly as we have witnessed a significant pullback in the underlying oil price oil since mid-April. At MM we already have a 7.5% portfolio exposure to the energy sector via BHP whose share price has a large performance correlation to the oil price e.g. oil bounced up over 5% from its intra-day panic lows on Friday, when our market was open, and BHP is set to open up +2.7% today.
One thing we often talk about is how a market reacts to news and over the last few weeks its caught our attention that the energy sector has held up while the oil price has been tumbling e.g. since later April crude oil has pulled back 17.8% to Fridays low-point but our energy sector has performed far better with Santos -1.9%, -2.8% and Woodside -1.6%.
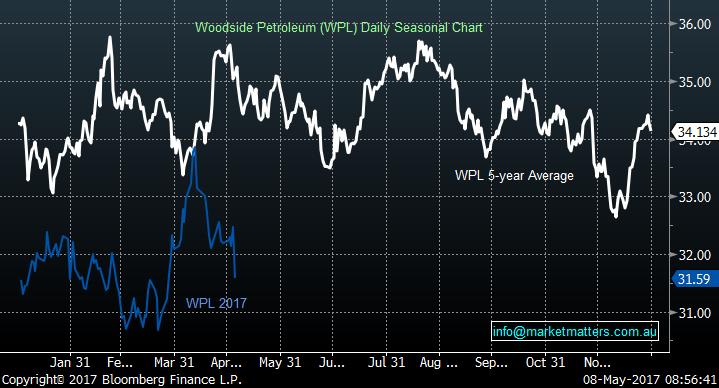
A market that performs well in the face of bad news is a strong market. Woodside would be our favourite exposure to the space at this point in time as we have touched on a few times over recent weeks. Interestingly Bloomberg seasonality charts point to a weak April – June for WPL but 2017 has clearly not been a year where it has followed the usual seasonal path.
Hence we would choose WPL if you wanted to increase energy exposure given it has ‘best in class’ cost base however we are comfortable with our 7.5% in BHP at this point in time.
Woodside Petroleum (WPL) Seasonality Chart
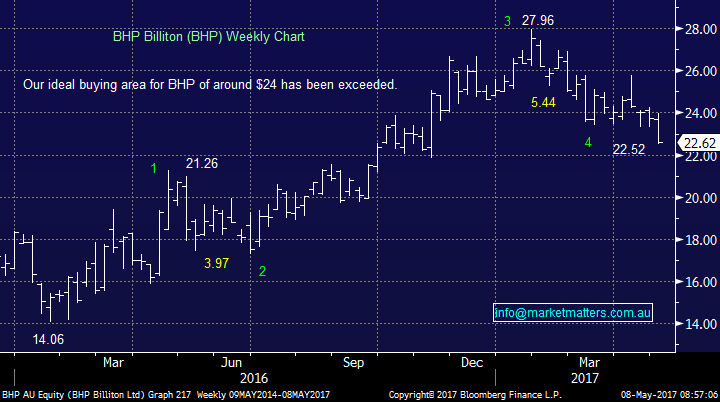
Technically and fundamentally we like BHP at current levels, initially targeting a test of the $26 resistance area.
BHP Billiton (BHP) Weekly Chart
Overnight Market Matters Wrap
· The US share markets rallied last Friday, courtesy from the Energy sector.
· Oil regained some of its recent losses, after reports a top Saudi official reaffirmed that it will continue to extend the current output cuts when the OPEC members meet this month.
· The Energy and Iron Ore sector is expected to outperform the broader market, with BHP ending its US session up an equivalent of +2.81% from Australia’s previous close.
· The June SPI Futures is indicating a sharp open to the upside with the ASX 200 this morning, north of 54 points, back testing the 5900 level.
Disclosure
Market Matters may hold stocks mentioned in this report. Subscribers can view a full list of holdings on the website by clicking here. Positions are updated each Friday.
Disclaimer
All figures contained from sources believed to be accurate. Market Matters does not make any representation of warranty as to the accuracy of the figures and disclaims any liability resulting from any inaccuracy. Prices as at 08/05/2017. 8.00AM.
Reports and other documents published on this website and email (‘Reports’) are authored by Market Matters and the reports represent the views of Market Matters. The MarketMatters Report is based on technical analysis of companies, commodities and the market in general. Technical analysis focuses on interpreting charts and other data to determine what the market sentiment about a particular financial product is, or will be. Unlike fundamental analysis, it does not involve a detailed review of the company’s financial position.
The Reports contain general, as opposed to personal, advice. That means they are prepared for multiple distributions without consideration of your investment objectives, financial situation and needs (‘Personal Circumstances’). Accordingly, any advice given is not a recommendation that a particular course of action is suitable for you and the advice is therefore not to be acted on as investment advice. You must assess whether or not any advice is appropriate for your Personal Circumstances before making any investment decisions. You can either make this assessment yourself, or if you require a personal recommendation, you can seek the assistance of a financial advisor. Market Matters or its author(s) accepts no responsibility for any losses or damages resulting from decisions made from or because of information within this publication. Investing and trading in financial products are always risky, so you should do your own research before buying or selling a financial product.
The Reports are published by Market Matters in good faith based on the facts known to it at the time of their preparation and do not purport to contain all relevant information with respect to the financial products to which they relate. Although the Reports are based on information obtained from sources believed to be reliable, Market Matters does not make any representation or warranty that they are accurate, complete or up to date and Market Matters accepts no obligation to correct or update the information or opinions in the Reports.
If you rely on a Report, you do so at your own risk. Any projections are estimates only and may not be realised in the future. Except to the extent that liability under any law cannot be excluded, Market Matters disclaims liability for all loss or damage arising as a result of any opinion, advice, recommendation, representation or information expressly or impliedly published in or in relation to this report notwithstanding any error or omission including negligence.
To unsubscribe. Click Here


