Subscribers questions (SO4, WBC, MP1, MSB, A2M, BUB, GMA, ANZ, FMG, NST, XRO, BRK/B US, NCM, SYD, AIA)
We feel the ASX200 is poised to breakout towards 5600 although MM is not convinced it will become a sustainable rally, at least on the first attempt. Australia is slowly starting to regain its usual lifestyle and countries that have been devastated like Spain are finally showing massive progress against COVID-19, it’s easy to comprehend investors deciding it’s safe to move back into the water with regard to stocks, especially as the ASX remains 25% below its February high.
At MM our underlying view has not waivered for many weeks, we anticipate a choppy advance with many false breaks both up and down, or in other words it’s not an ideal time to be chasing strength or selling weakness. However we do believe its an opportune period for “Active Investors” like ourselves as different stocks / sectors move in and out of vogue, moves that would often take a year to evolve have been done & dusted in a fortnight.
China has made some very encouraging comments towards trade with Australia stating its “committed to the free-trade deal despite disagreement over the governments proposed coronavirus inquiry” – I wonder if we and the rest of the world spend millions of dollars to decide / confirm that China is responsible for COVID-19 on some level are they then hoping for financial compensation? It’s a fine line because Australia in particular needs the world’s second largest economy to help drive our economic recovery, not to hamper it. Unfortunately, I feel it may take years to rectify the mistrust towards Asia that the pandemic has caused although we can be a very forgiving species looking back at history.
MM remains bullish equities but doesn’t anticipate a straight line recovery.
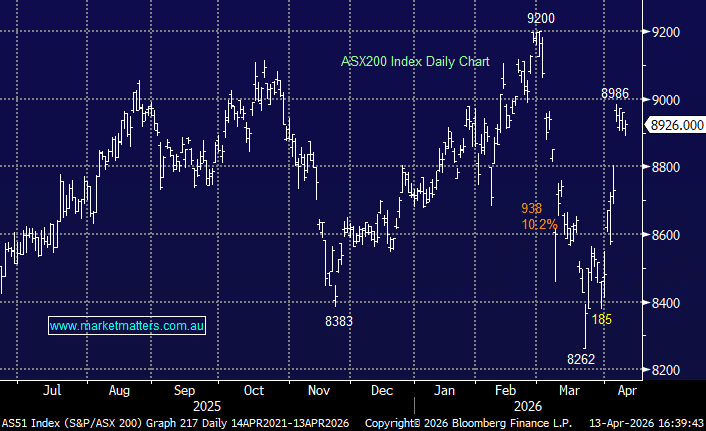
ASX200 Index Chart
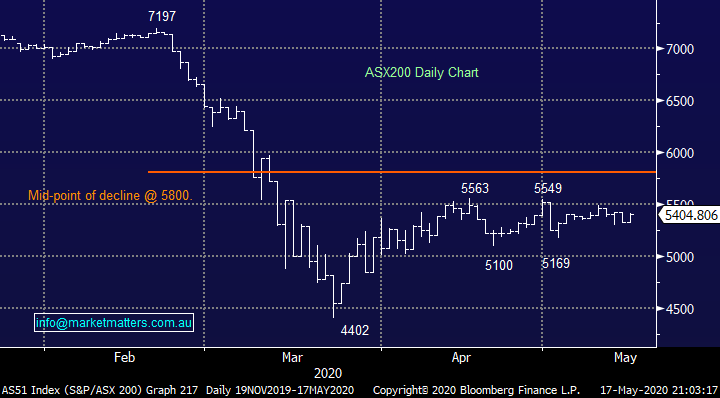
As we mentioned last week Australian stocks are more correlated to their European peers as opposed to the more followed US, happily the German DAX followed our anticipated path last week, reaching our pullback target before bouncing nicely. Our preferred scenario is now a rally to make fresh April / May highs in the coming weeks, before probably another pullback i.e. a choppy advance.
MM’s is now bullish the German DAX looking for ~10% upside.
The ASX didn’t pullback as much as the DAX hence we wouldn’t expect as large an advance but 5600-plus feels very achievable.
The German DAX Index Chart

Thanks again everybody for another rewarding number of questions this morning, please keep them coming, we love having engaged and educated subscribers:
Question 1
“Could you please share your thoughts on the preference for Value vs Growth stocks in the near and medium time frame and also your pick for different type of stocks. Thank you & keep smiling” – Tony N.
Hi Tony,
I love the positive sign off, I had a great weekend with the family so a smile is firmly on my dial!
We saw in late 2018 that a huge ingredient to turn the dial on relative performance with Value & Growth stocks is interest rates. High valuation / growth stocks plunged in late 2018, both here and in the US, when markets feared the Fed would raise interest rates too fast and tip the world into a recession. Today we find ourselves in the eye of a recession, but Growth stocks are outperforming as they embrace global interest rates close to zero. The reason for this is relatively simple, the risk-free interest rate is a component is valuation formulas and a lower risk-free rate means we can justify higher valuations.
We’ve held off on aggressively pushing the switch buttons with regard to switching between both groups, but the time is approaching, my best guess at this stage is Q4 of 2020. Our current preference in the Value space is the Resources Sector but if the friendless Banks fall much further, they will look very attractive in our opinion.
MM believes Value will start to outperform in late 2020.
S&P500 Value v Growth Indices Chart - 1
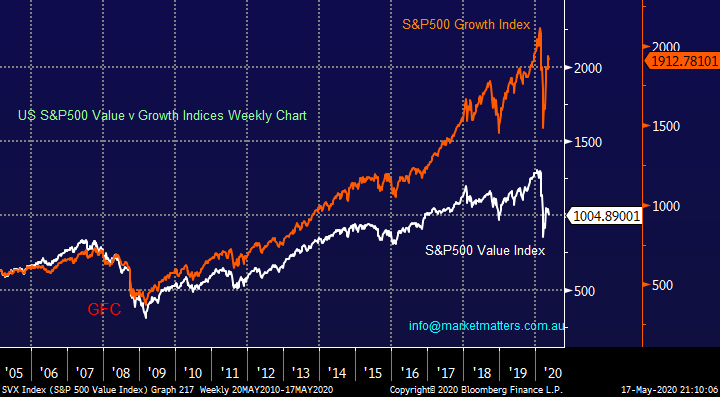
S&P500 Value v Growth Indices Chart -2

Question 2
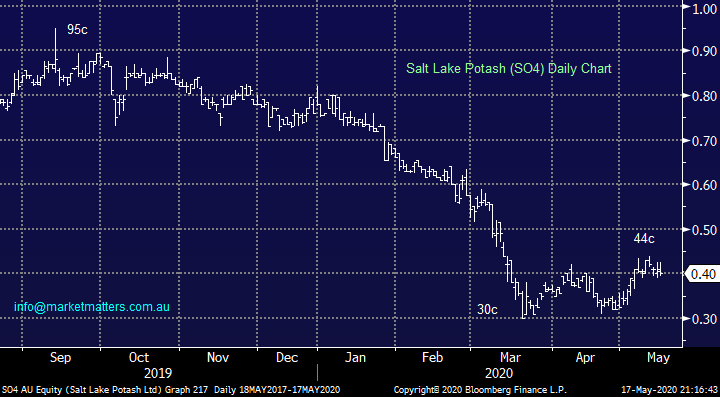
“Hi James, I meant SO4, Salt Lake Potash Limited. The CEO seems to have a strong history with FMG.” - Regards, Laurence S.
Morning Laurence,
Thanks for clarifying, chemical business SO4 is a small cap on our bourse with a market cap of $140m. Unfortunately, this is not a stock I follow very closely hence I largely rely on the technical indicators for clues to potential moves. After a tough 9-months, both before and after the pandemic, I see no catalyst at this stage to buy the stock.
MM is neutral SO4.
Salt Lake Potash (SO4) Chart
Question 3
“Hi James and crew, thanks for your market commentary, it's very informative and a great resource for me. I have a question regarding banks. I am underweight banks, as yourselves, however I am conflicted as I feel the best time to invest in anything is usually when everyone is the most bearish. Recently I read an article that suggested due to their capital raises, banks could be overcapitalised after the dust settles with this pandemic. Assuming that this suggestion does become a reality, what do you think banks would do with their extra capital? To me, the most obvious outcome would be bonus dividends, but I also thought this may result in a takeover offer for a smaller bank. I am toying with the idea of buying some BEN or BOQ. What are your thoughts on this theory? Also, I don't believe in buying solely for the reason of a potential takeover - I have read your aren't fans of the smaller banks, but in your opinion do any of them have anything else going for them?” - Thanks in advance, Richard H
Hi Team, Question, I bought Westpac (WBC) at $19.07 and wanting your thoughts on if I should sell take a loss and invest elsewhere that you think would have better growth option in medium term, or should I just hold Westpac?” - Thanks, Isaac B.
Hi Guys,
Below are general comments only and we certainly haven’t taken your personal circumstances into account.
The banks have been a tough ride for many local investors including ourselves and the removal of their dividends, albeit hopefully in the short-term, has certainly forced many investors to rethink their ideas. When banks announce bad debt provisioning, they do so based on a range of assumptions,
the banks will indeed be extremely well capitalised if bad debts don’t balloon as much as many fear due to COVID-19, theoretically it all comes down to how well Australia can flick on the lights after the pandemic, much of us started last weekend! CBA is the best capitalised bank post recent asset sales, NAB given its just raised capital although they have the lowest COVID-19 provisioning, followed by WBC then lastly ANZ.
We are actually pondering the best way to move up the “risk curve” with regard to the banks over the next 6-months, in line with our view on the Value Sector. Our current thoughts on the banks are below.
1 – We can see another leg lower in the banks as they fail to bounce with the market. A retest of 2020 lows will not surprise hence we are not considering increasing our exposure at current levels.
2 – If we are correct and the ASX rallies short-term and the banks can come along for the ride to a certain degree we are tempted to take some $$ on top performer with a view to re-entering the sector via a more beaten up member at lower levels e.g. one of the regionals
MM likes the banks medium-term, short-term they still look vulnerable.
Westpac (WBC) Chart

Question 4
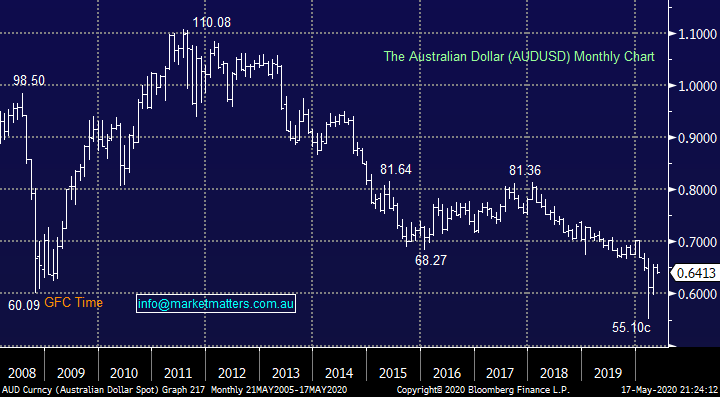
“Hi James, I have recently reengaged in the MM service and find the morning update tropical with timely information, Thank you. My question related to MM forecast of the AUD, and being in a similar industry as you, I understand that most economists will have different view on the currency and as they say their correct 50% of the time, or may be the flip of a coin will provide a similar outcome? For now I wanted to understand the MM view in comparison to the comments below who have the opposite view on the AUD - “Re the currency, no question Australia is doing a far better job of managing the virus than others to this point but the real pain will be felt shortly when we collectively attempt to go back to work. We believe the liquidity fuelled rally is starting to give way to the insolvency induced sell off in risk markets. If we are right on this, we would expect the $AUD to fall again towards 60c. Australia is a small open economy, highly dependent on trade with neighbours in resources, travel and tourism, and a huge exporter of education. Its continuous growth over the last 28 years has been entirely predicated on immigration. All these elements will be vastly impacted on a go forward basis. So, we remain bearish on the $AUD.” – Brendan M.
Hi Brendan,
I cannot disagree with these comments short-term but a pullback to 60c is only retracing part of the gains from March’s panic low, we are looking for a test of 80c before 50c i.e. a longer-term outlook. Our call is not a big deal in the scheme of things when we consider the $A has halved since its dizzy heights back in 2011. We are looking for stimulus fuelled pick up in global growth and hence commodities in the next 1-2 years which is bullish our currency plus we feel the interest rates differential between the 2 countries will slowly but surely revert back to a higher rate locally, the more common scenario over the last few decades.
MM remains bullish the $A medium-term.
The Australian Dollar ($A) Chart
Australian & US Central Bank Interest Rates Chart

Question 5
“Hi James and Team, thanks for the great work you do. Do you guys have any insights of Megaport (MP1)? They recently raised capital and the shares going strength to strength. Also is Mesoblast (MSB) worth a punt especially now after raising capital?” – Pat.
Hi Pat,
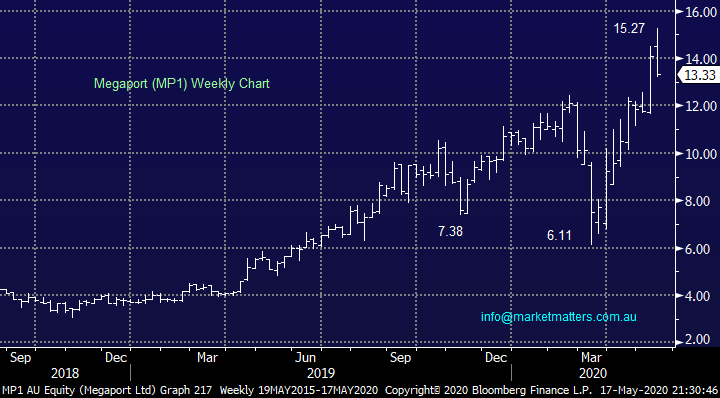
Many stocks that have raised capital during these unprecedented times have performed strongly with obviously the reasoning behind the raise one of the main factors determining the post raise performance. MP1 is a Brisbane based software-based elastic connectivity provider, another cloud related business that has boomed in 2020 – its market cap is now over $2bn. With computer infrastructure moving by the day from local servers to the cloud MP1 is perfectly positioned and its stock has rallied accordingly. The question being how much good news is built into a $13 price.
The company’s strong revenue growth and 70% increase in revenue to almost $26m for FY2020 is attractive as is its exciting 19% rise in recurring monthly revenue this year, now above $5m. The stocks not cheap but its doing everything right in the right sector.
Morgans & Evans and Partners are the 2 top analysts on the stock, with $12.87 & $12.27 price targets respectively.
MM is neutral positive MP1 with stops under $12.
Megaport (MP1) Chart
Biomedical business MSB has doubled since the pandemic broke out on the back of its trials for coronavirus patients but this could end very abruptly – we feel a high risk play.
MM is neutral / bullish MSB plus we feel stops need to be under $2.50.
Mesoblast Ltd (MSB) Chart

Question 6
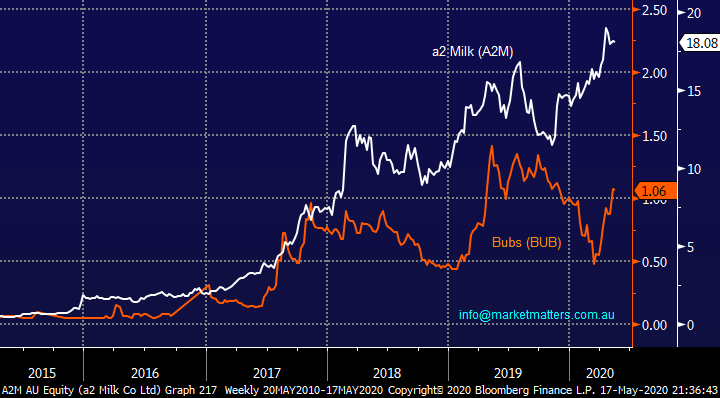
“Hi James, Thanks for the updates again this week. Could I ask for your thoughts on BUB, compared to A2M - two dairy/infant formula companies. BUB is in the early stages growth and expansion. Their point of difference is that they use goat milk rather than cow milk. What’s the chances it could grow in a similar way to A2M? Have they got the foundations right to build upon?” - Cheers, Alan P.
Hi Alan,
Two very different sized businesses with exposure in different areas i.e. mainstream milk (A2) v Goats milk formula, the size of the addressable markets are different so I think A2 has a better exposure overall, however as I’m sure you’ve noticed BUB has started to perform strongly on a comparative basis. A2M is a quality business that is evolving strongly but it’s likely to be harder for it to rally say 20% from here than BUB but similarly on the downside BUB is likely to be more vulnerable.
If I held A2 I could see the logic is switching part of it into BUB but it would be minor portion of the dairy / formula position.
a2 Milk (A2M) V Bubs Ltd (BUBS) Chart
Question 7
“Hi Team, I am a new subscriber who is really enjoying your technical/ market views and would appreciate your thoughts on 1. Genworth Mortgage Insurance AUS - GMA, they have basically halved from my purchase price of $4 and I am wondering if I should average down /hold/ sell?
2. I am way overweight ANZ and Westpac in my portfolio at an average entry price of $27. Is it a wise move to average down at current levels /hold/ sell and if so a suggestion would be appreciated” – Regards Adrian B.
Morning Adrian,
I’m delighted to hear your enjoying the service and thanks for the question.
We’ve owned this stock in the past, selling it at the end of January this year at $3.69 from the income portfolio. We know it well and also know how volatile it can be.
I like GMA here from a risk / reward perspective and have considered once again adding it to the income portfolio. They have excess capital on their balance sheet and while they have decent exposure to housing, they are very conservatively managed for these exposures.
MM is bullish GMA with stops below $1.90.
Genworth Mortgage Insurance (GMA) Chart

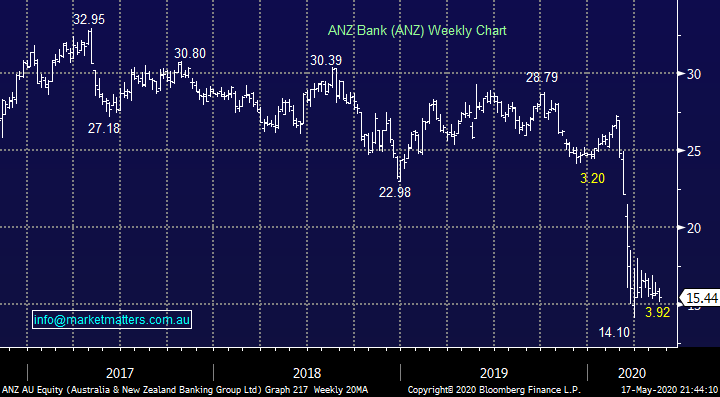
I touched on the banks earlier, ANZ is the weakest capitalised in the sector and our least favoured - the stock would need to below $14 for us to consider i.e. fresh 2020 lows.
ANZ Bank (ANZ) Chart
Question 8
“HI MM Team, could I get your analysis for Fortescue (FMG) and Northern Star or gold stocks in generally? Also is it possible to have another interview with Peter O’Connor from SHAW & Partners for his view for iron ore, copper, etc” - Thanks Tim.
Hi Tim,
The good news is we are planning another interview with Peter O’Connor amongst others, watch this space!
FMG looks great and a break of $13 feels almost inevitable, Twiggy Forrest is getting richer by the day!
Fortescue Metals (FMG) Chart

We discussed our bullish outlook for gold in the Weekend Report, we feel NST will test $16 in 2020 / 21.
Northern Star Resources (NST) Chart

Question 9
“Hi James, Regarding XRO - on Friday there were various statements regarding Xero from Macquarie, and Credit Suisse I think was the other. One had a valuation of $7.50 and the other a valuation of around $8.80. Obviously, each has different underlying assumptions in their algorithms. How do you process these sorts of discrepancies in the reporting? Are some typically looking longer or shorter, or more optimistically or conservative than others?” - Regards, Alan P.
Hi Alan,
I assume your quoted valuations on XRO were a typo otherwise the markets very bearish XRO, but seriously the numbers above simply need to be multiplied by 10. You are 100% correct, valuations are subjective and based on a whole lot of assumptions. On XRO for instance, there are 5 sells, 5 holds and 6 buys, the most bearish sell is Morningstar with a $46 price target because they mostly just use price / earnings bands, while the most bullish is Evans and Partners with a $92 price target – that’s some variance! The consensus price target for the stock is $76.73.
MM is bullish XRO from its current area.
Xero Ltd (XRO) Chart

Question 10
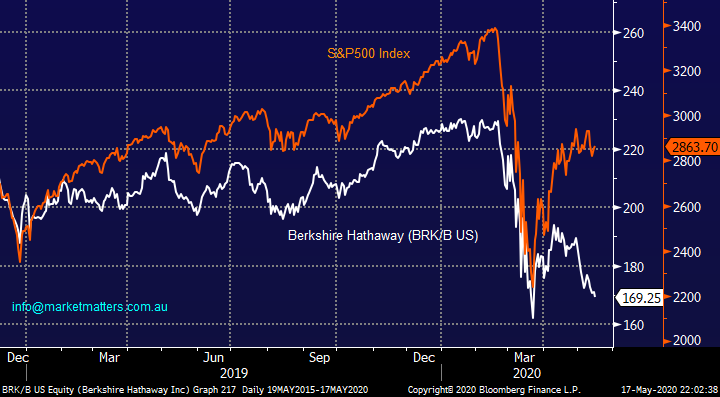
“Hi James, I was reading the news on the weekend. I saw that Warren Buffett's Berkshire Hathaway cuts stake in Goldman Sachs. He was buying Goldman Sachs during 2008 GFC. Is he seeing something different this time? Should we cut our banking holdings e.g. CBA and MQG? Warren Buffett is still holding enormous amount of cash; does it mean that he has not seen the bottom yet? or another big crisis is slowing approaching?” – regards Peter L.
Hi Peter,
I read the same article after noticing how badly his stock had fared in 2020. Undoubtedly, he doesn’t feel the markets as cheap as in 2008/9 considering the uncertainty that COVID-19 brings, this is not a financial problem which he will undoubtedly understand more thoroughly – it’s his bread and butter. The other aspect would be the speed of the decline and the size of investments Buffett now needs to make – I actually think size is now a major hindrance to future success, not to mention the changing of the guard at some point.
At this stage I wouldn’t be reading too much into his actions, especially as we only see them in a delayed manner, he might have been buying aggressively in the last few days!
Berkshire Hathaway Inc (BRK/B US) v S&P500 Index Chart
Question 11
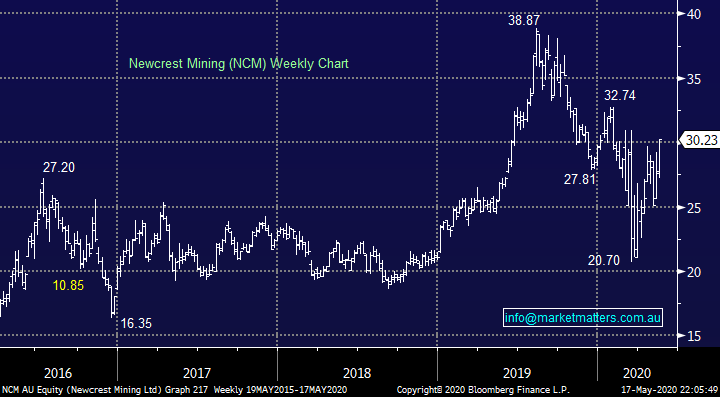
“Hi MM I know this has been addressed but can you please give me your current thoughts on the NAB and NCM SPP. You were positive NAB and Neutral NCM Has your view changed? Also for someone who is holding NAB from the $30 level the SPP is very attractive to average down but I also hold ANZ, WBC and CBA from higher levels - would the funds be better off being utilised in another sector then sinking more in the Banking sector?” - regards Debbie G.
Hi Debbie,
Just a reminder we provide general advice only, not advice specific to your circumstances. I discussed our thoughts towards banks earlier, we like them over the coming years but another “washout” would not surprise hence as we said MM is remaining patient with regard to adding to our bank positions until further notice, however, if we held NAB, we would participate in the SPP given it is priced at $14.15 versus last close at $15.46
NCM is not our favourite gold stock, just look at its performance below compared to NST shown earlier, but we are bullish gold as a sector and given the recent moves in both Gold and NCM, the SPP in NCM now looks very attractive.
MM is neutral / positive NCM at present.
Newcrest Mining (NCM) Chart
Question 12
“Hi James, I have enjoyed your take on stocks and the share market itself for quite a while now I have followed your “commentary” on all things with interest hoping to become a more informed and better Investor BUT, there always has to be a “BUT”, surely you must realise that the continual “belting” of US President Donald Trump will not go down well with some of your subscribers!!! We are not all Left Wing and gullible ... Please, in Trumps case, give some credit where it is due, so you give a balanced view!! Otherwise, all is well.” - Kind Regards Glenn Q.
Hi Glenn,
I would not put myself in the “left wing and gullible” camp but I take on board your comments. We have been impressed with much of his economic moves just not how he’s dealt with COVID-19, sorry if I have been too vocal on that front.
For example we were both impressed and positive on his results with tax cuts, banking / financial regulations and getting a farer deal from China and the market agreed looking at its performance since his election, nobody can blame him for the breakout of COVID-19 but it will probably make his re-election a tougher proposition.
MM remains bullish the S&P500.
US S&P500 Index Chart

Question 13
“Hi James and Team, many thanks for another informative week. Can you provide a quick comparison between AIA and SYD. I understand that AIA owns the site whilst SYD appears to be carrying lots of debt. Which stock has the best upside after full travel resumes?” - Many thanks, Cheers David P.
Hi David,
I think the chart below says it all, the market treats them in an extremely similar manner, I would imagine having to the same degree they will also recover along a comparable path. You’re right in terms of AIA owning land while SYD has a long lease, both however both carry high debt levels. SYD is much bigger, Auckland much smaller, ultimately, I think it’s a toss of the coin choosing one over the other and recent performance shows that. We recently bought SYD in the MM Income Portfolio.
Sydney Airports (SYD) v Auckland International Airports (AIA) Chart

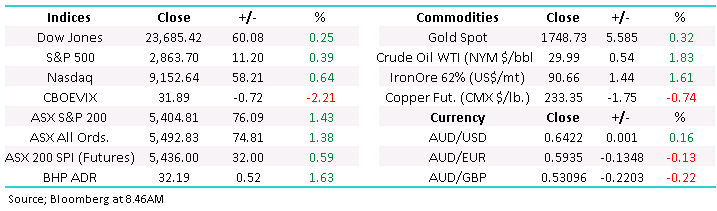
Overnight Market Matters Wrap
- The US equity markets managed to end higher Friday despite more weakness in economic data
- Crude oil continued to rally on signs of improving demand from China as their economy starts to return to more normal levels. Safe haven, gold also rallied again to a 7-year high level of close to US$1750/Oz.
- The June SPI Futures is indicating the ASX 200 to open 35 points higher, towards the 5440 level this morning.
Have a great day!
James & the Market Matters Team
Disclosure
Market Matters may hold stocks mentioned in this report. Subscribers can view a full list of holdings on the website by clicking here. Positions are updated each Friday, or after the session when positions are traded.
Disclaimer
All figures contained from sources believed to be accurate. All prices stated are based on the last close price at the time of writing unless otherwise noted. Market Matters does not make any representation of warranty as to the accuracy of the figures or prices and disclaims any liability resulting from any inaccuracy.
Reports and other documents published on this website and email (‘Reports’) are authored by Market Matters and the reports represent the views of Market Matters. The Market Matters Report is based on technical analysis of companies, commodities and the market in general. Technical analysis focuses on interpreting charts and other data to determine what the market sentiment about a particular financial product is, or will be. Unlike fundamental analysis, it does not involve a detailed review of the company’s financial position.
The Reports contain general, as opposed to personal, advice. That means they are prepared for multiple distributions without consideration of your investment objectives, financial situation and needs (‘Personal Circumstances’). Accordingly, any advice given is not a recommendation that a particular course of action is suitable for you and the advice is therefore not to be acted on as investment advice. You must assess whether or not any advice is appropriate for your Personal Circumstances before making any investment decisions. You can either make this assessment yourself, or if you require a personal recommendation, you can seek the assistance of a financial advisor. Market Matters or its author(s) accepts no responsibility for any losses or damages resulting from decisions made from or because of information within this publication. Investing and trading in financial products are always risky, so you should do your own research before buying or selling a financial product.
The Reports are published by Market Matters in good faith based on the facts known to it at the time of their preparation and do not purport to contain all relevant information with respect to the financial products to which they relate. Although the Reports are based on information obtained from sources believed to be reliable, Market Matters does not make any representation or warranty that they are accurate, complete or up to date and Market Matters accepts no obligation to correct or update the information or opinions in the Reports. Market Matters may publish content sourced from external content providers.
If you rely on a Report, you do so at your own risk. Past performance is not an indication of future performance. Any projections are estimates only and may not be realised in the future. Except to the extent that liability under any law cannot be excluded, Market Matters disclaims liability for all loss or damage arising as a result of any opinion, advice, recommendation, representation or information expressly or impliedly published in or in relation to this report notwithstanding any error or omission including negligence.