Subscribers questions (KDR, ORE, AVZ, FIG, PTM, BHP, CMA, VCX, NHC, GEM, QBE, MYX, A2M)
The news flow over the weekend was light but net positive with Mr Trump pleasingly quiet and China announcing they would host US officials for a new round of dialogue on trade issues which feels like a soothing action at this stage.
Also, over the weekend Sydney property auction results were ok and as every week passes without the largely predicted tumble we can see local banking shares regain some favour. We saw a couple of bullish statistics on Livewire this morning which supports what we’ve been frequently discussing in 2018;
1. Over the last 40-years when the Australian All Ords has fallen in Jan / Feb the average return in March / April was +6.85%.
2. Since 1998 the average return by our banking sector in March / April was +5.33% and the number kicks up to +6.32% since 2008.
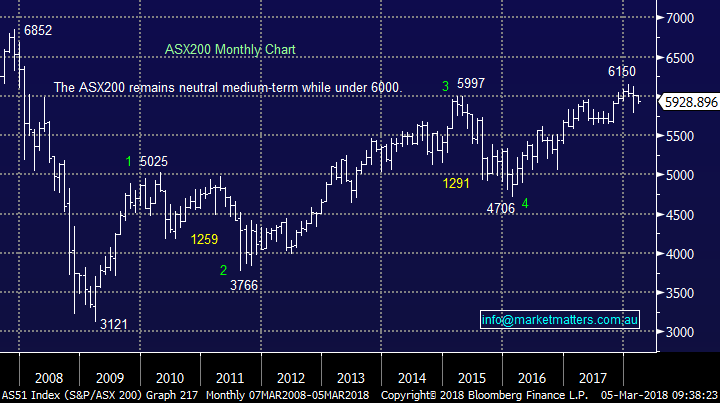
The current volatility is scarring many but we should remember it’s what MM expected at the start of this year followed by rally into May, so were on track at present.
ASX200 Chart
We had some timing issues on the Weekend Report with the attached “Chart Pack”. For the small proportion of subscribers that did not receive the Chart Pack, please see below link.

We have again received a record number of questions this week, I have answered as many as possible but please excuse the brevity at times. Thanks – keep them coming!
Question 1
“What is your sell plan for a developing resource company like Kidman Resources KDR which starts production in 2019? Do you plan to hold such a share or sell all resources regardless of near term production plans?” – Thanks Neil.
“Hi MM, for your own trading perspective, can you please give us your outlook on the March-April Lithium Price and Activity, also what might you expect for 2H2018. We do know that Lithium prices “softened” in January due to the end of year break, but we cannot find an updated chart sufficient to make an investment value judgement. Lucky for us we bought GXY around 2.90, but it does not seem to be recovering its former glory. Also, is the possibility of Lithium Refinement in Australia a reality? Also find attached a report which you may have already read.
Very amazing numbers like half a million tonnes of lithium required annually by 2025 with the volume increasing as places like China move from 20% of all new vehicle sales being EV to 50% and beyond. The world’s largest car manufacturer VW investing tens of billions of dollars into EV car development. As a senior electrical engineer who worked in Power Generation for several years, I find this very exciting, plus transport is only one use for EV batteries." - Thanks Phil
Morning Neil / Phil, thanks for the great questions and information, especially following the significant volatility in the lithium space last week e.g. Orocobre (ORE) -10.2% and Galaxy Resources (GXY) -9.9%.
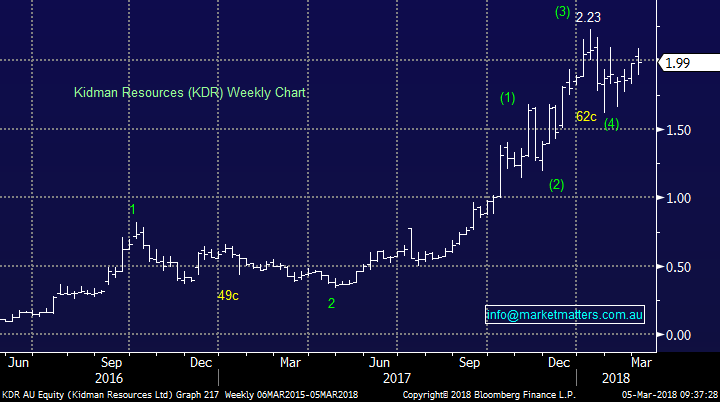
Fortunately, our position in KDR fared better closing up 1c at $1.99. At this stage we simply intend to follow our original plan with our KDR holding which is to take profit around $2.25-$2.30. The stock has rallied from ~50c in mid-2017 and there is now a lot of optimism built into the share price, although at MM we believe it’s well founded.
Our view is KDR is likely to trade between $2.30 and $1.60 over the next few years as the market waits for the lithium story to evolve hence we are happy to be sellers into fresh highs but would re-enter back towards the lows of 2018 – note the stock usually oscillates 50c per month!
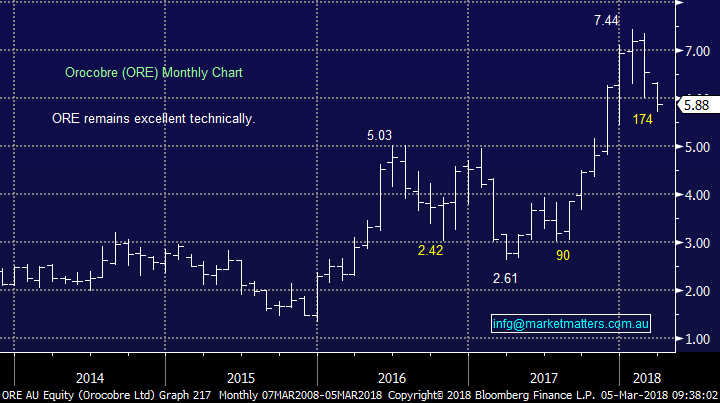
ORE remains our second favourite stock in the sector and we could be buyers around $7.60 however due to prudence we are unlikely to add aggressively to our lithium exposure at this point in time.
Kidman Resources (KDR) Chart
Orocobre (ORE) Chart
Question 2
“Hi, while we are keenly waiting for a 20% correction, wondering what’s going to be the action plan. Any buy lists? Are you'll looking to buy into an index? Plus, Any comments on AVZ and FIG? Suggestions on entry/exit prices if so. Thank :) Best Regards,” – Lakshan.
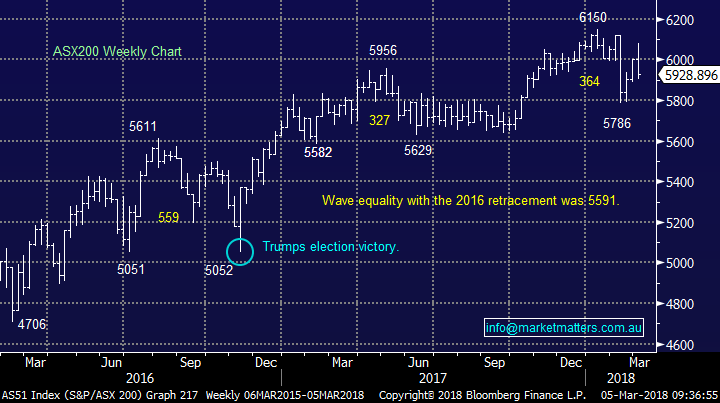
”The charts show a classic Elliott wave pattern from the bottom of the GFC - 5 waves up (1 up, 2 down, 3 up, 4 down, and final 5th wave up. Now we should have a wave down, b wave phantom up correction lower than top of wave 5, and c larger correction down.” -Dave
Hi Lakshan, thanks for our first “emoji” in a question, and thanks of course Dave.
You're correct Dave, we believe that when technical fit use them but be happy to quickly move on.
· Your interpretation is correct hence we expect suib-5000 in the next few years.
With regard to the 20% pullback we have a number of objectives:
1. Firstly, we intend to be holding a very high cash position.
2. Secondly, we will likely take a negative equities position via an ETF
3. Thirdly, sure we have a buy list but our view is patience will be required early in this correction hence we have not prematurely started outlining these plans.
The other 2 stocks you’ve mentioned are very volatile and we have not invested in them previously hence our views are purely technical:
· AVZ Minerals (AVZ) 24.5c – we could be a buyer ~20c with stops under 15c.
· Freedom Insurance (FIG) 38c – after falling well over 50% it’s hard to get excited with this, we can see a bounce towards 50c but this is not a company we would consider.
ASX200 Chart
Question 3
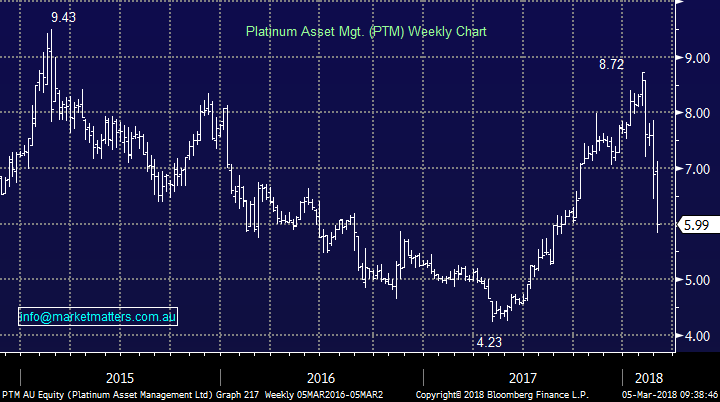
“Hi MM, I'd be interested to hear your thoughts on Platinum Asset Management (PTM). I understand why the market reacted negatively to Kerr Neilson's announcement that he's stepping down as CEO, but surely this is an overreaction and the stock is now over-sold at $5.99.” - Cheers, Greg.
Morning Greg, the share price has certainly given little confidence in what comes next with all the focus on what a brilliant man the company has lost – My first thought is Steve Jobs passing has not ended APPLE’s charge.
Let’s consider its valuation compared to its piers simply using the estimated 2018 P/E i.e. PTM 18.1x, IFL 18.4x, CGF 18.7x, PPT 16.4x, MFG 18.55x and JHG 12x.
Now it suddenly looks like the stock has been rerated back to the pack and is not particularly cheap. Overall, we can see further volatility in PTM including probably a 10% bounce from beneath the $6 area but we see it more as a trading stock at present considering our overall view for stocks medium-term, as opposed to a buy and hold opportunity.
Platinum Asset Management (PTM) Chart
Question 4
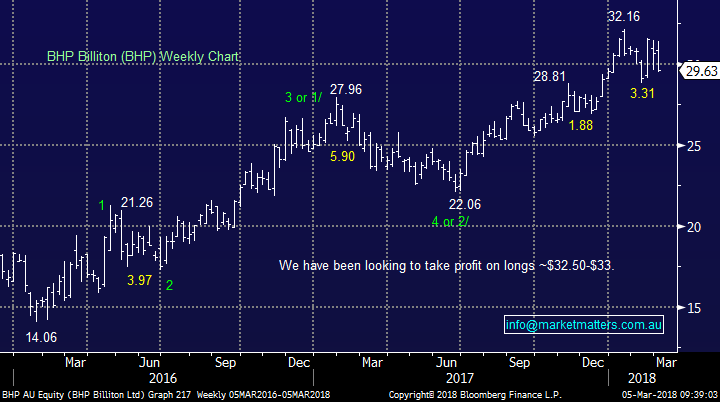
“BHP - lower lows, lower highs. In the danger zone.” – Smithy
I totally agree, I’m not happy with BHP’s performance recently and touched on it in the Weekend Report. At this stage I am giving our BHP holding the benefit of the doubt:
1. BHP is usually strong in April following it dividend in March.
2. I still think the $US Index makes one more low and the Emerging markets one fresh high and they both have a large correlation to BHP’s share price.
NB BHP trades ex-dividend on Thursday US57c fully franked.
BHP Billiton (BHP) Chart
Question 5
"Hi guys, I hold both of these stocks GMA and VCX from your previous recommendations.
My question is that they look very oversold currently so is it worth buying more at the current price to average out a bit.
What are your thoughts on this and have you got faith that GMA will reach your $3.50 target anytime soon.
Thanks and love your work."
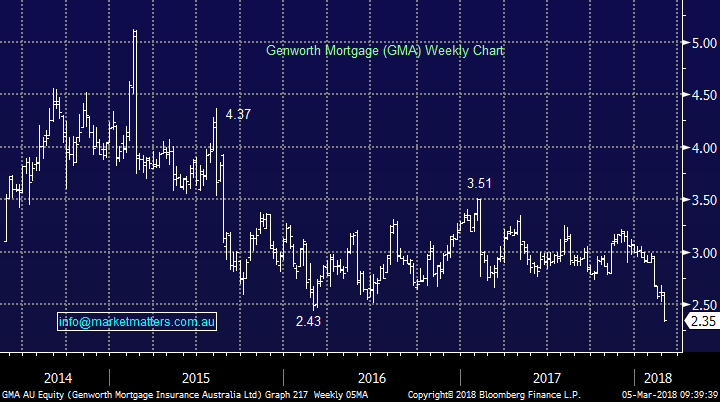
1. Genwoth Mortgage (GMA) - technically a stock making fresh all-time lows has to look poor, and at this stage GMA does. I would become bullish on a close back over $2.61 which is essentially a move back over last week’s high. Of course, the stock went ex-dividend for 12cps fully franked last week which equates to ~17cps gross. We hold GMA because it’s cheap, has excess capital and our original thesis was the market had become too bearish housing + of course the yield was huge. These elements still stack up but it seems the market does not agree with us, and the market is always right! This is a stock on the chopping block, but looking for better levels.
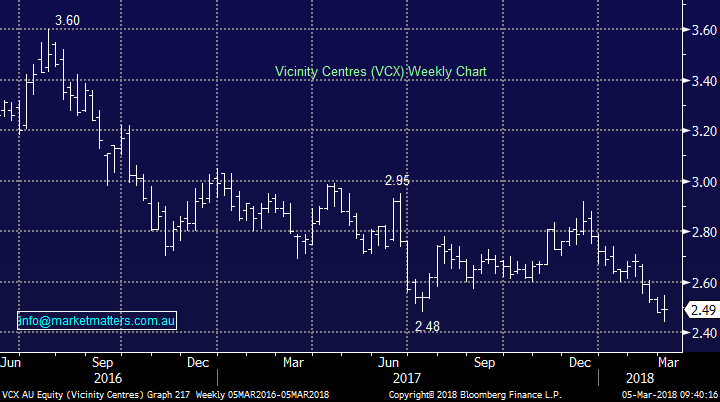
2. Vicinity Centres (VCX) – We can see a few weeks between $2.40 and $2.60 but the downtrend still feels fully intact. We wrote the following in this week’s income report that holds true. We are negative property yet we hold Vicinity (VCX) - a retail landlord. This too is a value / yield play however it’s gotten cheaper since we bought - the position showing a ~5% paper loss. VCX reported an inline result mid-month with occupancy at 99.5% with a WALE of 5.2 years – which is the weighted average lease expiry. The retail sector is facing challenges (as shown through margin compression of our retailers) and Vicinity are getting hurt as a consequence. They are trading at a 13% discount to the value of their assets – which is cheap. The macro backdrop goes against this holding and at the moment that is winning out. This stock remains on our SELL radar and we have no interest in the property sector in a general sense.
Genworth Mortgage (GMA) Chart
Vicinity Centres (VCX) Chart
Question 6
"Hi, I believe coal will the bedrock of the world's energy system for many years to come. Now that BHP, S32, and WES all seem to be getting out of coal, I am looking to invest elsewhere, and New Hope Coal seems favourable for investment as a responsible and innovative Australian miner, despite the nasty activism it endures from time to time. Do you have a recommendation?” – Phil
Hi Phil, I cannot say that I agree with you but when large companies like BHP and WES all exit one market fairly quickly it clearly leaves an opportunity for smaller players.
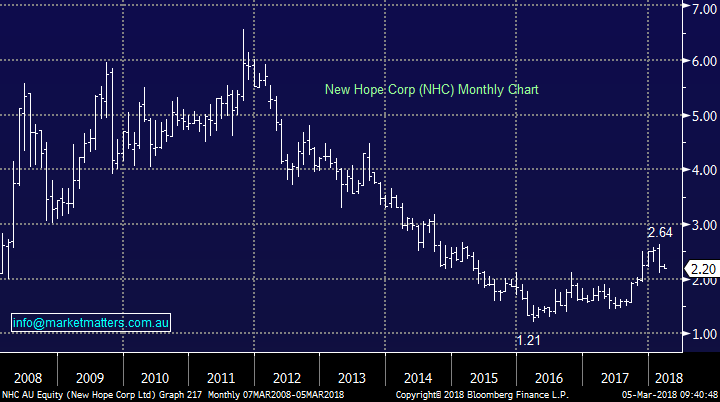
When I look at NHC it moves very similarly to our resources sector as a whole, especially since early 2016. Following its 17% pullback from 2018 highs the risk / reward from a technical perspective is ok:
· I could buy NHC around / under $2.20 targeting at least $2.70 with stops under $1.90 – ok for investors keen on the sector. You may have noticed a few smart guys in the coal space exiting recently. Tony Haggarty of Whitehaven (WHC), who was the ex-CEO and large holder has just sold 90% of his stock.
New Hope Corp (NHC) Chart
Question 7
“Hi Team, I can't say I agree with your comment: "All the usual conditions of bank tier 1 securities apply with the capital conversion trigger and the non-viability trigger imbedded in this security, which is usual. Based on the current bank bill rate, this security will pay a grossed up yield of 4.97% - floating – with dividends paid quarterly
Given the terms of these securities are fairly standard,.."
In fact the risk terms are far worse than the issue they are replacing. Basically an equity wolf dressed up in sheep's clothing!!
I'm a bit disappointed you have been so matter of fact about the downside risks in these securities. One of the reasons the institutional market does not invest in them."
Best regards, Ian
Very good question / comment Ian as we think it’s a very topical area – has been for a long time.
The WBC hybrid security that we discussed (click here if you missed it) – the (WBCPH) is a typical Tier 1 security in the post Basel III world whereas the security it is replacing was issued prior to the new Basel III conditions. The main difference between the two is the non-viability clause which has been introduced after 1st Jan 2013. Basically, this means that APRA at its sole discretion can force a listed issuer of these notes (WBC) to convert the notes into shares. The idea is that tier 1 capital should be permanent and that is another safeguard (for the issuer and the regulator) that the capital will stay with the bank under extreme circumstances. There are some other minor changes however that is the main one. Nearly all new Tier 1 Basel III compliant securities will have the same conditions, and this WBC issue is no different.
In terms of the institutional market they do invest in these type of securities, I sit alongside an Institutional Hybrid Desk that managers and deals for many institutions around the country. The notion that institutions don’t invest here I think was perpetuated by a well-known retail focussed bond broker that made a business decision (in the early days at least) to scare investors away from hybrids into over the counter bonds that could be held in custody and charged a big upfront fee for doing so – but we’re typically cynical at MM!
Importantly, and this speaks to your point, a Hybrid is not cash, it’s not a bond and it does have equity characteristics along with a number of important conditions. Under certain extreme circumstances it will morph into equity however as with any investment decision, it’s about understanding what you are getting - making a call on the probability of the events transpiring that could force the sheep’s clothing to suddenly drop off an expose the equity wolf you mention, and whether or not the returns being offered compensate for the quantum of risk being taken on.
Question 8
“Hi James, I'm so impressed with your service that I've taken out a 2-year subscription. Like how you are so responsive, and that you are willing to admit you can't get everything correct all of the time. Very authentic. People like that.
Could I get your view on GEM as a medium-term investment? The grossed-up yield is nearly 10% and cum a 10c divi. Some "experts" have a valuation over $3.50. Today, about $2.70.” - best wishes John.
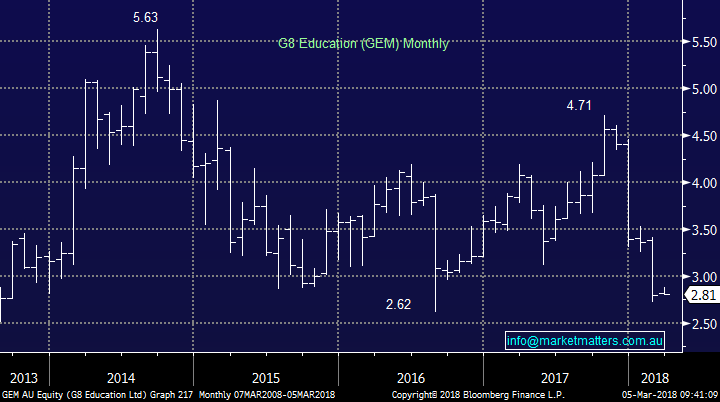
Hi John, thanks for the positive comments - much appreciated. Firstly, be careful focusing on yield in underperforming stocks the market is voting that it’s not sustainable – think Myer and Telstra. I wrote the following the day of their recent result and that still holds true; GEM was whacked today and this is a stock we discussed as a potential income play a few months ago but on further analysis, gave it a wide birth. They missed on most metrics and the very poor recent run for the early childhood company continued. The main issue today was not the miss in terms of profit (underlying of $93m v $100m exp) but occupancy which is still weak suggesting no real turnaround / improvement in the offing. There will be a time to buy this one, but just not yet.
As I suggested that day, there will be a time to buy GEM however unfortunately, we believe the company / stock still looks weak and we would not be considering it at this point in time until it was closer to $2.
G8 Education (GEM) Chart
Question 9
“Hi. I am a very recent Platinum member and impressed with your work so far. I have been on the sidelines watching QBE for a while but currently not holding. I know you do. Is now a good time for me to buy? Income is not my main objective.” - Regards, Mark
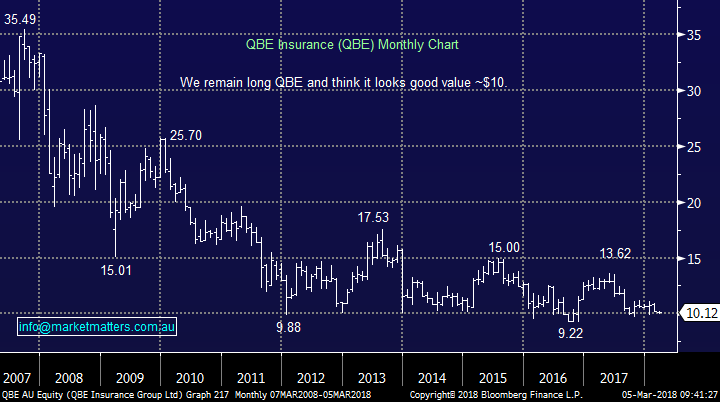
Hi Mark, QBE has given us our fair share of frustration over 2017/8 as it struggles on the corporate level even with tailwind of a weakening $A and rising global bond yields. Our view at MM is the macro picture will remain favourable for QBE and the new captain at the helm will steer the ship in far better direction. The market hates it, which is understandable however simply put, we think there will be a time soon where all the drivers for QBE earnings will finally provide a tailwind.
We like QBE around $10 but leave room / ammunition to average down towards $9 as the market is far from convinced!
QBE Insurance (QBE) Chart
Question 10
“Thanks for a great service – my three-year subscription cost has been recouped four times over in the first couple of months through modest investments in FMG, OZL and ORE!
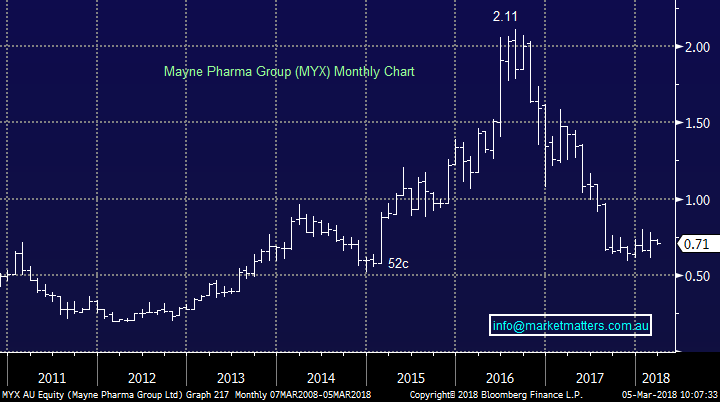
I’d like your thoughts on MYX, a stock acquired previously on what I thought were sound fundamentals (reasonable PE, low-ish debt) with quite high short selling (still 10%) that surely will be unwound at some stage unless there’s something ugly still to surface. I’m on a profit of 10% and unsure whether to “grab and run” …” – Thanks Andrew.
Morning Andrew, thanks for the great words of encouragement!
Unfortunately, I’m not a fan of MYX and regard it as a fun punting stock at best.
· I could buy a spike down towards 50c looking for a bounce back towards 80c but I’m happy to be on the sidelines.
Mayne Pharma (MYX) Chart
Question 11
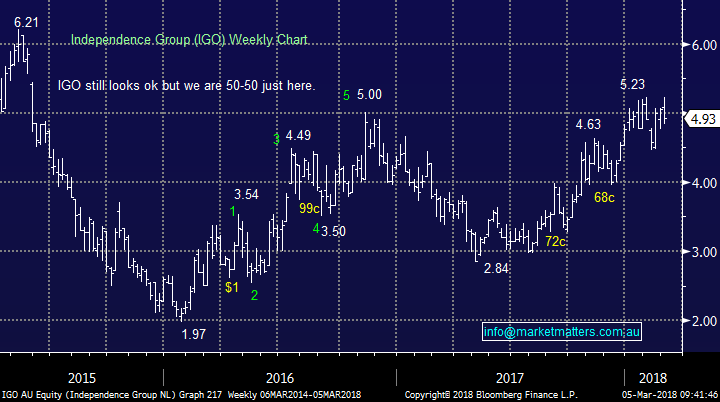
“Can you please give me your opinion of IGO and EAR” – thanks Dianne.
Morning Dianne, as you know we are looking for the last “piece of the pie” for bullish advance by resources stocks over the last few years hence caution is warranted.
1. Independence Group (IGO) $4.93 – we remain net positive IGO looking for a move towards $5.50 but risk / reward is not attractive here.
2. Echo Resources (EAR) 30c – EAR is not a stock we have ventured into but would be very concerned technically if it cannot hold 25c.
Independence Group (IGO) Chart
Question 12
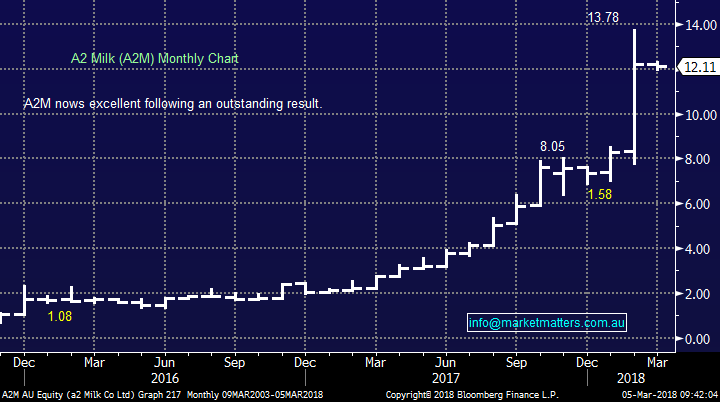
“Please get back on what to do with A2 Milk holding. I want to know your view at current level - Buy, Hold or Sell.” – thanks Tushar.
Hi Tushar, A2M has enjoyed an amazing rally over the last year as it kicks goal after goal but it’s now trading on a valuation of 45x estimated 2018 earnings i.e. it’s not cheap. Remember we are concerned for high P/E stocks as interest rates rise.
We like A2M into weakness and may consider accumulating between $11 and $12. This is undoubtedly a quality company but chasing around the $13.76 recent high we believe is dangerous from a risk / reward perspective – the stocks already corrected over 15%.
A2 Milk (A2M) Chart
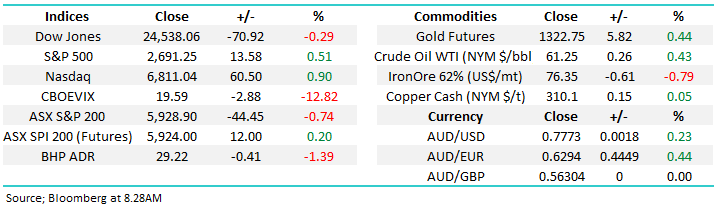
Overnight Market Matters Wrap
· The US markets closed mixed last Friday, with the Dow of 0.29% and the broader S&P 500 up 0.51%. The tech heavy, Nasdaq 100 outperformed by ending its session up 0.9%.
· With Thursday’s announcement of protectionist trade tariffs on US steel and aluminium, equity analysts are trying to determine whether this is the beginning of a much larger trade war, as President Trump threatened Europe’s car industry with tariffs should they challenge him with retaliatory policies.
· Local market attention this week will be focused on the RBA interest rates decision tomorrow (likely no change), but there is more interest in a speech by Governor Phillip Lowe on Wednesday. This coincides with the release of Q4 GDP, for which the consensus expectation is 0.5% growth.
· The VIX (volatility) index traded in a wide range on Friday, but ended the day slightly lower. 10 year bonds slightly easing to 2.87%. Both BHP and RIO ADR’s were down by 0.6% and 2.2% respectively, whilst the $A was slightly firmer, currently buying $US77.7c.
· The March SPI Futures indicating the ASX 200 to open with little change this morning from last Friday, still testing the 5930 level this morning.
Disclosure
Market Matters may hold stocks mentioned in this report. Subscribers can view a full list of holdings on the website by clicking here. Positions are updated each Friday, or after the session when positions are traded.
Disclaimer
All figures contained from sources believed to be accurate. Market Matters does not make any representation of warranty as to the accuracy of the figures and disclaims any liability resulting from any inaccuracy. Prices as at 05/03/2018. 8.13AM
Reports and other documents published on this website and email (‘Reports’) are authored by Market Matters and the reports represent the views of Market Matters. The MarketMatters Report is based on technical analysis of companies, commodities and the market in general. Technical analysis focuses on interpreting charts and other data to determine what the market sentiment about a particular financial product is, or will be. Unlike fundamental analysis, it does not involve a detailed review of the company’s financial position.
The Reports contain general, as opposed to personal, advice. That means they are prepared for multiple distributions without consideration of your investment objectives, financial situation and needs (‘Personal Circumstances’). Accordingly, any advice given is not a recommendation that a particular course of action is suitable for you and the advice is therefore not to be acted on as investment advice. You must assess whether or not any advice is appropriate for your Personal Circumstances before making any investment decisions. You can either make this assessment yourself, or if you require a personal recommendation, you can seek the assistance of a financial advisor. Market Matters or its author(s) accepts no responsibility for any losses or damages resulting from decisions made from or because of information within this publication. Investing and trading in financial products are always risky, so you should do your own research before buying or selling a financial product.
The Reports are published by Market Matters in good faith based on the facts known to it at the time of their preparation and do not purport to contain all relevant information with respect to the financial products to which they relate. Although the Reports are based on information obtained from sources believed to be reliable, Market Matters does not make any representation or warranty that they are accurate, complete or up to date and Market Matters accepts no obligation to correct or update the information or opinions in the Reports.
If you rely on a Report, you do so at your own risk. Any projections are estimates only and may not be realised in the future. Except to the extent that liability under any law cannot be excluded, Market Matters disclaims liability for all loss or damage arising as a result of any opinion, advice, recommendation, representation or information expressly or impliedly published in or in relation to this report notwithstanding any error or omission including negligence.
To unsubscribe. Click Here