Subscriber’s questions (EVN, PPT, JHG, WPL, HSN, MQG, NAB)
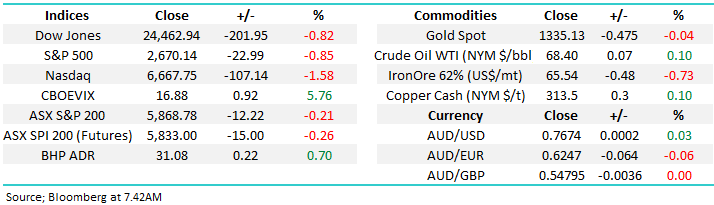
The news flow over the weekend was light but probably on balance net positive with US futures opening up around +0.3%.
- More banking / AMP bashing as the Hayne royal commission continues, it’s easy to think this cannot get any worse but we’ve all thought that before.
- The US has implied a China truce and it appears Treasury Munchin may be considering a trip to China as the dealmaker says “he’s cautiously optimistic” on an agreement with China – sounding like North Korea all over again.
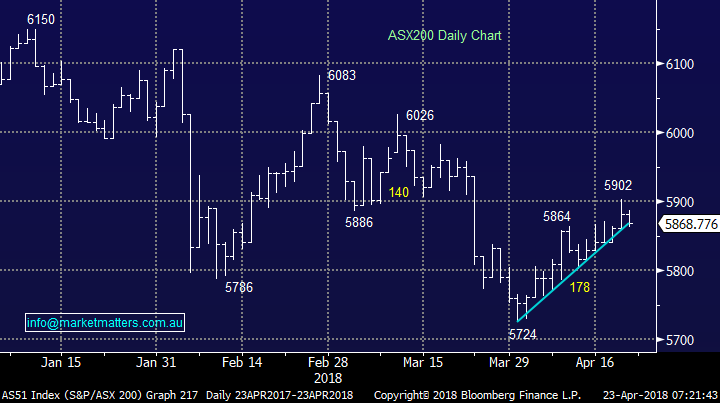
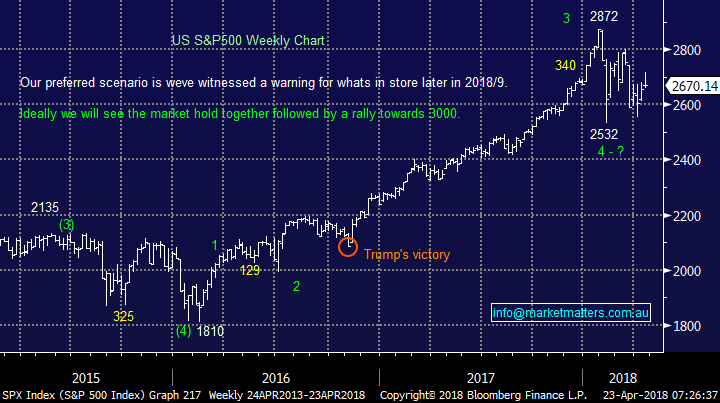
Markets remain very choppy since the aggressive volatility inspired sell-off in early February, now 10-weeks ago. While the US market is searching for a fresh catalyst to reignite the bull market optimism stocks remain bound in a 10% range and at this stage we see no obvious reason for it move away from this new comfort zone. Locally the ASX2000 has been pulled up by our resources and dragged down by the financials, leading to a subdued 3% bounce from last month’s low – we still want to see a clear close back over 5900 before moving to a bullish stance.
This week we have again received an excellent number of questions this week, I have answered 7 today a few less than usual as its school holidays and I’m on location in Noosa.
ASX200 Chart
US S&P500 Chart
Question 1
“G’Day James, In the context of buying weakness, I notice that Evolution Mining (EVN) has taken a big dive today, while its quarterly metrics look ok. Wondering if an opportunity is emerging here? I have all but pressed the Buy button but gold nerves have stopped me for today. Cheers and thanks for continuing good stuff.” – Thanks Ron O.
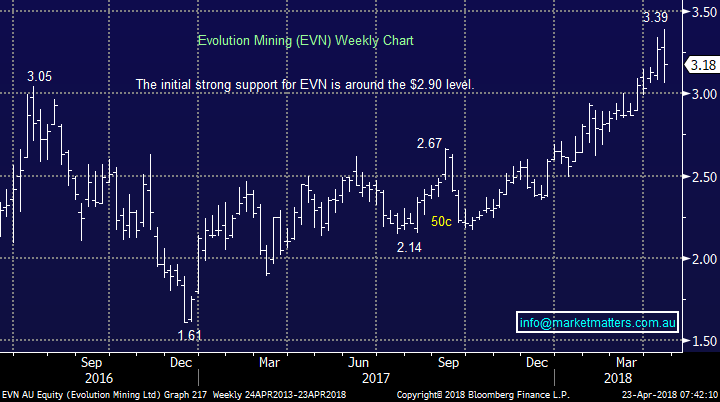
Hi Ron, an interesting one from our end with the below 3 points all in the mix and they can all be illustrated nicely with their respective charts:
- EVN itself looks ok with the ideal buy zone around $2.90, not too far away.
- The gold sector itself remains neutral, clearly shown by the Market Vectors Gold ETF which has traded sideways for well over a year.
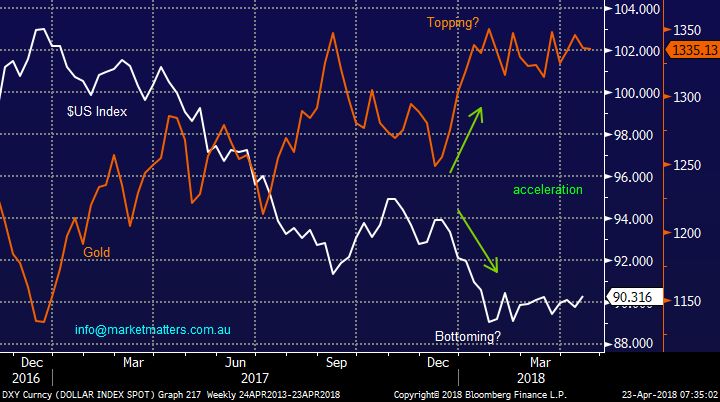
- At MM we are bullish the $US from current levels, targeting at least a 6-8% bounce. Gold is inversely correlated to the $US implying that if we are correct then gold will struggle for the next few months at least.
When we combine the above, paying special attention to number 3, we have no interest in EVN until the $2.90 area when we would evaluate the $US.
NB We do like EVN’s outperformance of the Gold ETF over the last 16-months.
Evolution Mining (EVN) Chart
Gold v $US Index Chart
Question 2
“Hi, PPT has fallen to $39.30 since your buy recommendation. Do you still see this as good entry point given we are at two-year lows or should we now wait for a floor?” – Thanks David H.
Hi David, a great question as PPT which we own / added to last week is falling with increasing momentum. Over the last year the stock is actually down -23.6%, more than AMP which has tumbled -17.3% and previous market favourite Challenger (CGF) which has dropped -13.3% - not a happy sector.
PPT’s funds under management (FUM) fell $2.6bn compared to the previous year, with the market’s performance being attributed for the blame – in other words PPT is currently trading like a magnified version of the ASX200. Also a fairly new issue for these fund managers is the increasing popularity of ETF’s which are attracting FUM and putting downward pressure on fees, two big negatives - Active fund managers earn revenues as a fixed percentage of FUM and just a tiny drop in fees can have a big impact on bottom line earnings especially when magnified by a decrease of FUM.
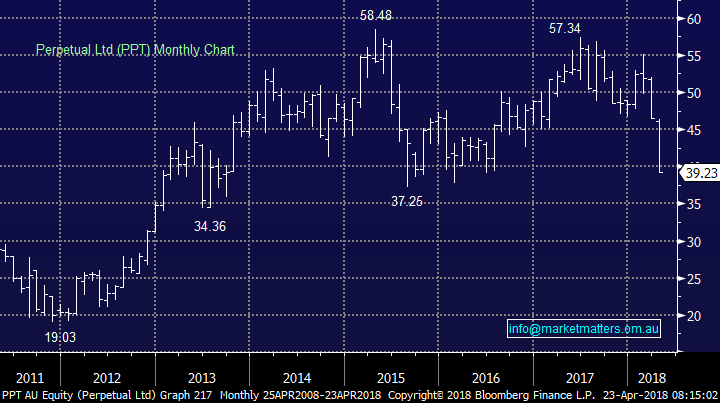
Technically in today’s volatile market, we cannot rule out PPT falling down the $35-$36 strong support area, but the panic dash for the exits feels to have gone too far hence our “top up” last week.
- We think PPT represents reasonable buying below $40, and especially around $36 with a $5-$8 bounce feeling likely.
- However, considering our medium-term outlook for stocks any buying is likely to be relatively short-term in nature.
Perpetual (PPT) Chart
Question 3
“Hi James, Janus Henderson (JHG) has been smashed in the last month to around $40. As I recall the last time you wrote about you were saying buy around the $41 mark. Can you provide an update? Disclosure … I got in at $36 equivalent and watched them go up to +$50, and back down again. Lesson – don’t be too greedy and above all, keep to a selling discipline – should have sold when there was a 25 percent gain!” – Hugh F.
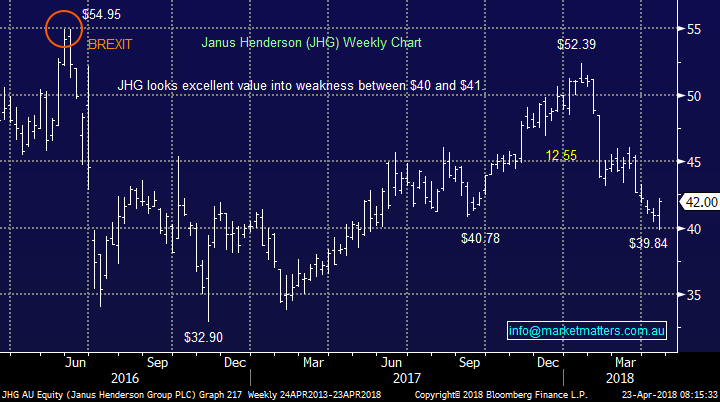
Morning Hugh, the carnage in this sector has been huge as discussed in the previous question. Asset managers are facing structural change as is illustrated by CBA looking to sell down its exposure. However we believe JHG is a good quality asset manager based out of the US and UK providing attractive offshore earnings, plus it operates in the fixed income, alternatives and equities hence giving it some insulation from the rise of index funds.
Moving forward, we can see a bounce back towards the $45 area for JHG but because of our medium-term outlook for stocks there is a strong possibility we may cut our holding here.
Janus Henderson (JHG) Chart
Question 4
“Hi Guys, I couldn't find the global fund survey mentioned in this morning’s report on the Bloomberg terminal. Could you guys send me the code?” – Thanks Mark DL.
Morning Mark, I was referring to the monthly “Bank of America Merrill Lynch fund managers’ survey” I suggest you simply Google it and add say 2018 to ensure you can read current report(s). The likes of Bloomberg, CNBC and Reuters often write articles providing excellent summaries which again can be found via Google.
Question 5
“Dear James I recently took up the rights issue from WPL through my broker. Did this mean that I received a 1 for 9 extra shares at $27? I don't seem to be able to get my head around capital raisings and rights issues. The amount of shares I have in my portfolio hasn't changed.” - Thanks Otto.
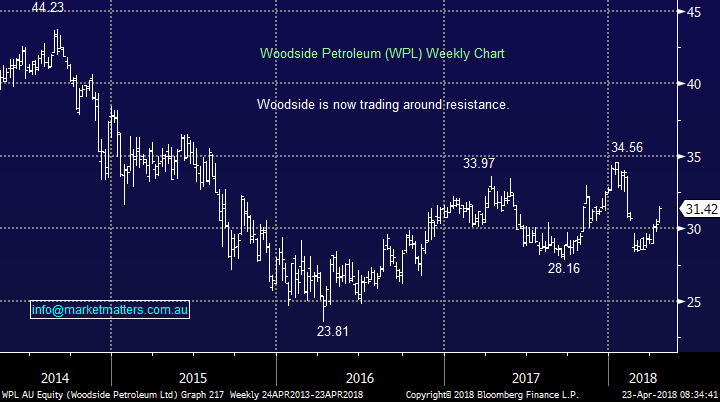
Morning Otto, yes you are 100% correct you received 1 share at $27 for every 9 shares you owned i.e. a healthy discount to the last few years lowest price. I’m not sure what portfolio tool / broker you use, but they should already be showing up.
Woodside Petroleum (WPL) Chart
Question 6
“HI MM, do you have any opinion / analysis on Hansen Technologies (HSN), also could you advise technically any opinion on Macquarie Group (MQG)” - Thanks Tim
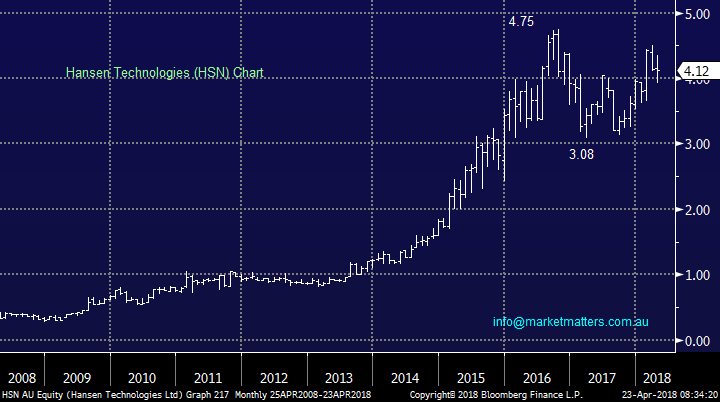
Morning Tim, thanks for the question showing the excellent last few years for HSN now making it a $810m company. For those new to HSN it’s a Victorian company which develops, supports and integrates billing systems software for the telco’s / utilities sectors in Australia.
- Technically HSN looks strong with another test of $5 feeling likely, assuming the $3.90 area can hold – great risk / reward for the active investor.
Hansen Technologies (HSN) Chart
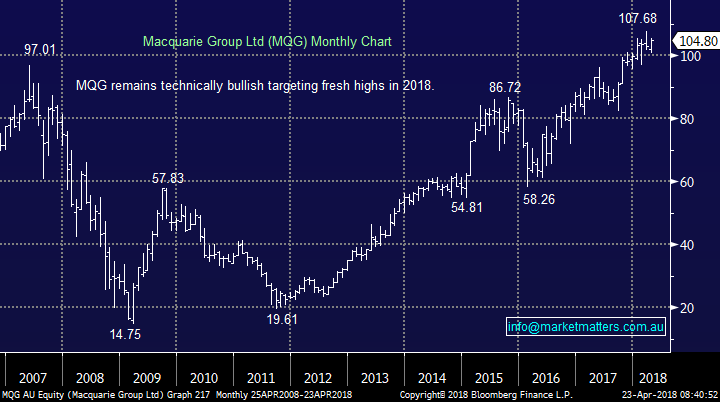
- Our technical opinion of MQG is similar to the resources sector i.e. buy weakness / sell strength.
- We are long and will consider taking profit if / when MQG tests the $110 area, alternatively it still looks good buying around the $97 area.
Macquarie Group (MQG) Chart
Question 7
“Hi James, back in Nov 2016 you posed the question "could growth stocks be oversold?". After reading your report I thought so and acted, and have done nothing since, other than book a 50% gain from a diversified group of quality stocks, thank you! My question is this, am I wrong thinking advisers and fund managers are vulnerable to the truism 'to a man with a hammer everything is a nail'? Surely there are days, weeks where James is tempted to simply say 'do nothing' but could I envisage you saying it? Don't think so. Just waxing lyrical, interested in your take. I understand the difference re trading and investing, just curious re as Kenny says 'know when to hold em' discipline versus the pressure to 'be seen as interesting or exciting' on a weekly basis. PS. is it time for me to switch to the Banks?” – Thanks Bernard.
Morning Bernard, thanks for the pat on the back!
You have certainly nailed the most topical question out there which we did cover in the Weekend Report, but I will summarise again below:
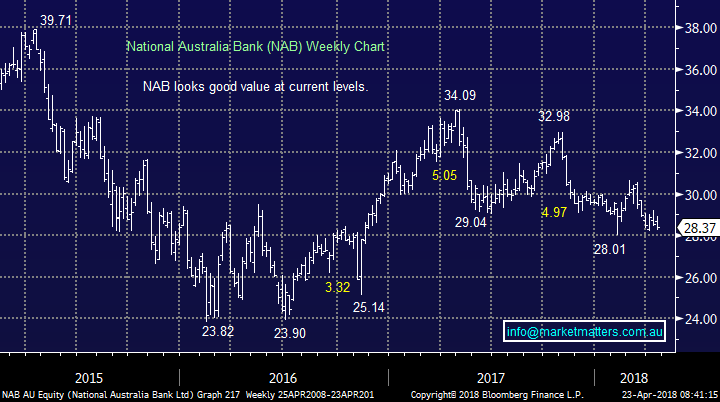
- We believe that the banks dividends are sustainable hence even in a rising interest rate environment, they are still tempting e.g. CBA ~6% and NAB ~7%, both attractively fully franked.
- Hence if investors can tiptoe around the banks picking up dividends over the next 1-2 years without actually losing capital, the returns will look solid.
- For example the yield for investors who buy NAB this morning will be almost 10% fully franked over the next 13-months!
- We believe the banks should be accumulated into weakness from current levels, BUT the market is certainly not yet agreeing.
- I can remember a conversation I had with my accountant at the time back in 2015 when he said shares are easy “just buy banks”...perhaps now NAB has corrected over 28% before dividends he’s correct, it certainly no longer feels easy / comfortable, but the best investments often don’t.
National Australia Bank (NAB) Chart
Overnight Market Matters Wrap
· A sell-off in US technology stocks led weakness across the major Wall Street indices last Friday, the tech heavy Nasdaq 100 being the weakest of the 3, falling 1.58%, while both the S&P 500 and the Dow were down over 0.80%.
· Apple was one of the biggest contributors to the tech sector weakness, as investors downgraded sales expectations to China. The stock fell 4% to US$165.7 capping its weakest period since the tech selloff in February.
· The recent hike in commodity prices, especially aluminium, alumina, nickel and oil raised further inflationary fears, leading to US10yr bonds rising to 2.96% for the first time since February.
· Base metal and oil prices consolidated recent gains on Friday night trading, with the price of Brent oil holding around US$74/bbl and copper at US$3.15/lb. Iron ore however eased, while gold also fell, despite the increasing inflation concerns. BHP is expected to outperform the broader market today, after ending its US session up an equivalent of 0.7% from Australia’s previous close.
· The June SPI Futures is indicating the ASX 200 to open 15 points lower this morning towards the 5850 level, however with a short week seen in commemoration of ANZAC day this Wednesday, we wouldn’t be surprised for a quiet and lower than usual volume trade for the week.
Have a great day!
James & the Market Matters Team
Disclosure
Market Matters may hold stocks mentioned in this report. Subscribers can view a full list of holdings on the website by clicking here. Positions are updated each Friday, or after the session when positions are traded.
Disclaimer
All figures contained from sources believed to be accurate. Market Matters does not make any representation of warranty as to the accuracy of the figures and disclaims any liability resulting from any inaccuracy. Prices as at 23/04/2018. 8.26AM
Reports and other documents published on this website and email (‘Reports’) are authored by Market Matters and the reports represent the views of Market Matters. The MarketMatters Report is based on technical analysis of companies, commodities and the market in general. Technical analysis focuses on interpreting charts and other data to determine what the market sentiment about a particular financial product is, or will be. Unlike fundamental analysis, it does not involve a detailed review of the company’s financial position.
The Reports contain general, as opposed to personal, advice. That means they are prepared for multiple distributions without consideration of your investment objectives, financial situation and needs (‘Personal Circumstances’). Accordingly, any advice given is not a recommendation that a particular course of action is suitable for you and the advice is therefore not to be acted on as investment advice. You must assess whether or not any advice is appropriate for your Personal Circumstances before making any investment decisions. You can either make this assessment yourself, or if you require a personal recommendation, you can seek the assistance of a financial advisor. Market Matters or its author(s) accepts no responsibility for any losses or damages resulting from decisions made from or because of information within this publication. Investing and trading in financial products are always risky, so you should do your own research before buying or selling a financial product.
The Reports are published by Market Matters in good faith based on the facts known to it at the time of their preparation and do not purport to contain all relevant information with respect to the financial products to which they relate. Although the Reports are based on information obtained from sources believed to be reliable, Market Matters does not make any representation or warranty that they are accurate, complete or up to date and Market Matters accepts no obligation to correct or update the information or opinions in the Reports.
If you rely on a Report, you do so at your own risk. Any projections are estimates only and may not be realised in the future. Except to the extent that liability under any law cannot be excluded, Market Matters disclaims liability for all loss or damage arising as a result of any opinion, advice, recommendation, representation or information expressly or impliedly published in or in relation to this report notwithstanding any error or omission including negligence.
To unsubscribe. Click Here