Subscribers questions (BLA, JHG, Z1P, APT)
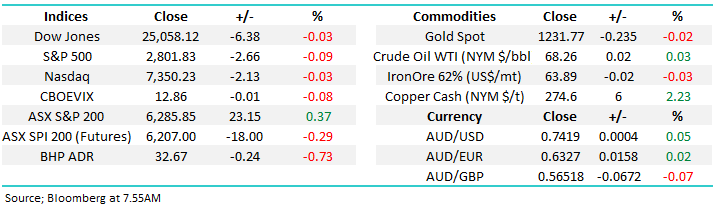
The ASX200 is set to open down over 20-points on Monday with no major leads from overseas except a 0.5c jump in the $A and BHP closing down ~20c in the US – we won’t be surprised if a few fund managers are considering lightening their exposure to the $US earners following Trumps attack on China and the EU, this time focusing on currency manipulation – we did on Friday by taking profit on our $US ETF.
The weekend provided no fresh insight as to the next turn in the US-China trade war although Donald Trump appears to be juggling so many controversial balls at present that I’m amazed how he ever manages to keep up – publically challenging the Fed’s independence to raise interest rates was certainly a first.
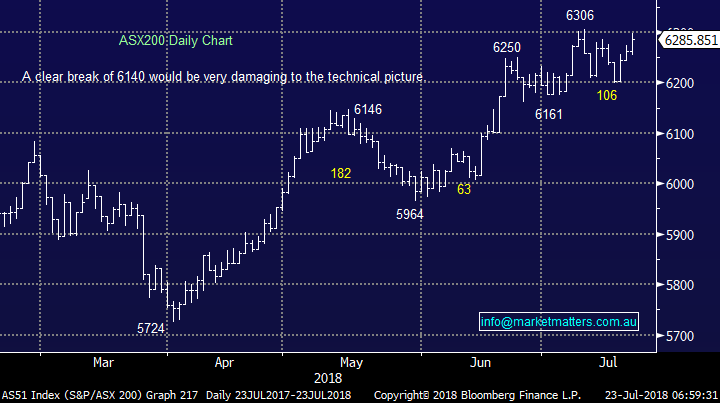
· We remain overall neutral the ASX 200 with a close below 6140 required to concern us, but importantly we remain in ‘patient sell mode’
Thanks again for some great questions this week as School Holidays come to an end.
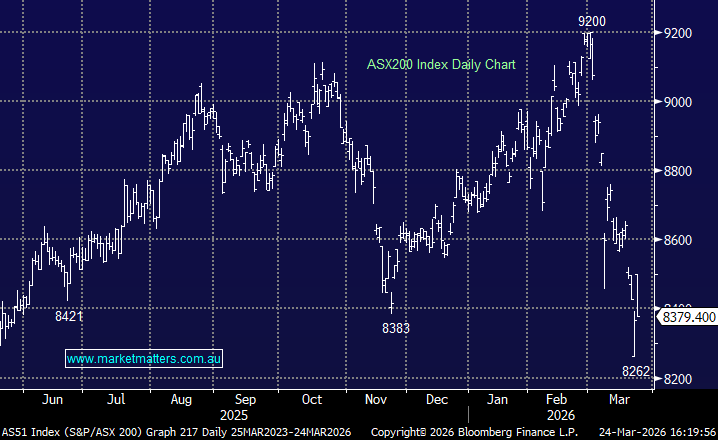
ASX200 Chart
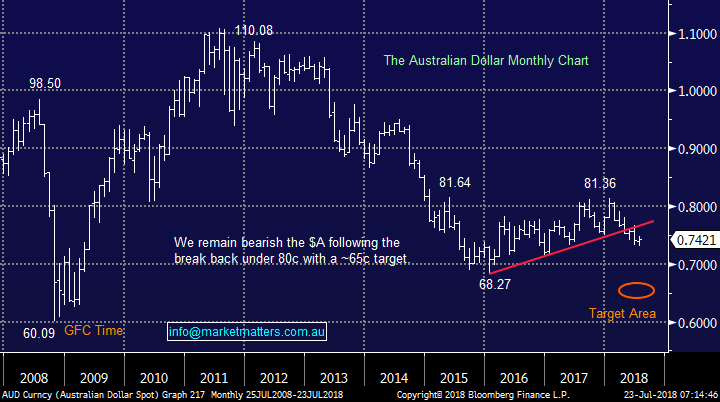
The currently in focus currency markets have started trading quietly this morning with $A trading slightly higher at 74.28 while I type, our “best guess” at this stage is we can see a bounce in the AUDUSD up towards the 76.50 region where we will be looking to re-establish our long $US ETF, this time with a bigger weighting.
Australian Dollar ($A) Chart
Question 1
“Hi There, over the last year MM has been talking about a +20% correction looming on the horizon but in the Weekend Report you stated:
- “Looking at the big picture missing a few % on the upside when we believe at least a 10% correction is a major risk sits comfortably with our investment team – it’s all boring risk / reward.”
Are you losing confidence in the larger fall happening? – Regards Jason H.
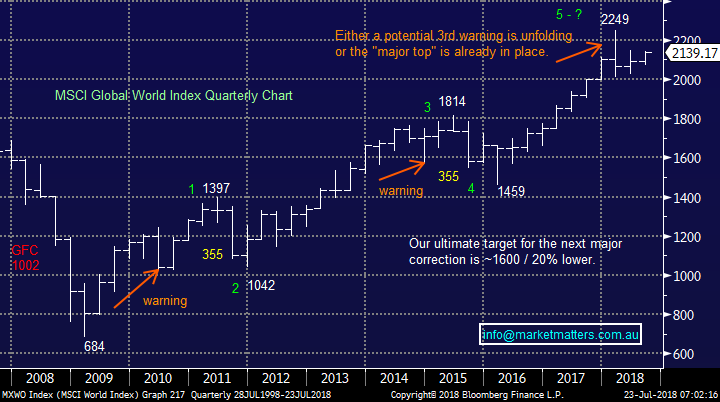
Hi Jason, the simple answer is no but as we regularly preach investors should always remain open-minded, especially as tops are generally the toughest periods in a market cycle to forecast. I have shown 3 relevant charts below to illustrate our current thinking:
- MSCI Global World Index – We remain 50-50 whether global stocks can make fresh all-time highs i.e. ~5% higher. However we are still looking for a more meaningful correction moving forward, if it is just another 355-points it will be over 16% but our feeling is its likely to be bigger.
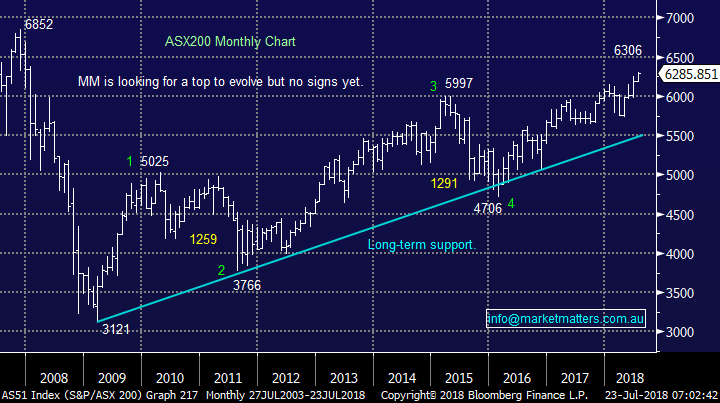
- ASX200 - Picking how much further the ASX200 can rally towards its all-time high of 6852 is pure guesswork but we do see a 20% pullback towards the 5000 area as a strong possibility over the next 1-2 years.
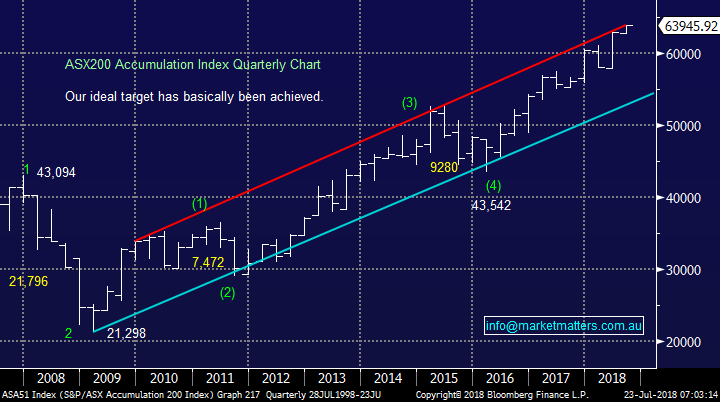
- ASX200 Accumulation Index – Currently the clearest technical picture to MM at present, ideally we will relatively soon see a correction back towards the lows of 2016, a pullback of well over 20%.
As we stated above its all about simple and often boring risk / reward, which simply means the proportion of forecasted upside relative to the proportion of forecasted downside. We are happy to miss a few % upside if we believe there exists a strong likelihood of a bigger correction.
MSCI Global World Index Chart
ASX200 Index Chart
ASX200 Accumulation Index Chart
Question 2
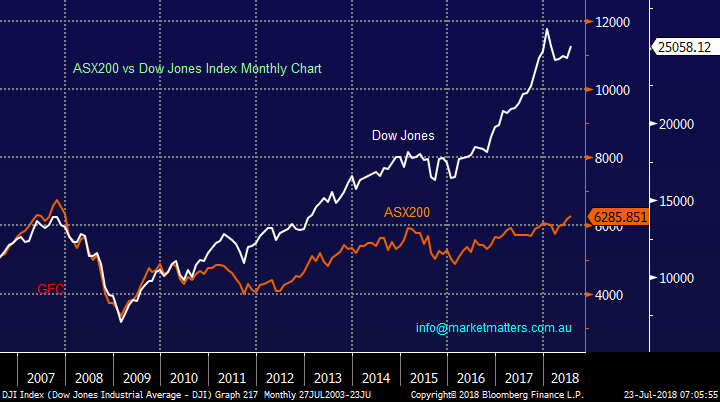
“Hi James and team, in relation to the potential for a US recession and the associated equity pull back would we expect that the Australian market would retract as aggressively as the US markets? The reason I ask is that the Dow has nearly doubled since its pre GFC peak in 2007 and looking at by comparison the ASX 200 it is yet to even get back to where it was pre GFC. It would appear that the US would have a long way to fall on a relative basis where our market comparing purely on price it only now getting back to parity after 12 years.” - Luke E.
Hi Luke, we believe the ASX200 will outperform US indices over the next few years for 2 main reasons:
- We believe the Australian banks which have been the main laggard within the ASX200 now represent good value, especially on a relative basis – even after the recent bounce CBA is still sitting over 21% below its highs of 2015 (not including dividends) and the Hayne royal commission is now largely behind us.
- If global equities correct as we expect it’s the indices / stocks that have run the hardest that are most likely to correct the hardest e.g. in January / February of this year then Dow fell -12.3% but the ASX200 only dipped -6.9%.
ASX200 v Dow Jones Chart
Question 3
“Hi Guys, by my reckoning the Growth Portfolio is made up of 18 individual positions in 10 stocks (excluding US cash and the short positions). At the moment A2M and SUN are in profit and the 16 positions are in a loss. 10 of the loss positions were bought prior to 2018.
As you anticipate a large market downturn in the short to medium term, what is your strategy regarding the current loss positions that make up the bulk of the portfolio.” - Regards Cameron A.
Hi Cameron, firstly I think that when you evaluate our Growth Portfolio its essential to take into consideration our “Recent Activities” which are available on the MM website here, it shows some excellent results that have been realised over the last few years, however looking at the last quarter for instance, we closed out 14 profitable positions and 2 non-profitable positions. Often with subscription services there is a tendency to bury unprofitable calls – we’re different, we show it all believing that transparency and accountability are very important (and often lacking) components of our industry.
Moving onto your specific question, our current holdings can be split up as below:
- Cash – 25%.
- Equities - 67%
- Negative facing ETF’s - 8%.
Hence if the market were to fall 20% this morning, similar to October 1987, while we would probably outperform 99% of funds on the market we would still not make money which is clearly our prime objective.
Our intention is to slowly continue reducing our equity exposure and / or increase our negative facing ETF positions to put us in a position to actually make $$ if / when the equity bull market ends / corrects.
Question 4
“Hi James, hope all is well.
As you may recall, I’m a keen follower of your Market Matters reports. I’ve actually been following you since my school days (currently 29 now) when you started reporting on The Finance News Network with Garry Glover - I’m clearly a fan of your market views and suggestions! Speaking of, do you have any comments in relation to the eSports and/or Artificial Intelligence sectors and whether either may present some good investment opportunities? They’re both going through some pretty new and evolving times and assuming this continues, surely there will be some big developments and/or organic growth in the coming years.
Appreciate these two industries might be relatively speculative in nature at the moment, but as you always say, the current investment landscape is about switching between industries/sectors at the right time. I feel like there is a lot happening with both eSports and AI, but acknowledge the latter has received a lot more “chat” therefore timing might not be as opportunistic...
Would really like your thoughts and also whether you consider there to be any stocks worth considering? Even better if there is an opportunity to include this in one of your daily reports.” - Cheers Henry W.
Hi Henry, this undoubtedly is an exciting growth area although unfortunately as is often the case more opportunities exist in the US than at home. Its estimated that the Artificial Intelligence (AI) business will grow from over $10bn last year to almost $60bn in 2021, but as we said the likelihood are the best returns from the sector will come from offshore.
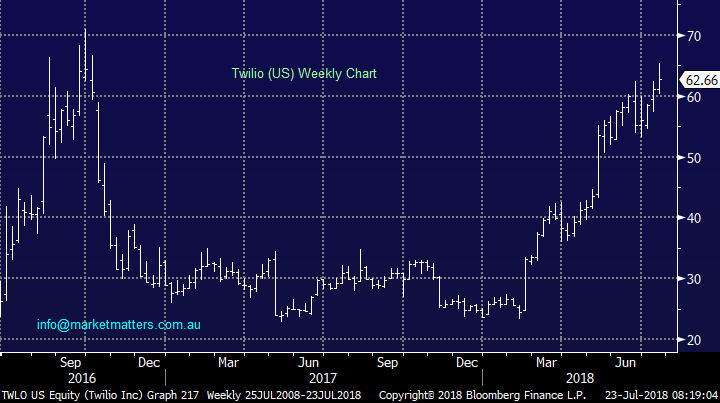
One stock that we have been watching is Twilio (TWLO) which we like into weakness under $US55 – TWLO focuses on its speech recognition platform and the company is enjoying a massive increase in its customer base, up over 30% year on year.
I agree that this is a growth area that needs further analysis, we may let Denis loose on the subject, our IT guru who nailed an excellent report on Bitcoin a few months ago.
Twilio US (TWLO) Chart
Question 5
“Dear James and MM Team, I am a newcomer to your service and finding your reports very instructive - keep up the good work. A question if I may: what are your thoughts on the efficacy of stoploss orders for income investors? As with all investors I want to protect capital first and foremost - but as an income investor my ability to 'pull out' into cash is constrained. I use an Average True Range (ATR) approach to setting stoploss orders. One would think that after Identifying and buying into a company with good earnings potential and a stable, realistic dividend that a stoploss level could be set without too much worry. This is not my experience. I have found that when using typical x2 or x2.5 ATR stoploss settings a shareholding can be sold out, only for me to see that share's price retrace back to its former level in the next few days/months. As a result, I oscillate between using stoploss orders and abandoning them in disgust. It seems to me stoploss orders are a logical attempt to safeguard shareholdings that can be subject to irrational behaviour. Does MM use stoploss orders on all income portfolio shareholdings? Is there a better way than ATR in your view?” - Regards Karl B.
Hi Karl, a great question which like so many within investing we believe is often best simplified.
Firstly, we believe a “stop” should be used when the reason for the investment / or trade has simply gone, whether it be technical, fundamental, or both. Once we establish that we longer want the position the question as you ask is how to exit.
Importantly MM rarely ventures into stocks with low average daily turnover, these stocks can take a potential 5% risk (stop) to 10% in the blink of an eye. However, we must all acknowledge that when a company announcement is made “gap risk” often exists but that’s the nature of investing and over time they should even themselves out - for the active investor we know that markets usually gap in the direction of the trend i.e. people are front running looming news – hence MM rarely buys a stock that’s falling fast until the move is accompanied by the reason / news for the decline and we can then assess if the stock remains attractive.
Moving back to the stop, a couple of observations after years of toying with the subject:
In my opinion, and this is derived from being involved in the markets daily, dealing in large lines of stock and options that require stock hedges, acting for and dealing with institutional trading desks, there are so many reasons why a stock can move, and a lot of time they are not related to the stock itself. That said, if an individual doesn’t have the capacity to monitor the market closely, then a stop can make sense. I used to run ATR stops over true mechanical portfolios in a different life. If using a stop I found that method to be one of the best given it takes into consideration volatility / ranges in each individual stocks rather than running an arbitrary % based stop.
Hence in conclusion we don’t use stops within the Income Portfolio however we have levels in mind where positions would be exited to conserve capital depending on what we know about the stock at the time.
Question 6
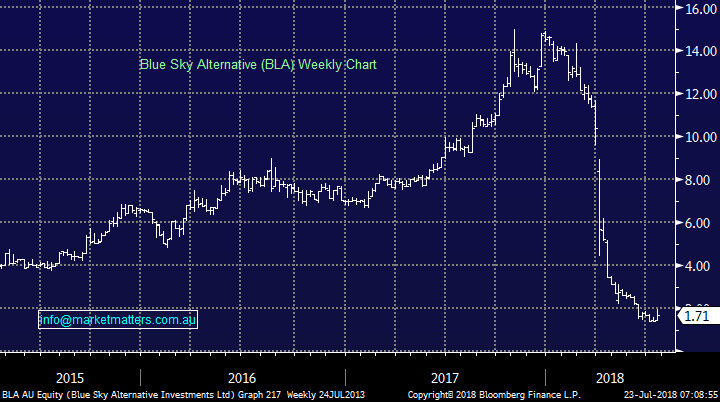
“Hi, Blue Sky (BLA.ax) up 21% today & no comment?” regards, Robert W,
Hi Robert, I think the result the day after your email with BLA falling over 12% on Friday says it all. We believe that BLA is an extremely aggressive play at best and overall not one for us but technically for the investor with extremely strong risk appetite we would consider a failed spike under $1.35 as a trading opportunity.
Blue Sky Alternative (BLA) Chart
Question 7
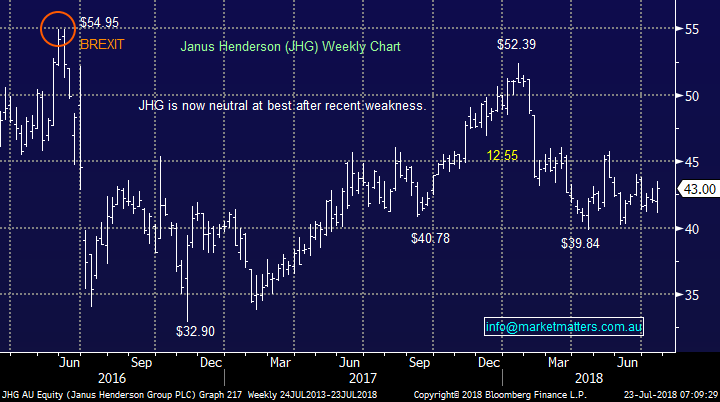
“JHG is very frustrating eh … brokers tip it to zoom (both Bell Potter and Morgan Stanley have targets + $60) but it seems stuck in a range $40 to $44. I do hear that the integration isn’t as smooth they say. Probs one to walk away from with a slight profit.” – Thanks Hugh F.
Hi Hugh, absolutely correct – we’ve been frustrated by it.
- We are considering exiting our JHG position if / when it rallies towards $45.
Janus Henderson (JHG) Chart
Question 8
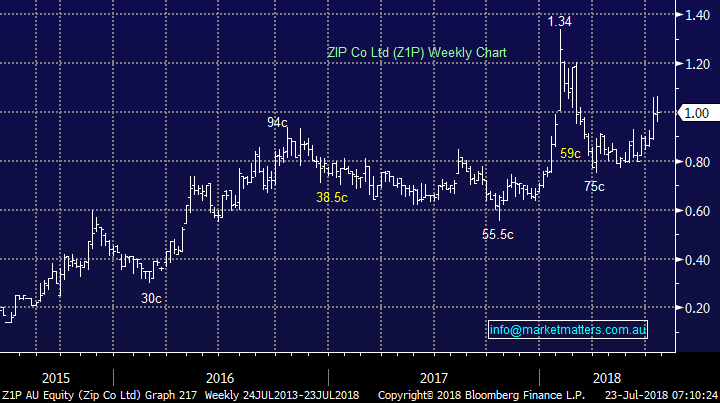
"Hi James, twice this year, in January and June, you highlighted Z1P as a possible buy. Fortunately, I acted in both times and in January purchased Z1P at 0.85 then sold at $1.24. In June I bought at 82c and the current trades are now above $1. Can I have your opinion on an exit price? A few weeks ago, you became somewhat negative on these types of stocks so I have my finger on the trigger but find often sell way too early and not let the good ones run enough.” – Thanks Charles S.
Morning Charles, I’m glad to hear of your success in Z1P, we always love to hear of winners.
Technically Z1P is a tough one just here although it looks ok while it remains above 90c but I’m afraid our neutral view just here is not much help.
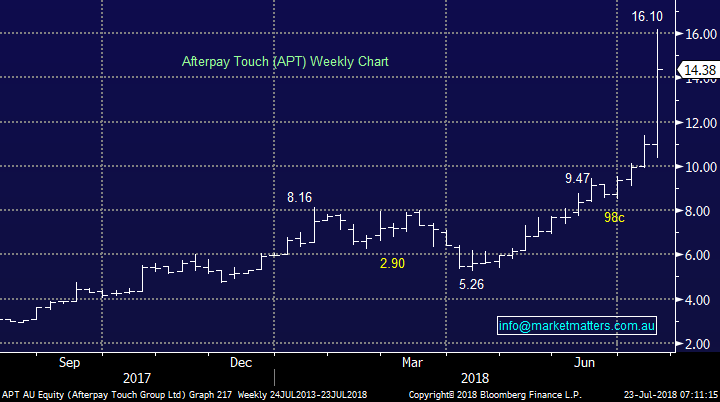
AfterPay (APT) has been an amazing journey and we should have listened to Vanessa in the office who told us “she would always use APT ahead of Z1P because its set up was simpler and required less steps” – hindsight is a wonderful thing however our concern in the space was that we felt regulatory risk may have been looming. That said APT looks like a blow off top caused by a vortex of short covering and one very bullish broker call.
ZIP Co Ltd (Z1P) Chart
AfterPay Touch (APT) Chart
Overnight Market Matters Wrap
· The US closed with little change at all, with the majors ending their sessions marginally lower.
· President Trump’s comments on monetary policy have spooked bond and currency markets as he calls into question the independence of the central bank. His threats to put tariffs on more Chinese and European exports to America have prompted more push back from G-20 leaders.
· US reporting season is underway with over 80% of companies beating consensus estimates so far. Strong economic data coupled with an upbeat reporting season has left analysts feeling cautiously optimistic.
· The September SPI Futures is indicating the ASX 200 to open 9 points lower testing the 6275 support level this morning.
Have a great day!
James & the Market Matters Team
Disclosure
Market Matters may hold stocks mentioned in this report. Subscribers can view a full list of holdings on the website by clicking here. Positions are updated each Friday, or after the session when positions are traded.
Disclaimer
All figures contained from sources believed to be accurate. Market Matters does not make any representation of warranty as to the accuracy of the figures and disclaims any liability resulting from any inaccuracy. Prices as at 23/07/2018
Reports and other documents published on this website and email (‘Reports’) are authored by Market Matters and the reports represent the views of Market Matters. The MarketMatters Report is based on technical analysis of companies, commodities and the market in general. Technical analysis focuses on interpreting charts and other data to determine what the market sentiment about a particular financial product is, or will be. Unlike fundamental analysis, it does not involve a detailed review of the company’s financial position.
The Reports contain general, as opposed to personal, advice. That means they are prepared for multiple distributions without consideration of your investment objectives, financial situation and needs (‘Personal Circumstances’). Accordingly, any advice given is not a recommendation that a particular course of action is suitable for you and the advice is therefore not to be acted on as investment advice. You must assess whether or not any advice is appropriate for your Personal Circumstances before making any investment decisions. You can either make this assessment yourself, or if you require a personal recommendation, you can seek the assistance of a financial advisor. Market Matters or its author(s) accepts no responsibility for any losses or damages resulting from decisions made from or because of information within this publication. Investing and trading in financial products are always risky, so you should do your own research before buying or selling a financial product.
The Reports are published by Market Matters in good faith based on the facts known to it at the time of their preparation and do not purport to contain all relevant information with respect to the financial products to which they relate. Although the Reports are based on information obtained from sources believed to be reliable, Market Matters does not make any representation or warranty that they are accurate, complete or up to date and Market Matters accepts no obligation to correct or update the information or opinions in the Reports. Market Matters may publish content sourced from external content providers.
If you rely on a Report, you do so at your own risk. Past performance is not an indication of future performance. Any projections are estimates only and may not be realised in the future. Except to the extent that liability under any law cannot be excluded, Market Matters disclaims liability for all loss or damage arising as a result of any opinion, advice, recommendation, representation or information expressly or impliedly published in or in relation to this report notwithstanding any error or omission including negligence.
To unsubscribe. Click Here