Subscribers questions (BHP, NCM, NVT, GXL)
What a difference a week makes, last week we were looking on the bearish side calling for a break towards 5950, almost 4% lower but by Friday morning the market was threatening to break under 5800 – as the SPI futures are indicating it may attempt again this morning. Our view at the moment is this current market decline has another 2-3 weeks worth of choppy action to unfold. On a purely technical observation a test of 5700 by the ASX200 is a realistic target i.e. around 3.5% lower whereas the US has a technical target 5% lower, in both cases their 2018 lows. How both the US and Australia trade at current levels will clearly be key.
Over the weekend we received a lot of rhetoric around the escalating US – China trade war, especially from the IMF’s meeting in Bali, with the message undertone being be prepared for a protracted stand-off. As mentioned in the Weekend Report the SPI futures are calling the ASX200 to open down around 70-points today, as we suggested Friday, this again feels overdone on the downside especially with our neighbours in New Zealand trading up over 1%.
Thanks again for some more great questions, especially as volatility has risen sharply, the easy option is to simply head for the hills.
ASX200 Chart

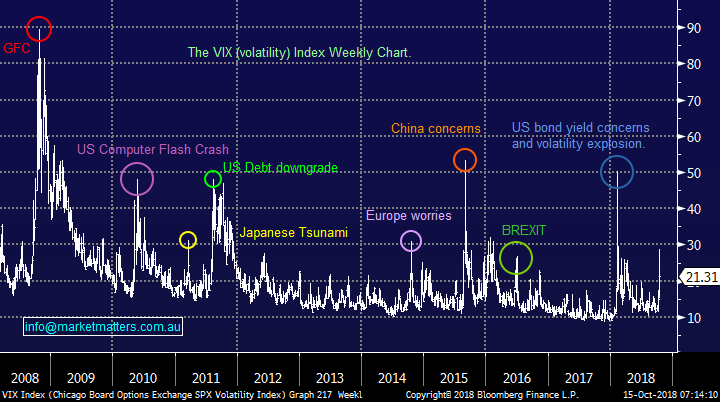
Last week’s plunge by equities can be put into perspective by looking at the VIX, so far, it’s up there with BREXIT in 2016, Greece in 2014 and the Fukushima nuclear disaster in 2011.
The US Volatility VIX) / Fear Index Chart
Question 1
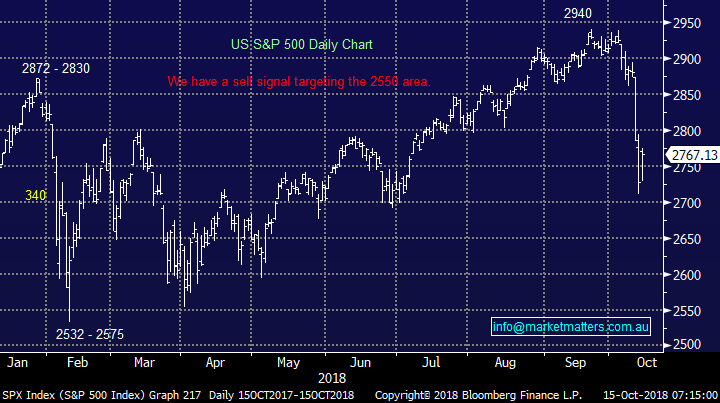
“I read in your week end report that you believe Technical Analysis is paramount now. Which graph of the S&P do you attach the greatest importance to; The weekly showing 2676 well above the 100 and 200 and just below the 50 or the daily showing below all of them?
Secondly, you wrote recently that there is little credit risks present as high yield spreads are making new cycle lows versus Treasuries. Can you please explain this? I do enjoy your MM reports and your commentary I find very informative.” - Bruce B.
Hi Bruce,
Firstly, we are not actually looking at moving averages as opposed to the Distribution Theory / Steidlmeyer Distribution – often in its simplistic form referred to as Market Profile.
This method can occasionally generate our favourite technical signal i.e. a false breakout. The psychology behind the signal can easily be understood as traders / investors who have bought the euphoric optimism, in this case the US S&P500 breaking out to fresh all-time highs, are wrong and left scrambling for the exit door.
Our interpretation of the current market for US stocks is there is a high chance the S&P500 will test the bottom of its previous trading range i.e. 2523 – 2575, well over 5% lower if it fails to hold current levels.
US S&P500 Chart
Two of our best and most “out there” calls by MM since our inception have been generated by this very same signal.
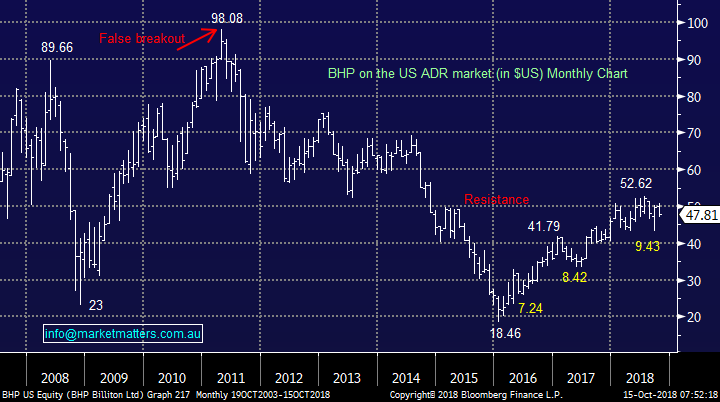
1 BHP Billiton (BHP) – when BHP failed around $US98 on the US ADR market we called BHP to correct back towards $US30, ie fall by ~70% which it did BUT unfortunately I reckon we lost some subscribers at the time because everyone was bullish / loved BHP.
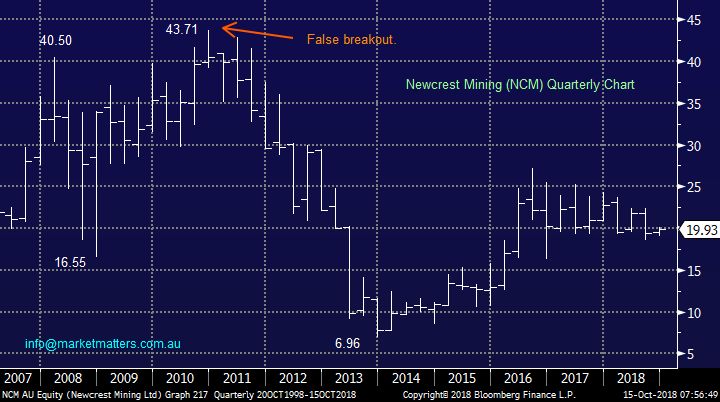
2 Newcrest Mining (NCM) – Similarly when NCM failed above $43 we called it to more than halve, another unpopular but accurate call.
Importantly both of these technical patterns stopped MM losing money by the falls in resources in the following years after 2011 – we simply avoided both.
BHP Billiton (BHP) Chart
Newcrest Mining (NCM) Chart
Secondly, explaining “there is little credit risks present as high yield spreads are making new cycle lows versus Treasuries”.
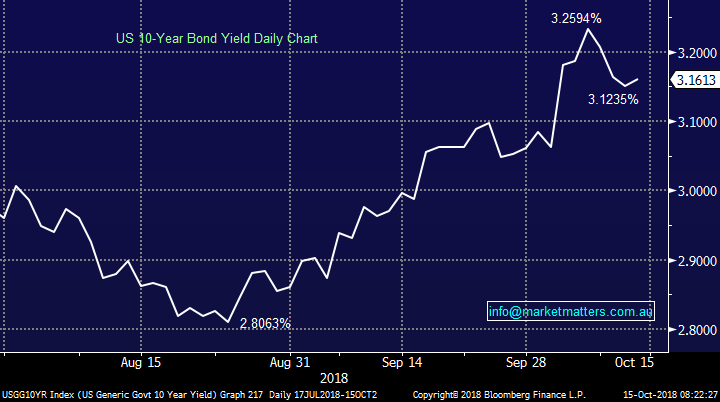
As some background, the world looks towards the US 10 year bond yield as a measure for the cost of money, or the ‘risk free rate’. Last week, US bonds were bought into the volatility which pushed down yields.
US 10 year bond yields chart
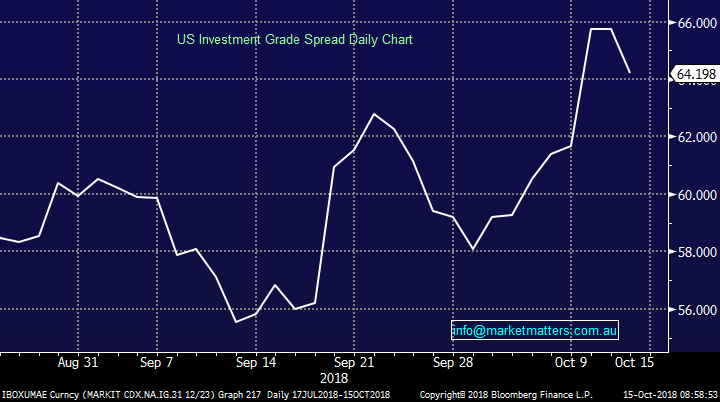
We made mention early in the week that credit spreads had not ‘blown out’ which they haven’t. While they are not at cycle lows as shown below, a move of 4bps on the week to 66bps is not alarming. This chart measures the ‘risk premium’ being demanded by the market to hold investment grade credit over and above Government bonds.
US Investment Grade Spread Chart
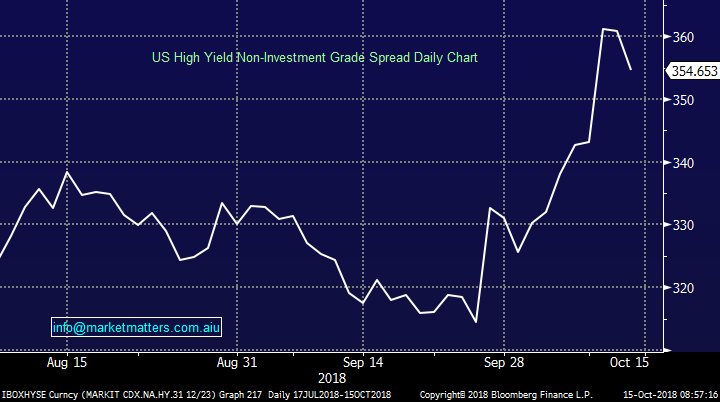
And the next one shows non-Investment grade credit spreads, or the risker debt which now sits at 3.54% over and above bonds. Spreads are up but not by an alarming amount.
US high yield non-investment grade credit spread chart
While companies can still borrow relatively cheaply there is no pressure on the repayment costs of business. However in the bigger picture there is one thing to keep in the back of our minds:
“A bottom in spreads tends to foreshadow recessions. A low of 2.41 percentage points was recorded on July 1 2007, five months before the start of the subprime mortgage market crisis. The spread spiked during the recession that followed the meltdown of late 2008.” Hence we will be watching credit spreads closely for signs this is not just an equity / growth led sell off.
Question 2
“Hi there, I have missed out these recommendations last few days and reading the morning email today I noticed the market is falling more so my question is should I buy now or wait for further advice from Market Matters” -Thanks and regards Tony
Hi Tony, you’ll need to be the judge of whether or not to buy however here’s our current take on our recent actions now the market has tumbled;
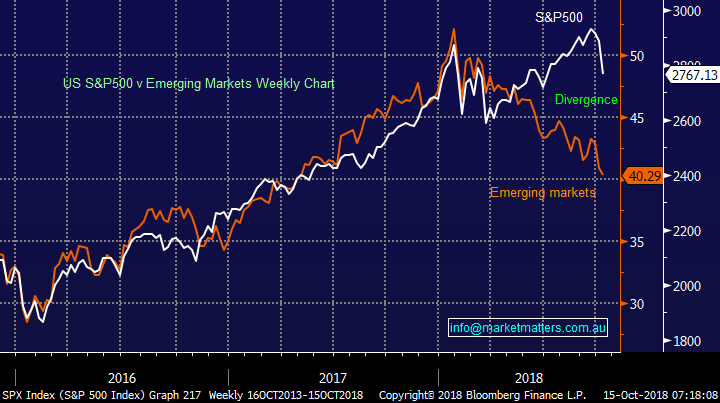
1 – We remain keen on our “buy emerging markets (ETF – IEM) and sell US stocks (ETF – BBUS).
2 – We continue to like CSL and COH below $190 and have ammunition to average into fresh monthly lows.
3 – Westpac (WBC) we still like WBC below $26.50
4 – Janus Henderson (JHG) – We have this on a close leash, if it fails to hold current levels we will cut it
5 – RIO we like RIO around $77.
6 - We still like CIMIC (CIM)
US S&P500 v Emerging Markets Chart
Question 3
“Hi James, I am curious what the technical sell signal is/was for the SP500 and how you determine a target price? “– Regards Sean C.
Hi Sean,
I have touched on this in question 1 but its simply back to the lower 1/8 (12%) of the previous trading range which
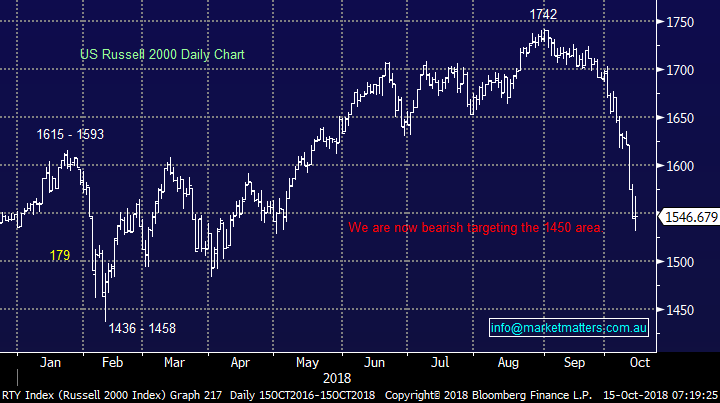
In the case of the US Russell 2000, small cap index, the markets broken back into the 1436 – 1615 trading range which was in place for around 3-months, identifying our initial target as the bottom 1/8 of the range, in this case 1436 – 1458.
For the Russell 2000 its another 6% lower, less than the S&P500 which makes sense as the small cap index led the US markets lower hence it should bottom first.
Obviously how & if the market satisfies this view will determine what our view becomes moving forward.
US Russell 2000 Chart
Question 4
“Hi James, is there any chance that the outcome of this mid-term election might be able reduce the amount of share market disruption by the USA President Trump? Are there any current predictions regarding this?”- Kind Regards, Phil B.
Hi Phil,
There’s certainly plenty of speculation around President Trump and the US mid-terms and were currently seeing it one of 2 ways:
1 – The President attempts to resolve the US – China trade issues before November 6th and look a “hero”.
2 – The President stands strong into November 6th and portrays himself as the strong leader the US needs to the voters i.e. “America First”.
We think path number 2 is the most likely with the ultimate result for Trump a combination of 1 & 2 – a resolution in a few weeks, so he looks strong and victorious to the general American public just before the November vote.
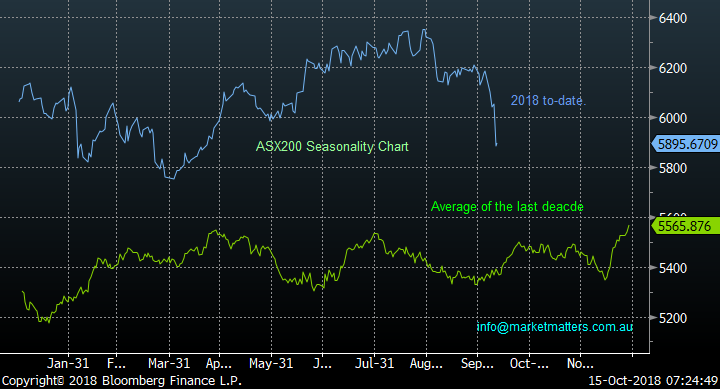
Overall our preference is the market forms a decent low in the next few weeks which does indeed coincide with the US mid-term elections.
ASX200 Seasonality Chart
Question 5
“Hi James, a question for Monday perhaps. Although I sold all my NVT today into strength for a good profit, so this question is somewhat academic at least for me, I was a little disappointed that your PM Report today didn’t comment on what action holders of NVT might preferably take. Perhaps it’s too early to speculate of the full terms of the proposed deal? Keep up the good work!” - Regards, Gil.
Hi Gil,
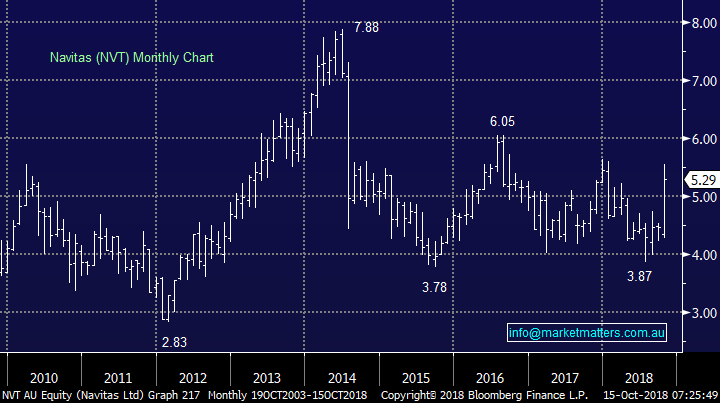
Navitas (NVT) shares soared on takeover news just when global equity markets were melting, that’s Christmas for an investor.
This is another takeover attempt by BGH Capital and Australian Super into the local Health & Education sectors, the last one with Healthscope (HSO) failed and the shares are now over 20% below their high following the attempt.
If we had have been long NVT last week we would have taken the money and reinvested into the collapsing market.
Navitas (NVT) Chart
Question 6
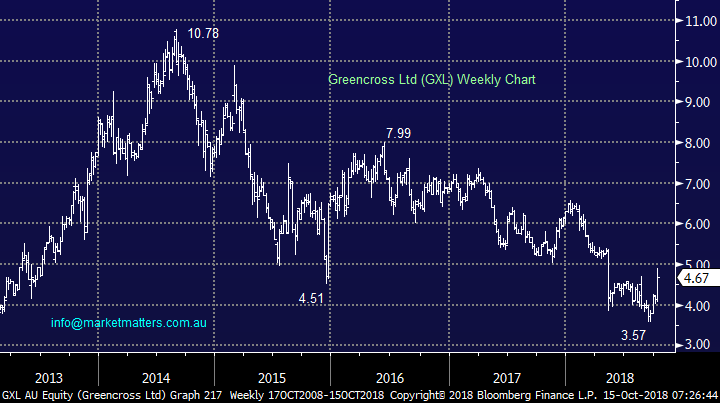
“Hi, GXL was also up 17.8% on news that they have a number of potential bidders. Any idea on who they are and potential offers?” – David H.
Hi David,
Private Equity is looking at GXL with both BGH and TPG named is a Street Talk article – BGH are already busy with NVT so perhaps TPG is favourite.
TPG and Carlyle Group had previously unsuccessfully bid over $6 for the stock which has subsequently spent much of 2018 below $4 making it the most likely suitor to MM.
Shareholders of GXL have endured an awful few years with the stock correcting over 60% from its 2014 high so perhaps they will finally receive some good news.
The key takeout to us is Private Equity will remain active on the takeover path, especially if we do see a prolonged correction in stocks.
Greencross Ltd (GXL) Chart
Question 7
“Hi Guys, is there anything to be concerned about with AXLHA? It seems to have been in suspended trade for several weeks now?” - Thanks, Rob.
Hi Rob,
We were looking to cover in the Income Report this week however we’ll address now and update that view on Wednesday if anything changes, which seems unlikely.
AXL and AXLHA are both in voluntary suspension until the board completes a business review or until the 22nd of October 2018, whatever comes first. The issue stems originally from a change in the way they accounted for arrears (repayments that are late) and by doing so they inadvertently triggered a breach of financial covenants with senior bank lenders. From my understanding, they changed the way they classified arrears versus bad debts. That meant that arrears ticked up a lot, about 6 fold to be 4% of total loans, which is a big jump but from very low levels, and is still within industry norms.
However, by extending the time they were categorised as arrears rather than expensing them as bad debts it makes profits look better, and it seems that’s why it may have been done – but I’m only speculating. At this stage, the main point is they did it without consulting senior lenders which is stupid given the entire AXL business relies on the availability of credit, and the availability of credit to a large degree revolves around confidence in the business, management, reporting, structures etc. From what I understand, the AXL business is still operating as usual and writing loans, they paid the interest on the bonds but not the dividend they had declared on the stock. There was also another senior bond in the market from some time ago and it appears from what I understand they are redeeming a portion of that, which is a positive sign. Other than that, we await the outcome of the review and more than likely, we would imagine a deeply discounted capital raising - which would not be good for AXL shareholders but a positive for AXLHA Bond holders.
Overnight Market Matters Wrap
· The US major equities gained last Friday, having a breather from trading in the red sea with the tech. heavy Nasdaq 100 outperforming against the majors.
· Investors were keen to allocate funds into higher growth stocks as they perceive the current situation as an oversold market ahead of the third quarter earnings season.
· BHP is expected to underperform the broader market, after ending its session down an equivalent of -0.66% from Australia’s previous close.
· The December SPI Futures is indicating the ASX 200 to open 77 point lower, testing the 5820 level this morning, quite opposite of where the US traded last Friday!
Have a great day!
James & the Market Matters Team
Disclosure
Market Matters may hold stocks mentioned in this report. Subscribers can view a full list of holdings on the website by clicking here. Positions are updated each Friday, or after the session when positions are traded.
Disclaimer
All figures contained from sources believed to be accurate. Market Matters does not make any representation of warranty as to the accuracy of the figures and disclaims any liability resulting from any inaccuracy. Prices as at 15/10/2018
Reports and other documents published on this website and email (‘Reports’) are authored by Market Matters and the reports represent the views of Market Matters. The MarketMatters Report is based on technical analysis of companies, commodities and the market in general. Technical analysis focuses on interpreting charts and other data to determine what the market sentiment about a particular financial product is, or will be. Unlike fundamental analysis, it does not involve a detailed review of the company’s financial position.
The Reports contain general, as opposed to personal, advice. That means they are prepared for multiple distributions without consideration of your investment objectives, financial situation and needs (‘Personal Circumstances’). Accordingly, any advice given is not a recommendation that a particular course of action is suitable for you and the advice is therefore not to be acted on as investment advice. You must assess whether or not any advice is appropriate for your Personal Circumstances before making any investment decisions. You can either make this assessment yourself, or if you require a personal recommendation, you can seek the assistance of a financial advisor. Market Matters or its author(s) accepts no responsibility for any losses or damages resulting from decisions made from or because of information within this publication. Investing and trading in financial products are always risky, so you should do your own research before buying or selling a financial product.
The Reports are published by Market Matters in good faith based on the facts known to it at the time of their preparation and do not purport to contain all relevant information with respect to the financial products to which they relate. Although the Reports are based on information obtained from sources believed to be reliable, Market Matters does not make any representation or warranty that they are accurate, complete or up to date and Market Matters accepts no obligation to correct or update the information or opinions in the Reports. Market Matters may publish content sourced from external content providers.
If you rely on a Report, you do so at your own risk. Past performance is not an indication of future performance. Any projections are estimates only and may not be realised in the future. Except to the extent that liability under any law cannot be excluded, Market Matters disclaims liability for all loss or damage arising as a result of any opinion, advice, recommendation, representation or information expressly or impliedly published in or in relation to this report notwithstanding any error or omission including negligence.


