Subscribers questions (BEN, BOQ, CGF, SIQ, NABHA, MBLHB, EXL, WHC, AGL, 5GN, A2M, SM1, OVH, WEB)
The current market rhythm has seen reporting season take over from the coronavirus as the major driving force for local equities, a baton change which was epitomized by the banks last week as Commonwealth Bank (CBA) and National Australia Bank (NAB) delivered solid results into a sceptical market sending them up +7.7% and 5.5% respectively for the week. Over the next 5-days will see the likes of Bendigo Bank (BEN), BHP Group (BHP), Cochlear (COH), Fortescue (FMG), Sydney Airport (SYD) and Boral (BLD), to name but a few, unveil their sins suggesting company news flow will again dominate the ASX unless we see some surprise “left field” news.
Last night we saw the coronavirus death toll approach 1700 and the number of people infected globally nudge 70,000, this outbreak is not going away but at this time the statistics appear to be coming in as anticipated, I wonder what numbers will scare investors as they did at the end of January when the Dow plunged over 600-points. The worse the outbreak news becomes the more China rattles its sabre around economic stimulus, we may see the world’s second largest economy slow down badly in 2020 but it won’t be without a significant fight from the PBOC. For me seeing 2 Japanese tourists catch the coronavirus while on holiday in Hawaii sounds like a pandemic in its early stages.
Locally we continue to see a strengthening domestic housing market with Sydney’s clearance rate back to 2017 levels, sellers are returning to the market with listings rising strongly but the buyers are hoovering up the fresh stock as it hits the market. Investors haven’t particularly returned to property yet but when they do it looks like real estate will follow stocks to fresh all-time highs. High confidence continues to roll through asset prices, we believe it has further to unfold although the trodden path will become more volatile.
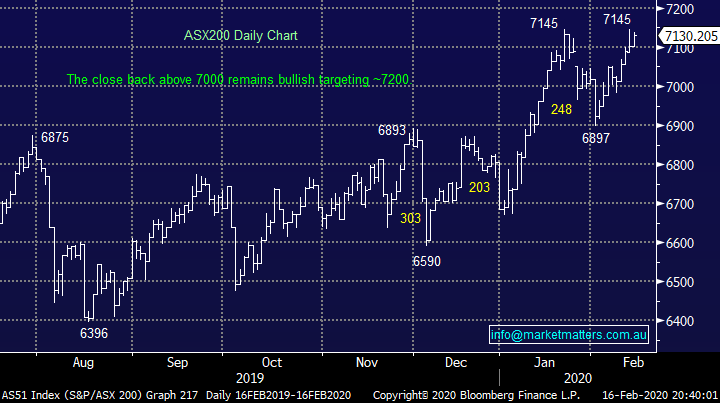
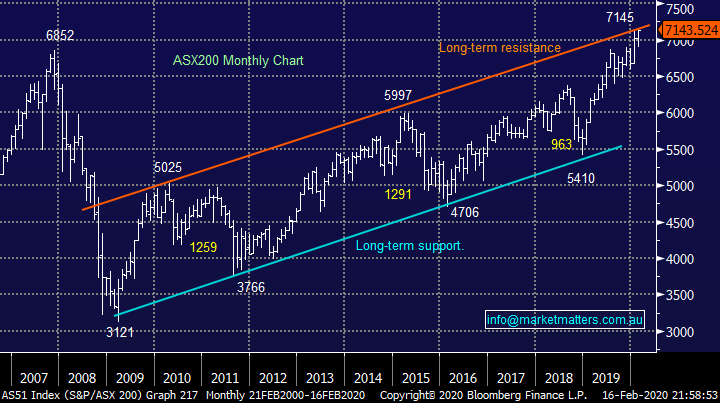
Ideally MM is looking to reduce our market exposure around the 7200 area for the ASX200.
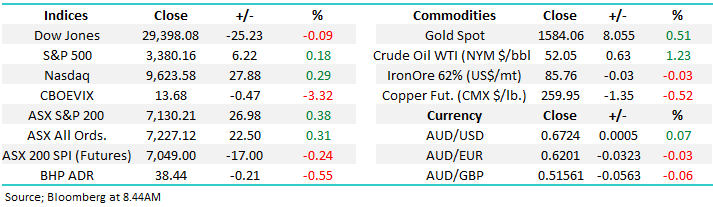
On Friday night US stocks closed mixed with the tech-based NASDAQ rallying +0.3% while the Dow fell -0.1%, the SPI futures are calling a quiet but marginally weaker open this morning.
Thanks again for the questions today with the coronavirus understandably continuing to be a common topic, our call for a volatile and interesting stock market in 2020 certainly remains on track.
ASX200 Index Chart
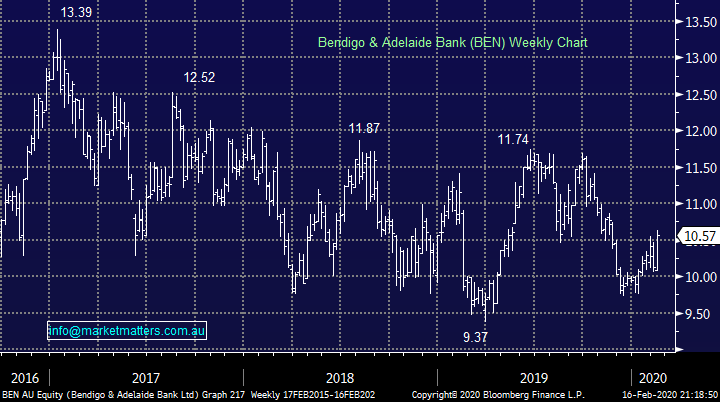
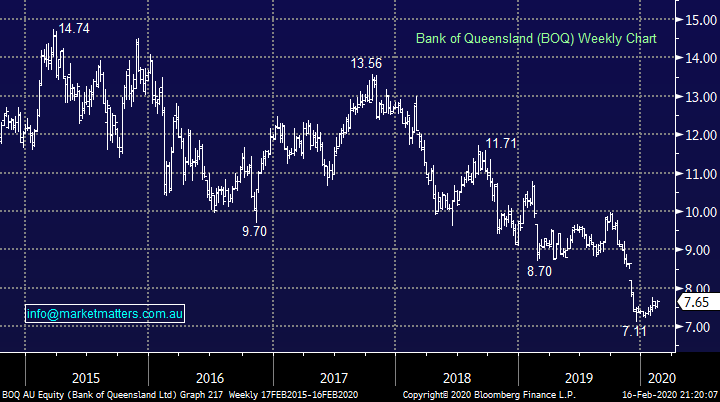
By the time many subscribers read this report Bendigo Bank (BEN) will already have reported with many analysts anticipating a capital raising with $300m the touted figure. The regional banks have endured a poor 12-months compared to their peers with BOQ the standout loser falling -23% while CBA rallied +28.5%, is this another elastic band that has stretched too far?
Both regionals are friendless amongst the analysts, similar to the old CYB (VUK) was before it doubled. Significant investment is required on the digital services front from both but a merger somewhere in the sector in our opinion could unlock some huge shareholder value.
MM is again considering BOQ & BEN, especially after selling CBA last week.
We will be reading today’s report from BEN with great interest.
Bendigo & Adelaide Bank (BEN) Chart
Bank of Queensland (BOQ) Chart
Question 1
“I just read an article that a US hedge fund manager cover his client with “explosive downside protection “. Basically, low cost portfolio insurance These are for high net worth clients - is anything like this available in Australia for the average investor - I’m aware of Bear etc but these have downside risks also” – Mike C.
Hi Mike,
Unfortunately, there’s no such thing as a free lunch and I would imagine this fund manager is simply buying “out of the money” put option protection. This strategy is available for local investors, but it slowly erodes away returns of a portfolio over a long period of time. Similar to any insurance policy there are pockets of time when we the holder is glad; they’re covered but by definition it has to be a deck stacked in the favour of the issuer otherwise they wouldn’t play the game.
If we look at the chart below of the ASX200 a portfolio may well have enjoyed insurance in the GFC, 2010 and 2015 but to have added value / alpha to a portfolio the fund manager would have needed to lock in some profit from the insurance just when everything looked bad otherwise it would have been slowly lost.
ASX200 Index Chart
Question 2
“Hi James, I have ridden CGF down from your initial recommendation and today it has spiked to break even. Do you see further upside, or should I sell now? Thankyou in advance.” – Regards Jeff F.
Morning Jeff,
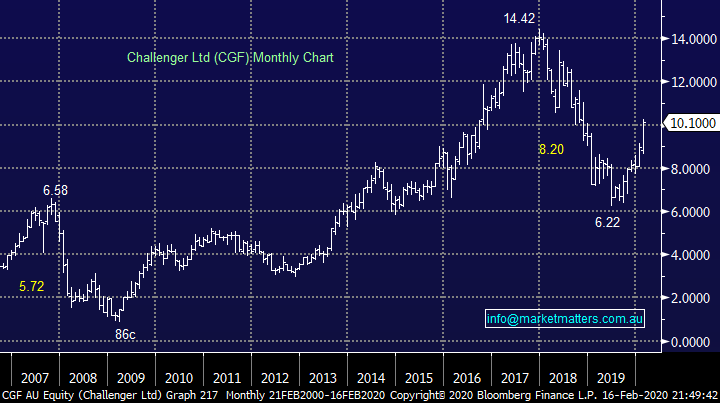
At MM we only provide General Advice hence I will discuss how we see Challenger (CGF) today although in this case, fortune does appear to have favoured the brave.
Last week CGF rallied a very healthy 13% following its FY half-year result which showed a 10% increase in funds under management (FUM) and a knock on 3% increase in profit, expectations were low and the market simply hates this stock as I have suggested a few times last week, the short position in CGF is now around 5%, down from above 8% at the end of 2019.
Operationally, CGF have struggled with low interest rates as they promise a fixed rate of return to customers but if we are correct and bond yields are set to increase slightly this year it should help diminish this headwind. As our population continues to age CGF’s products should enjoy a larger market and while assert prices remain firm things look relatively rosy.
Our analyst at Shaw is very negative this stock, in fact all analysts are. This leads me to think that the market is definitely underweight CGF and hence the aggressive buying following an okay result - amplified further by short sellers buying back stock to cover.
Around $10 I would call CGF a hold in old fashioned broker language.
Challenger (CGF) Chart
Question 3
“Hi James, what entry price do you like for SIQ?” - Cheers Tim R.
“Hi James and the MM Team, A question for Monday if I may. I bought into SIQ early last week (for income purposes in our SMSF) after initially having my attention drawn to the stock by you guys, - have been watching how it has been travelling for some time now. I realise it is a bit of a punt buying in before next week’s results report but decided to go ahead after looking at how the stock has gone; in particular how stable their dividend has been over time. We have had a little bounce in the last few days - might be people like me chancing their arm a bit - or do you think we are seeing SIQ bottoming after their share price recent falls that started in Sept 19? All the best, keep up the good work” – Karl B.
Morning Guys,
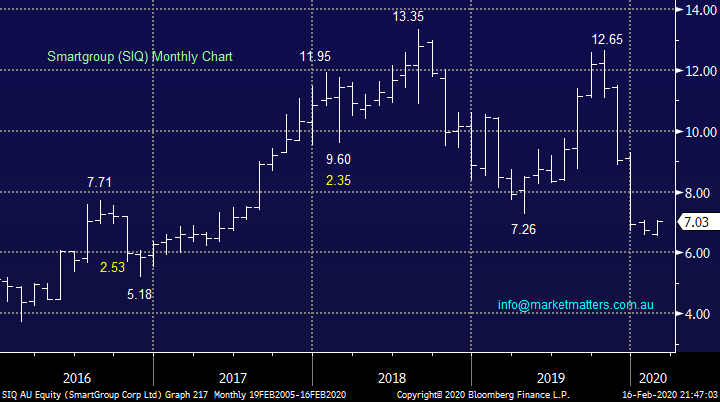
Salary packaging business Smartgroup (SIQ) has clearly endured a tough 6-months but with a forecasted 6.3% fully franked yield it’s easy to see why investors, like ourselves, are sniffing around this stock. This 20-year old company has a strong industry position, no debt and looks reasonable value around $7 but obviously risks are high until its next profit update which is this coming Wednesday (19th Feb), the October set of numbers almost halved the stock.
MM likes SIQ around $7 as an aggressive yield play, buying half pre-results and half post results.
Smartgroup (SIQ) Chart
Question 4
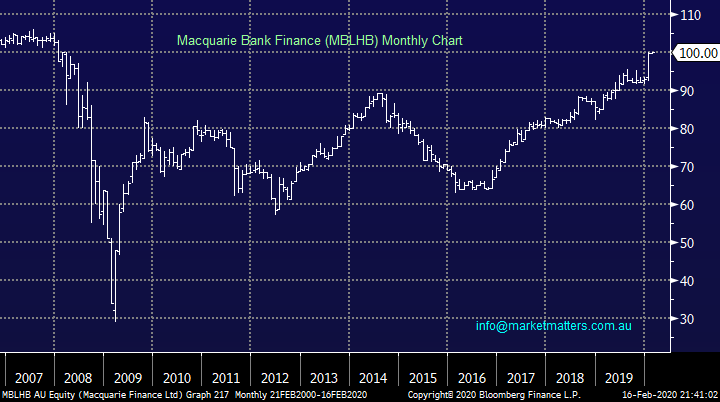
“Hi I just read the Q&A re NABHA – I think the reason that it has shot up in price recently is because MQG has given notice that it is redeeming MBLHB which is quite similar to NABHA in structure return etc, so investors are piling in now in the hope/expectation that NAB will do similarly shortly.
From a risk/reward standpoint now is the time to move on from NABHA for better fixed income returns elsewhere in my view. PS I run an Aust income based portfolio for my sister who is a permanent resident of Japan, so doesn’t get franking credits, but doesn’t pay CGT so while both of the above have been modest returners but with 30-40% capital gain I can now feel a bit better about the investment decision!!!” – Craig B.
Morning Craig,
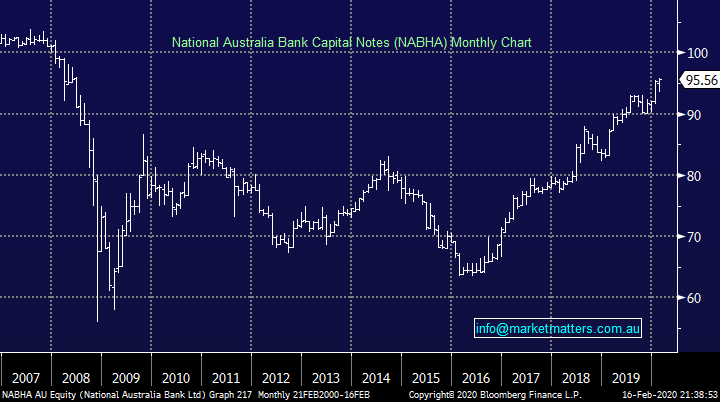
A very valid theory, they are both structured in the same way, both losing tier 1 status progressively over time. While it was always a theory that NAB would redeem this, the fact MQG have actually pressed the button on doing it adds to the strength of that call. The return profile on the NABHA will now very much depend on when they do redeem them, if its soon, the return looks good from current prices, if they leave them out there for a few more years, then it’s not as good.
I suspect they’ll redeem them sooner rather than later.
NAB Perpetual Notes (NABHA) Chart
Macquarie Bank Finance (MBLHB) Chart
Question 5
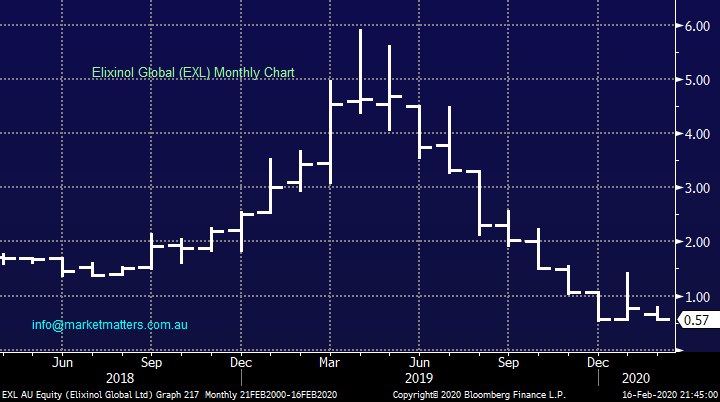
“Hi James, it appears that with Marijuana being legalised in North American the Marijuana producing companies are growing rapidly. James Altucher was talking about a company in Ohio building a greenhouse capable of producing 220,000 pound of grass pa and has 17 other sources of supply in various countries. For your international portfolio, would you consider Marijuana producing companies like this?” – Greg C.
Hi Greg,
Over recent years I have witnessed a significant amount of wealth destroyed by investors chasing the marijuana dream, you had to get on board way before the masses not to risk significant loss – EXL was the largest Australian player but its shares have collapsed by over 90%.
MM still has no interest in the marijuana sector.
Elixinol (EXL) Chart
Question 6
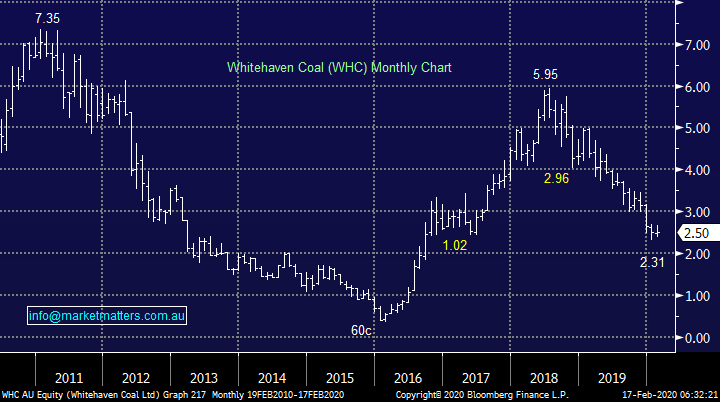
“Hi James Whitehaven, seems to be forming a base around the current SP. On a technical front do you think it looks like ready to move up?” - Cheers Tim R.
Hi Tim,
Whitehaven (WHC) has been in the naughty corner over the last 18-months but with fund managers moving aggressively to a cleaner investment footprint historical valuation are likely to be just that for the coal stocks. We feel coal companies’ relative valuations will continue to get cheaper over time hence to make money being long is likely to require a decent kick back up in coal prices.
WHC is yielding healthily for holders but capital losses have hurt of late, we feel technically its finding support and is due a bounce but buyers are fighting a major trend which in our opinion may pick up momentum over time hence we are cautious.
Worth also noting that Faralon still has one more tranche of shares to sell – about ~50m shares from memory. Personally, I would be waiting until they have cleared the decks as they are a confirmed seller. Also, Blackrock owns 2.6% of the company and Coal is not high on their priority list. From what I see they sold 4.46m shares last week (13th Feb) and still hold 27.5m shares. While technically the stock does look like it’s found a base, I struggle to see an upside catalyst.
MM is neutral / slightly positive WHC at current levels.
Whitehaven (WHC) Chart
Question 7
“Hi guys do you have any clues on an ETF for parking cash I was looking at say Vanguard Aust. fixed interest index fund VAF ETF performance of 7% return 1Yr. do you have any suggestions on this way of trying to get a better return for idle cash ,also do you have any updates on the best Hybrids and MXT type investments available now” - Best Regards, Ted R.
Hi Ted,
Last year all assets classes did well include fixed income as a result of falling interest rates – this year I doubt we’ll have the same strong tail winds so the one-year performance of 7% I think is less valid. I remain keen on hybrids as an asset class and it looks like NAB may launch one shortly, which we will cover when it does. In terms of Hybrids now, AMPPB looks attractive as a higher risk offering relative speaking, at 5.43% to first call (5.9 years away), BENPG pays 3.78% with 4.4 years till first call while CBAPI has 7.2 years to run an offer 3.93%. These are obviously floating so increase if interest rates go up.
Another option to consider may be the MM Income SMA, an investible portfolio that contains a more diversified exposure to stocks, hybrids and bonds and other income securities like MXT targeting a yield around 5.5% plus some capital gain.
https://www.marketmatters.com.au/new-income-portfolio-csv/
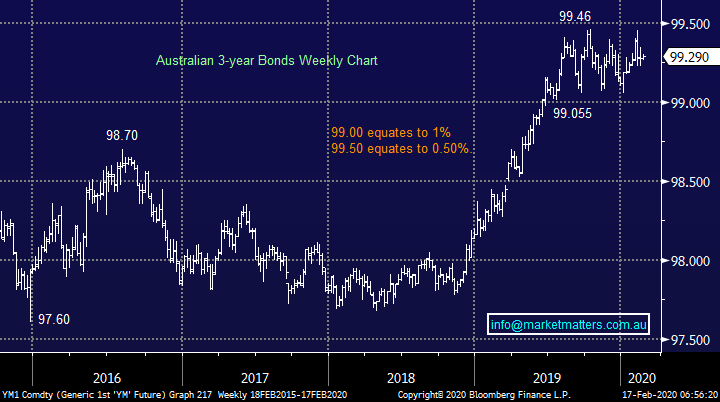
The important thing to remember is a number of the investment vehicles will struggle when bond yields increase, the Australian 3-years shown below are within striking distance of their all-time 0.5% low while they been above 5% less than 10-years ago.
Australian 3-year Bonds Chart
Question 8
“Would appreciate an indication of which stocks you would buy of the following which go ex div over the next 3 weeks GEM PTM AWC HLO SKI AGL.” - Thanks & keep up the great work, Brian S.
Hi Brian,
Thanks for the thumbs up. In simple terms, we like SKI and this resides in our income portfolio, we don’t like the underlying trends in GEM and AWC, PTM is interesting although we have JHG and PDL in the growth portfolio and PPT in the income portfolio which implies we like those more. Remember, Kerr Neilson founder and largest shareholder of PTM still has a load of stock to sell.
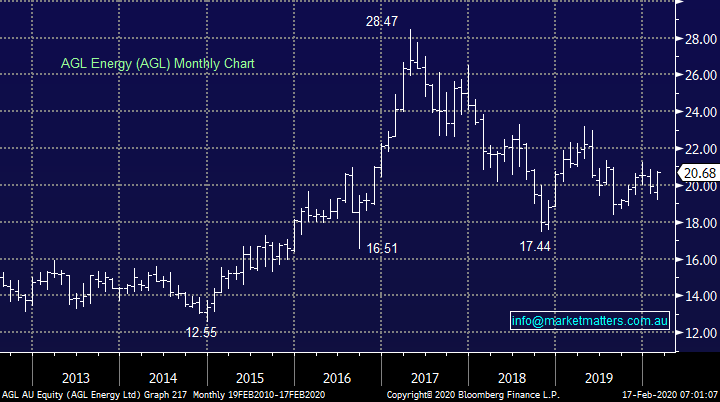
AGL is the probable favourite right here / now from a risk / reward perspective, probably not a common choice. After its 2-year decline AGL looks to be offering ok value while its almost 5.5%-part franked yield is clearly attractive especially as investors continue to move up the risk curve in search of yield.
MM likes AGL with stops below $19.
AGL Energy (AGL) Chart
Question 9
“Hi Guys, do you have any research/views/comments on 5GN?” - Thanks, Phil C.
Morning Phil,
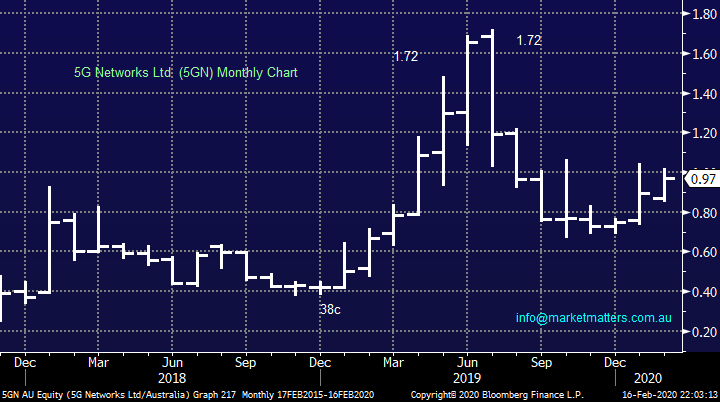
Telco carrier 5G Networks (5GN) finally rewarded loyal shareholders last month after releasing its quarterly report which included half-year cash receipts of over $28m and a cash balance approaching $3m. This company has been aggressive on the acquisition trial and its cash / debt position looks good for this to continue moving forward. The company looks interesting as a “speccy” play but its volatility of the last few years should not be discounted.
MM likes 5GN as an aggressive play with stops under 85c.
5G Networks Ltd (5GN) Chart
Question 10
“Hi, please see attached, any correlation SM1 with A2M, since middle of 2018, the correlation is diminishing, any view that SM1's 2 years low, buy in dip? And BUB, AU8 new low price as well.” – Cheers Steve Y.
Hi Steve,
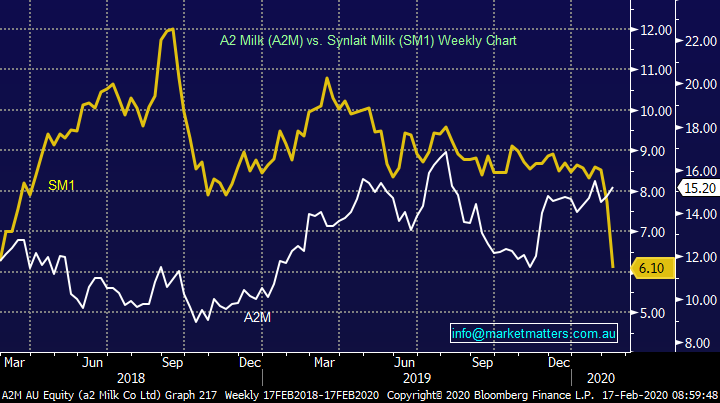
I love correlations especially when we have a leading indicator agreeing with our fundamental view on a stock, however in terms of the correlation between A2M and SM1, the past few of years is not overly strong, and therefore not overly relevant in our view.
In terms of SM1, this is a growth stock that last week had a big downgrade and is unlikely to grow for the next few years, so we have no interest there. SM1 sighted weakness in China as the reason for their big downgrade, which is a potential negative for A2. A2’s recent form has been stronger than SM1, however as always, buying ahead of results can cut both ways. A2 report in 10 days’ time (27th Feb).
MM has been looking at a2 Milk (A2M) believing the stock is headed towards new all-time highs assisted by the Chinese consumers appetite for food produce from cleaner / safer countries, although this is unlikely to show up in their upcoming report.
MM is bullish A2M from current levels although buying ahead of the result is a risk.
A2 Milk (White) versus Synlait Milk (Yellow)
Question 11
“Awesome email (Weekend Report), My question for Monday please: Thoughts on OVH? The #1 in Funds platform Management with $530b FUA and #3 in Super platform FUA with $6b. Growing 40% p.a. yet stock 70% off it's high. On Fwd 8.1% grossed up yield & plans to buy back 10% of stock post announcing results. Insiders own 20% of company. Note the first Analyst to call Afterpay at $1.40, Laf from Bell Potter has double share price target at 60 cents and now has it his number one call. It sold Diversa for $42m to Sargon got paid $12m but $30m is outstanding from Sargon. So, they now have SEQ:ASX and Madison. Has been belted on Sargon but the other two divisions each alone could be spun off for more than the entire market cap. So, let's give it conservatively $25m net cash for $78m mkt cap company, where NetWealth is $2b mkt cap with only $25b retail FUA. Big disconnect. Priced 1.3x Sales other Comps are 7x. Comps 47x PE, this 15x. Moelis #3 shareholder has been adding to position.” - Rodney F.
Morning Rodney,
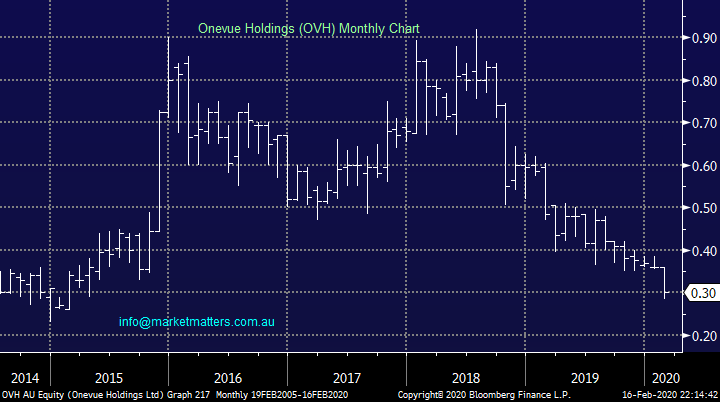
Thanks, as always for the positive comments. Looking at the share price of Onevue (OVH) the market clearly doesn’t share your optimism at present with concerns over the $31m owed to the business by Sargon Capital front and centre – the administrators have been called into Sargon. Undoubtedly the current share price is building in a large degree of bad news but for us, it’s in the too hard basket.
Of course, the other issue remains around ongoing margin pressure and that to me is the bigger elephant in the room. It’s very hard for investment platforms to consolidate, i.e. buy each other to get instant scale, making OVH an unlikely takeover option.
MM is neutral OVH at present.
Onevue Holdings (OVH) Chart
Question 12
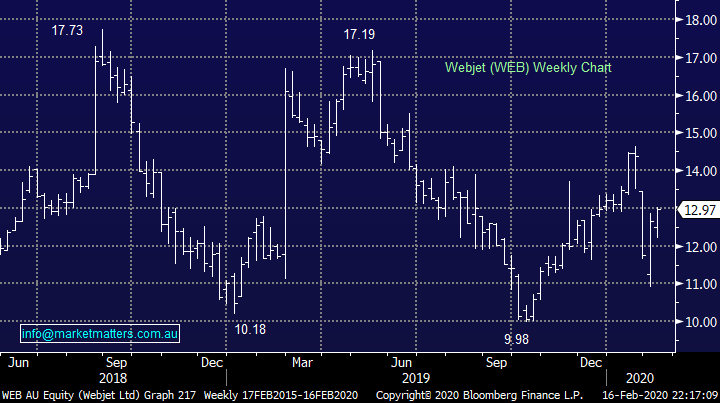
“Hi, I’m curious as to how you are bullish WEB given the situation with coronavirus. With stats for new cases approaching 70,000 and still on the rise, China still under lockdown in many areas and with Australian companies (e.g. Lend Lease) now starting to ban all overseas travel, not just China, wouldn’t the outlook for travel companies be negative? It seems to me that things could get a lot worse before they get better, it’s already affecting company supply chains, and I don’t think the market generally is recognising that risk at the moment.” – Thanks Bruce G.
Morning Bruce,
Webjet (WEB) like other tourism stocks is most certainly going to struggle short-term due to the coronavirus but it’s when stocks are in the “eye of the storm” of bad news that buying opportunities emerge, just think of Commonwealth Bank (CBA) during the Royal Commission when it was trading close to $65. The worst may still be Infront of us from China, but stocks usually lead fundamentals by around 6-months making this a time to be considering stocks / sectors impacted most by the virus.
MM likes WEB at current levels.
Webjet (WEB) Chart
Overnight Market Matters Wrap
- A mixed session was experienced last Friday ahead of their long weekend in celebration for President’s Day tonight (US markets are closed)
- All signs of positive is being seen as US consumer sentiment rose to its highest level in two years, ahead of economist’s expectations, while investors are looking past any coronavirus led impact on growth, with confidence that central banks and governments will help to protect the global economy from negative effects of the outbreak. At worst, the optimists are seeing it as a one quarter anomaly.
- All metals on the LME were lower, particularly nickel down 2%. Iron ore was flat while crude oil closed 1.23% higher. BHP is expected to underperform the broader market after ending its US session off an equivalent of -0.55%.
- The March SPI Futures is indicating the ASX 200 open 13 points lower, testing the 7115 level this morning.
Have a great day!
James & the Market Matters Team
Disclosure
Market Matters may hold stocks mentioned in this report. Subscribers can view a full list of holdings on the website by clicking here. Positions are updated each Friday, or after the session when positions are traded.
Disclaimer
All figures contained from sources believed to be accurate. All prices stated are based on the last close price at the time of writing unless otherwise noted. Market Matters does not make any representation of warranty as to the accuracy of the figures or prices and disclaims any liability resulting from any inaccuracy.
Reports and other documents published on this website and email (‘Reports’) are authored by Market Matters and the reports represent the views of Market Matters. The Market Matters Report is based on technical analysis of companies, commodities and the market in general. Technical analysis focuses on interpreting charts and other data to determine what the market sentiment about a particular financial product is or will be. Unlike fundamental analysis, it does not involve a detailed review of the company’s financial position.
The Reports contain general, as opposed to personal, advice. That means they are prepared for multiple distributions without consideration of your investment objectives, financial situation and needs (‘Personal Circumstances’). Accordingly, any advice given is not a recommendation that a particular course of action is suitable for you and the advice is therefore not to be acted on as investment advice. You must assess whether or not any advice is appropriate for your Personal Circumstances before making any investment decisions. You can either make this assessment yourself, or if you require a personal recommendation, you can seek the assistance of a financial advisor. Market Matters or its author(s) accepts no responsibility for any losses or damages resulting from decisions made from or because of information within this publication. Investing and trading in financial products are always risky, so you should do your own research before buying or selling a financial product.
The Reports are published by Market Matters in good faith based on the facts known to it at the time of their preparation and do not purport to contain all relevant information with respect to the financial products to which they relate. Although the Reports are based on information obtained from sources believed to be reliable, Market Matters does not make any representation or warranty that they are accurate, complete or up to date and Market Matters accepts no obligation to correct or update the information or opinions in the Reports. Market Matters may publish content sourced from external content providers.
If you rely on a Report, you do so at your own risk. Past performance is not an indication of future performance. Any projections are estimates only and may not be realised in the future. Except to the extent that liability under any law cannot be excluded, Market Matters disclaims liability for all loss or damage arising as a result of any opinion, advice, recommendation, representation or information expressly or impliedly published in or in relation to this report notwithstanding any error or omission including negligence.


