Subscribers’ questions (BAL, WTC, APX, PPT, IFL)

Not a lot of market moving news out over the weekend other than a Tweet from Mr Trump that focussed on the strength in the Oil price. “Just spoke to King Salman of Saudi Arabia and explained to him that, because of the turmoil & disfunction in Iran and Venezuela, I am asking that Saudi Arabia increase oil production, maybe up to 2,000,000 barrels, to make up the difference...Prices to (sic) high! He has agreed!,”
That may provide a negative headwind for Oil prices in the near term given Saudi confirmed they did have another 2m barrels per day production capacity.
Australian housing data was again fairly soft with auction clearance rates in Sydney in the mid 50’s which will obviously play into the RBA’s thinking when they meet but sit on their hands on Tuesday. Expect the RBA cash rate to remain at 1.5% for a long time yet with the futures market currently pricing just a paltry 8 basis point (0.08%) increase by May 2019. Stagnant employment, a lack of wage growth and now tighter lending standards from the banks means the RBA has very little choice at the moment.
The banks however have started to increase interest rates on loans – and the below chart shows why. Banks borrow short and lend long, and short term rates have gone sharply higher as shown by the 90 day bank bill rate below. While a negative for borrowers, shorter term deposit rates have gone up while anything with a yield priced off bank bill rates such as hybrids have also seen their returns go up.
90 Day Bank Bill Rate Chart

SPI Futures are pricing a gain of 27pts this morning with BHP looking to open down around 0.34% lower at $33.80. As we highlighted last week the two days that straddle either side of the EOFY are generally positive, however at MM we get the feeling that the ASX was being supported into financial year end last week. Volumes will be down today and for the next 3 weeks given the start of school holidays today.
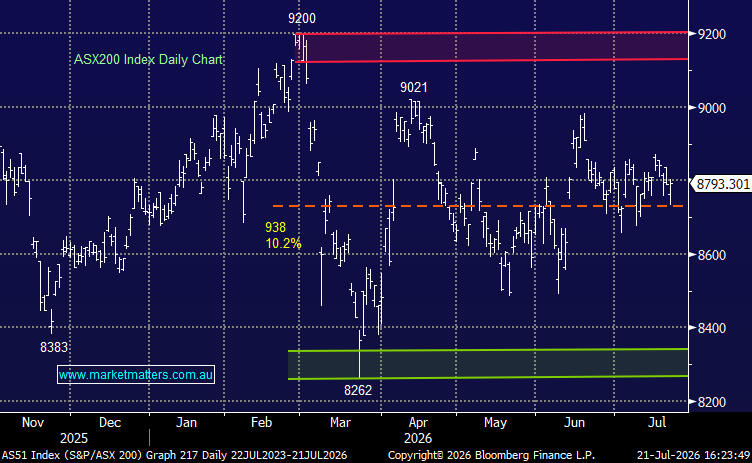
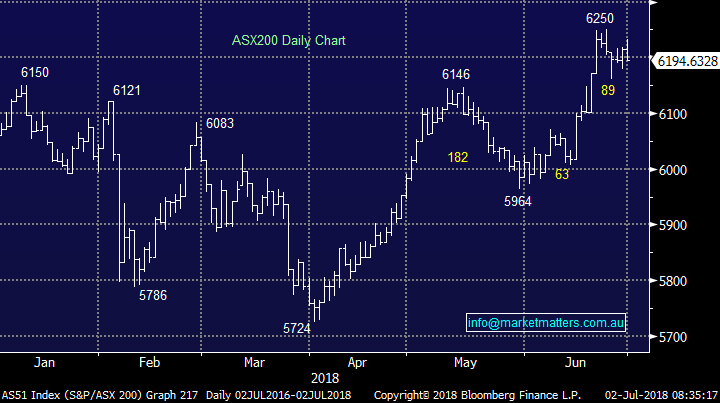
· At MM we are neutral / bearish the ASX200 in the short-term and we remain in net “sell mode”.
ASX200 Chart
Fewer questions this week which hopefully means our market views are becoming clear to all - a relatively straight forward way to kick off the new financial year! As always, keep the questions coming for next week.
Question 1
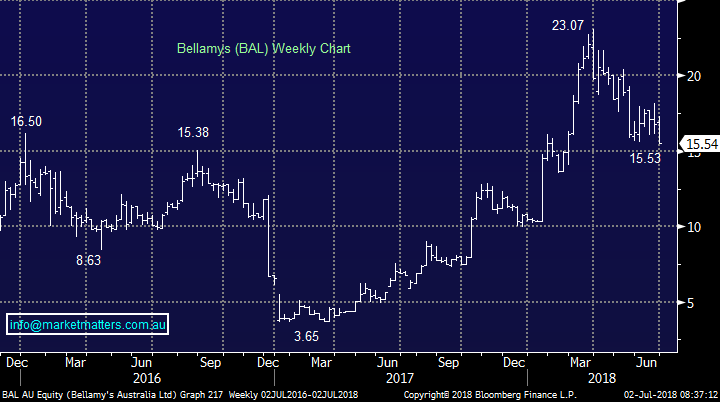
"Hi James & M&M, Bellamy has pulled back to mid $15.50 is it worth putting a trade on it considering we hold A2M in the portfolio and if so what buy in and sell level would you advise to target. Thanks love your work." - Tony
Hi Tony, We’ll have more interest in Bellamy’s (BAL) if its trades below $15.00 which is a distinct possibility if the market corrects as we think it will. We think growth stocks trading on high valuations such as Bellamy’s are at more risk into any market weakness. In the bigger picture the company should benefit from the looming population “pop” in China and of course the rise of the Chinese middle class however as we’ve seen over the past 12 months or so, that tailwind is also creating more competition in the market for Bellamy’s. We track a US listed ETF called the Global X China Consumer ETF and this has an influence on our thinking when considering China facing consumer stocks.
While we retain a structurally bullish outlook for the Chinese consumer, the below ETF chart illustrates it’s been a 2 ½ year uninterrupted rally to date and further consolidation or a deeper pullback is overdue. This was one of the reasons we sold half of our A2 Milk
(A2M) into the last pop higher.
Global X China Consumer ETF (CHIQ) Chart

Bellamy’s Australia (BAL) Chart
Question 2
"Hi James and Team, Really love reading your reports. My question relates to two stocks I hold. I have done really well out of appen and wisetech, with you guys predicting further falls with the Nasdaq is there a correlation with apx and wtc as they are both tech company’s who have enjoyed huge runs over the last 2 years.
Would it be prudent to lock in some profits. (Generally that goes against my investment thesis as I like to let my winners run and cut the pony's as quick as possible)." - Regards Frank
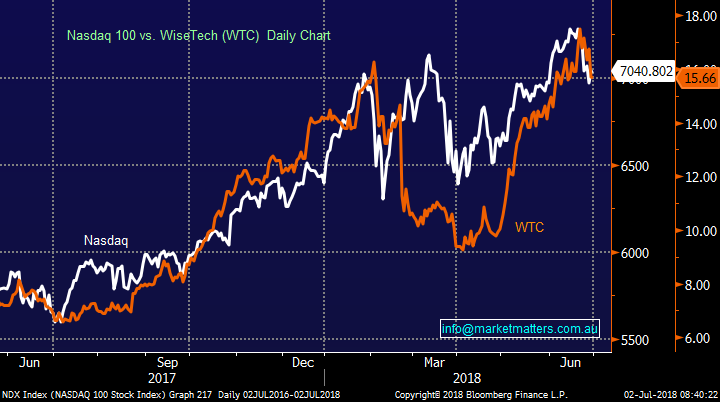
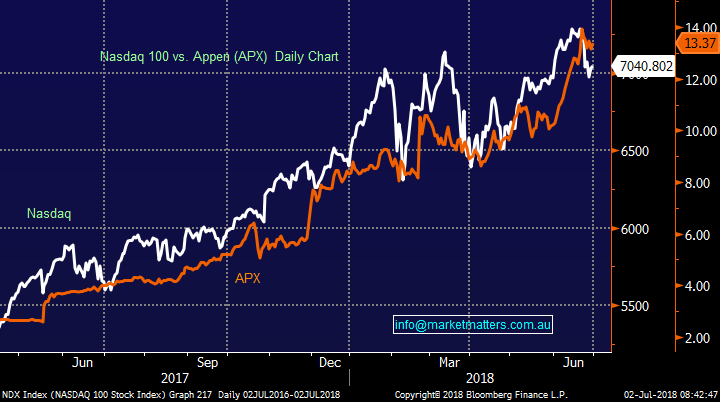
Well done Frank! If we held these stocks we’d certainly consider taking at least partial profits in them now given our more negative outlook for the NASDAQ, and the high correlation these stocks have with the US Tech Index. Arguably, Appen has less upside priced into it trading on a forward PE of ~40x while WTC on 108x forward is a massive multiple while they also have integration risk after being on an acquisition spree in the last 12 months or so. Both have been phenomenal success stories in recent times with WiseTech up ~120% in FY 18 while Appen has put on over ~200%.
WTC - Technically, a pullback towards $10 would not surprise
APX - APX looks neutral just here but technically we would be a seller of fresh highs
NASDAQ versus WiseTech (WTC) Chart
NASDAQ versus Appen (APX) Chart
The NASDAQ has been the leading global index for much of this current bull run – the break below 7050 has generated a technical sell signal which should serve as a warning sign more generally.
US NASDAQ Chart

Question 3
"Dear James I enjoyed your chat with Charlie Aitken – his view that Chinese stocks have a lot of potential makes sense. However, it’s obviously not a strategy which can be pursued by the small investor. I would guess that the only practicable way for the little guy is ETF’s. Can you recommend anything for us small investors?" - Regards, John
Hi John – thanks for the feedback. Investing through ETFs listed in Australia is one way to get exposure to Chinese stocks however as with anything, it’s getting exposure to the right themes and the right companies taking advantage of those themes at the right time – sounds simple! Investing in an actively managed fund (like Charlie’s) is another way of doing it where you’re backing an active manager to make the right calls on your behalf.
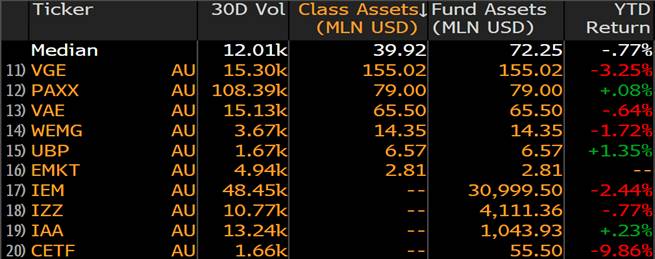
In terms of ETFs below is a list of ETFs that have Asian or Emerging Markets exposure that are listed on the ASX. There are a greater range listed in the US however this is what the ASX has the offer. The iShares (IZZ) will provide the most direct exposure to large cap Chinese Stocks.
Question 4
"Hi James & Team – You have Perpetual in the income portfolio – is it worth buying here? Thank you in advance." - Simon
Thanks Simon – timely as we covered Perpetual (PPT) in the Weekend Report – Click Here. Perpetual is a Fund Manager that also has an advice network. The funds area has suffered from outflows while the advice area has come under pressure following the royal commission. We recently sold out of IOOF (IFL) in the Growth Portfolio for a loss given the level of ‘unknowns’ from a regulatory standpoint. That also applies to PPT however on 13.7x forward earnings and a yield of 6.5% fully franked, we think PPT has priced a lot of this downside in. The other concern is obviously the market generally pulling back from here, however PPT actually has a lower correlation to the market than many other diversified financials. (PPT has a 0.35 correlation, Macquarie for instance is around 0.62).
Short-term we are actually bullish PPT targeting a bounce back towards $43-$45.
Perpetual (PPT) Chart

In the Weekend Report we flagged an opportunity for a pairs trade which involves going short one security and long another, in this case, short IFL and long PPT. A reasonably sophisticated strategy.
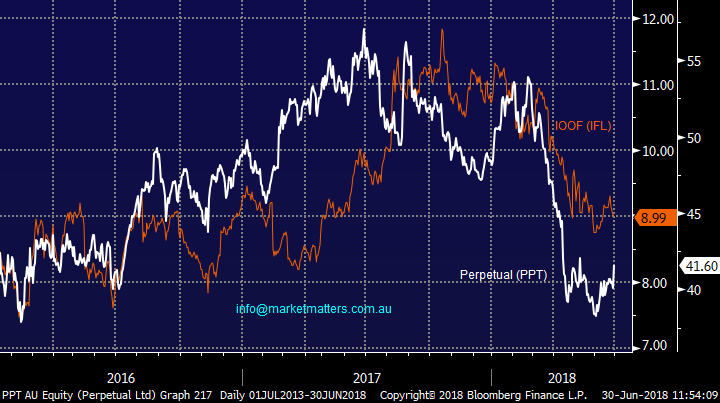
Perpetual (PPT) typically trades at a premium to IOOF (IFL) however we have the reverse playing out at the moment. IFL has more risk from a regulatory standpoint around grandfathered commissions following their recent ANZ acquisition. Perpetual is significantly cheaper and the spread between the two should revert.
Sell IFL and Buy PPT as a pairs trade
IOOF (IFL) versus Perpetual (PPT)
Overnight Market Matters Wrap
· The three key US indices closed between 0.1% and 0.2% stronger, albeit losing ground in late trading from earlier highs. Nike was among the star performers rising 11% to hit an all- time high after stronger than expected quarterly earnings. Oil, gold and iron ore were all firmer over the weekend, and base metals steady.
· The US is due to implement tariffs on US$34bn worth of China goods at the end of this week (July 6th) and in further retaliatory moves, Canada announced on Friday it will also introduce taxes on US$12.6bn of US imports in response to US moves to tax Canadian steel and aluminum imports.
· The September SPI Futures is indicating the ASX 200 to open 27 points higher towards the 6222 level this morning.
Have a great day!
James & the Market Matters Team
Disclosure
Market Matters may hold stocks mentioned in this report. Subscribers can view a full list of holdings on the website by clicking here. Positions are updated each Friday, or after the session when positions are traded.
Disclaimer
All figures contained from sources believed to be accurate. Market Matters does not make any representation of warranty as to the accuracy of the figures and disclaims any liability resulting from any inaccuracy. Prices as at 02/07/2018
Reports and other documents published on this website and email (‘Reports’) are authored by Market Matters and the reports represent the views of Market Matters. The MarketMatters Report is based on technical analysis of companies, commodities and the market in general. Technical analysis focuses on interpreting charts and other data to determine what the market sentiment about a particular financial product is, or will be. Unlike fundamental analysis, it does not involve a detailed review of the company’s financial position.
The Reports contain general, as opposed to personal, advice. That means they are prepared for multiple distributions without consideration of your investment objectives, financial situation and needs (‘Personal Circumstances’). Accordingly, any advice given is not a recommendation that a particular course of action is suitable for you and the advice is therefore not to be acted on as investment advice. You must assess whether or not any advice is appropriate for your Personal Circumstances before making any investment decisions. You can either make this assessment yourself, or if you require a personal recommendation, you can seek the assistance of a financial advisor. Market Matters or its author(s) accepts no responsibility for any losses or damages resulting from decisions made from or because of information within this publication. Investing and trading in financial products are always risky, so you should do your own research before buying or selling a financial product.
The Reports are published by Market Matters in good faith based on the facts known to it at the time of their preparation and do not purport to contain all relevant information with respect to the financial products to which they relate. Although the Reports are based on information obtained from sources believed to be reliable, Market Matters does not make any representation or warranty that they are accurate, complete or up to date and Market Matters accepts no obligation to correct or update the information or opinions in the Reports. Market Matters may publish content sourced from external content providers.
If you rely on a Report, you do so at your own risk. Past performance is not an indication of future performance. Any projections are estimates only and may not be realised in the future. Except to the extent that liability under any law cannot be excluded, Market Matters disclaims liability for all loss or damage arising as a result of any opinion, advice, recommendation, representation or information expressly or impliedly published in or in relation to this report notwithstanding any error or omission including negligence.
To unsubscribe. Click Here