Subscriber Questions
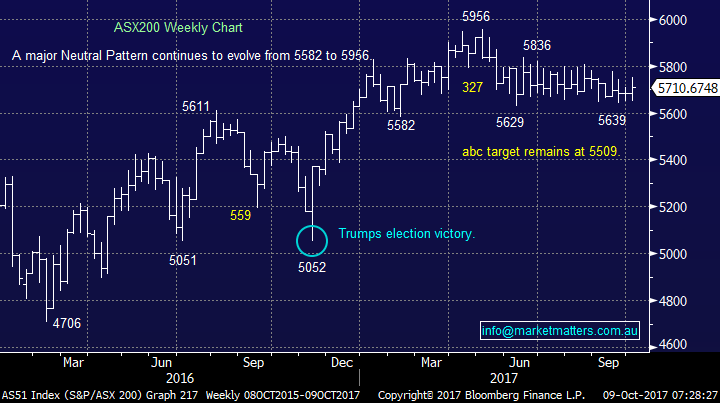
As we enter our 21st week of the ASX200 range trading between 5629 and 5836 we continue to wonder what catalyst will be required to break this almost unprecedented period of sideways consolidation. Over the weekend we received no obvious news that’s going to break the markets slumber but of course “never say never”!
As was covered comprehensively in the Weekend Report we believe investors simply need to keep their eyes on the bigger picture when considering the risk / rewards in this mature bull market. At MM we are happy to “play” the market around the fringes for now, probably into 2018, before we move to increase cash and look at investments that are inversely correlated to the market (that benefit from market weakness). Our current view (s) for the local ASX200:
- Our preferred scenario is a 3% spike down towards the 5500 support area before we can envisage underweight fund managers scramble for stock. The strong likelihood is we will need a ~5% correction by US stocks for this to unfold but this is nothing compared to the rally since Donald Trump’s election victory.
- Medium-term we can still see a break above the major psychological 6000 area, probably in a classic Christmas rally.
- Next year we continue to believe global equities will commence a ~20% correction which will provide enormous opportunities for the open-minded, prepared / flexible and well informed investor.
For now at least we’re comfortable sitting on 16.5% cash in the MM Growth Portfolio, and a shade more in the MM Income Portfolio as we continue to “tweak” our position into Christmas.
ASX200 Weekly Chart
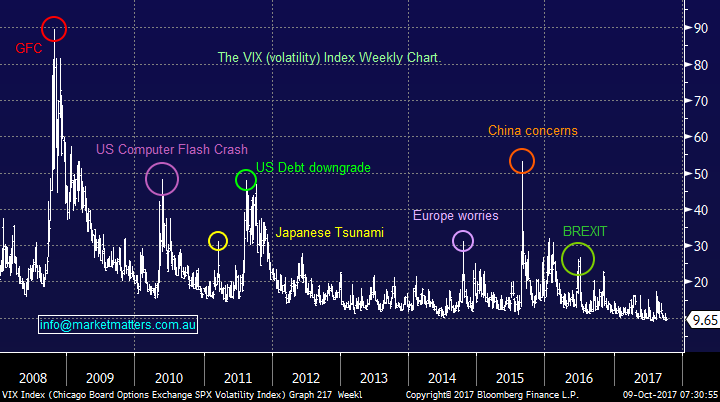
The sentiment indicators for US stocks, led by the “Fear Index” (VIX), are at extreme levels which usually ends up with a sharp correction to hurt the greedy optimists.
“Fear Index” VIX Weekly Chart
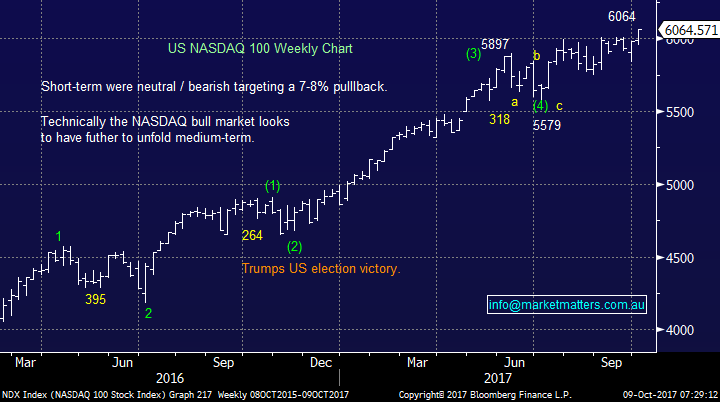
With regard to US stocks, we still anticipate an eventual pullback towards the 5650 area for the tech NASDAQ, or around 6.5% from Friday’s closing level.
US NASDAQ Weekly Chart
Question 1
“I am considering buying shares in the A2 Milk Company or Synlait Milk Ltd. As both share prices are high, would you recommend the purchase of either of them - taking a long term view?” – Ralph P.
Hi Ralph, thanks a great topical question, A2M is certainly the “hot” stock at present but chasing for “Fear of missing out” is often a dangerous and costly game. Always remember human emotions are awful influences for investors often leading to buying of tops and selling of bottoms!
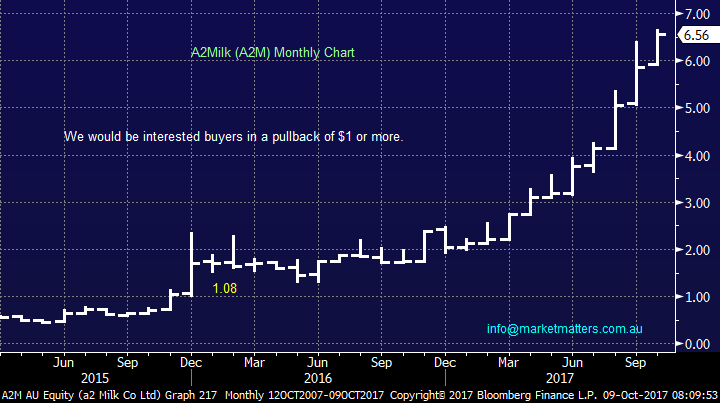
A2M produces cow’s milk which is free of a protein called beta casein A1, we buy it, but not 100% sure why – maybe they market the product very well!! The real kicker for growth though has come from China, and specifically demand for baby formula. This has seen A2 triple in 2017 tracking the rising demand for the product.
Clearly the exponential rally in the share price we have witnessed is primarily influenced by the Chinese potential which is clearly huge - A2M is trading on a P/E valuation of 36.3x 2018 earnings and does not yet pay a dividend, which does not concern us if the growth is solid. Goldman’s reckon A2 will double its Chinese market share by 2020.
While there are a number of risks like all investments the main concern at this stage is has the optimism / valuation stretched too far – remember Bellamy’s and Blackmore’s whose share prices collapsed after surging on China euphoria. Although we do stress we are not predicting another painful scenario witnessed by these 2 stocks.
At this point in time MM would advocate accumulating A2M into weakness between $5 and $6.
A2Milk (A2M) Monthly Chart
Question 2
“Could you explain the RIO buyback and why my shares in RIO have a XQ symbol against them.? Would the price that the shares were bought influence whether they should be offered for sale in the buyback.?
Could you also comment on HVST. I am concerned at the reducing capital value.!!” - Regards John R.
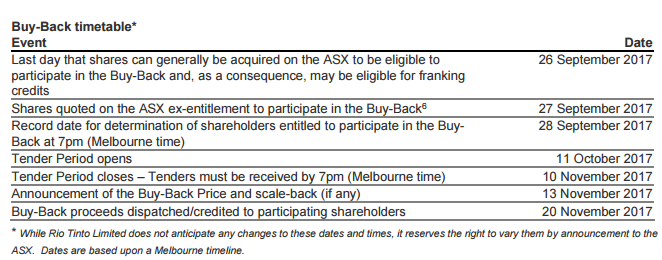
Morning John, thanks for the 2 part question which have probably at least crossed the mind of most subscribers. The real benefit of the off market component of the announced buy back (they also have an on-market buy back happening in London), is the potential tax benefit given the buy-back is structured with a small capital component and a big fully franked dividend. In short, investors will be able to tender shares into the buy back at a discount to the prevailing market price (between 9-14%) – from experience, these things generally price at the bigger discount. So in simple terms, a holder can sell their shares back to the company at a 14% discount to the market price, receive a $9.44 capital component and the rest as a fully franked dividend, therefore benefitting from the franking credits which is substantial. We’ve run out of time this morning, however this week we’ll send subscribers a simple guide of the benefits depending on different holding structures & tax rates and do a quick video explaining it – keep an eye out. Below is the timeline for the deal.
Timeline
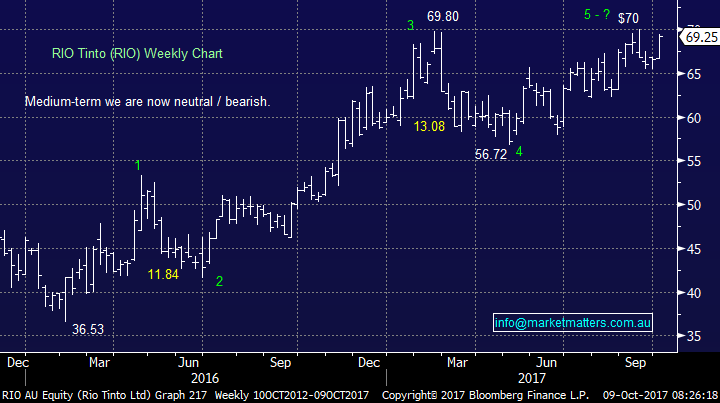
RIO Tinto (RIO) Weekly Chart
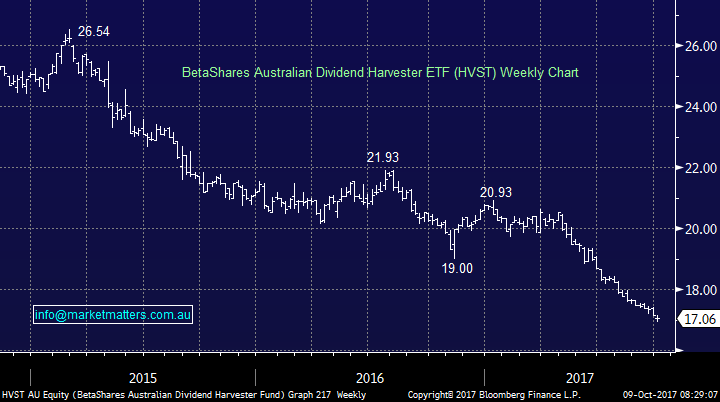
The second part of your questions was around the harvester fund, a listed managed fund that is designed with a high yield but is expected to lose capital over time. We’ve written about this before, have not been a fan of it, have no exposure to it across our portfolio’s and have no interest in buying any.
They did put out a good piece outlining the strategy recently (presumably after copping some heat from investors / advisers given its performance). The link to the report is below.
https://www.betashares.com.au/wp-content/uploads/2017/06/Revisting_HVST_Strategy_final.pdf
Dividend Harvester Fund (HVST) Weekly Chart
Question 3
“Hi MM, TLS seems to be following in the footsteps of TPG, because there does not appear to be much action in this sector. Do you see any love for TLS in the near future, or do we have to wait until the Christmas Rally.” - Regards, Phil B.
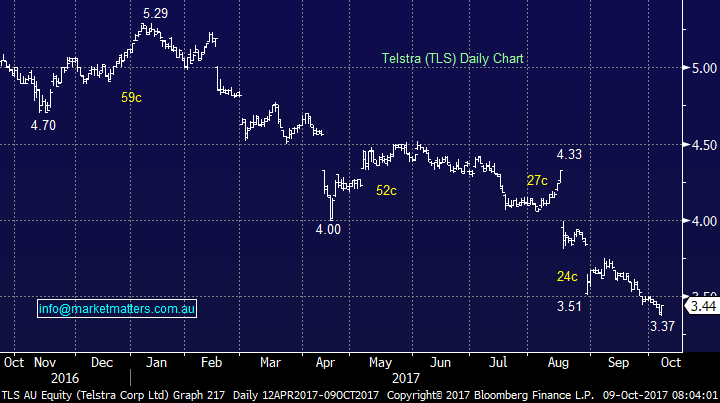
“Telstra .... how much longer are you going to buy and hold this disastrous company that has failed to raise its earnings per share for 10 years? On 4th April you bought Telstra at $4.62. You bought more on 12th April for $4.29. You then sold it on 26th June for $4.35 admitting defeat. You decided to start buying it again on 17th August for $3.85 and then more on 30th August for $3.60 then more on 27th September for $3.48. It's now $3.38. I wrote a while back to comment that buying Telstra in your Growth portfolio was a very strange idea. You seem to be having the same death-wish as you did buying Vocus and don't seem to have learned the lesson about telco stocks. When are you going to give up on Telstra?” – Paul H.
Morning Gents, thanks for the questions on probably the most talked about stock in recent months and as you can see from the inclusion of Paul’s question we are not afraid of some criticism at times, we pride ourselves on being honest and transparent. Let’s again look at our thoughts and trades on Telstra (TLS):
- We are very much ahead on our TLS investing since MM’s inception although as you correctly point out Paul, Vocus (VOC) was our worst investment as a company.
- Our recent sale at $4.35 we would not call “admitting defeat” we did make a small profit and accurately stated we expected to buy the stock under $4.
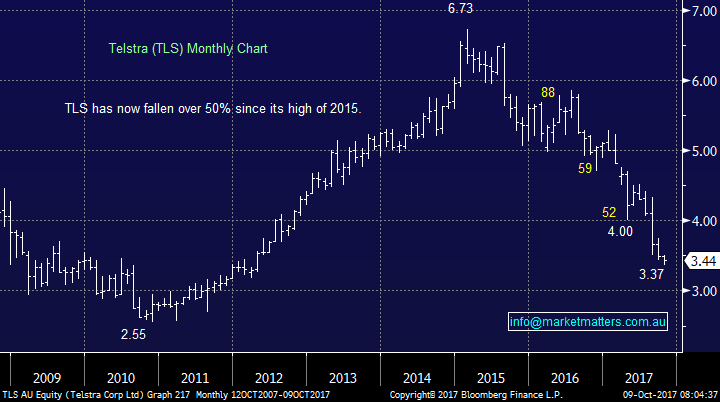
We do not love Telstra as a company which as you say Paul has failed to increase its EPS for a decade but let’s look at what the share price has done since 2010:
- TLS is still up 34% over the period and has paid almost $2.30 in fully franked dividends during this period.
- Over the same 8-year period BHP is down well over 20% and a buy and hold investor would still be struggling to be breakeven after dividends.
Please note we not calling TLS a great performer as plenty of companies have smashed the above over the same period e.g. CSL and Cochlear come to mind.
However we believe and have regularly stated Telstra is now a reasonable trading vehicle taking into consideration the 6.4% fully franked yield – and specifically being active around these dividend distributions.
We do not imagine holding TLS over the long term but anticipate jumping in and out at appropriate times. We are looking for a 8-10% bounce from recent lows which we may consider taking if it unfolds. Remember since the major top in 2014 TLS has paid 84c in fully franked dividends and bounced almost 18% on one occasion and twice well over 10%, this does show some opportunities are available in this markets most unpopular stock!
Telstra (TLS) Monthly Chart
Telstra (TLS) Daily Chart
Question 4
“Hi MM, From the weekend report. End of Q1 means March 31 or Sept 30 ? We see another major inflection point on the horizon for stocks and fully expect to be in over 50% cash before the end of Q1 2018” – Lester D.
Hi Lester, thanks for the question, it’s always important to clarify our thoughts especially on such a large issue. So far since our inception MM has been smack on with the 2 major inflection points for global stocks, once moving once aggressively to cash and the secondly fully back into stocks :
- We moved heavily into cash in mid-2015 before stocks corrected almost 20%.
- We moved aggressively back into stocks in early 2016 and have basically maintained this position ever since.
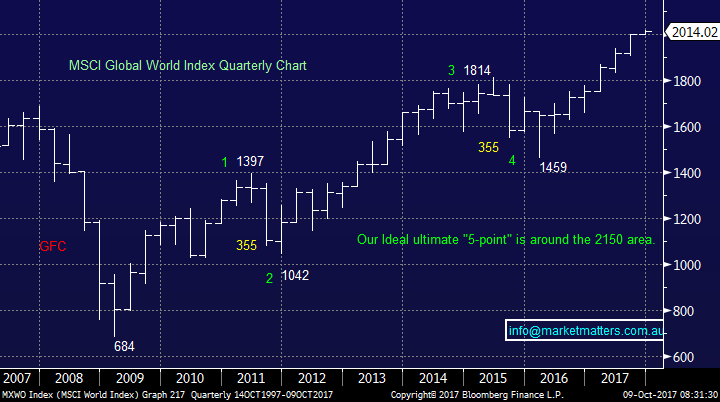
However this is not about crowing it’s about what comes next as we believe it may be larger than both these respective market turns. At MM we are looking for a major top as you pointed out in Q1, this means between January and March 2018 but our best guess at this stage is by the end of January 2018 and we will be in a large cash position.
MSCI Global World Index Quarterly Chart
Overnight Market Matters Wrap
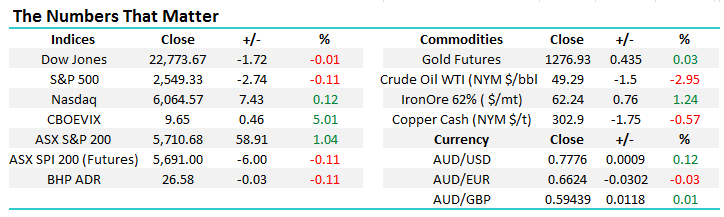
· Wall St ended a week of record levels on a flatter note as stronger than expected wage inflation data firmed the chances of another rate hike in December, following a raft of solid economic numbers.
· Employment numbers fell for the first time since 2010 (-33,000) as a result of the recent hurricane impact, but wage inflation rose to 2.9% annualised while unemployment fell to 4.2%. US treasuries spiked to 2.4% during Friday trading on the wage number before closing at 2.37%, with increasing expectations that they will trade in a higher range into 2018.
· Commodities were mixed with the oil price falling 2.5% and gold 0.5% higher as tensions continued to escalate on the Korean Peninsula with reports of an expected imminent further long range missile test.
· Chinese markets are due to start trading again today after last week’s “Golden Week” holiday. Local futures are pointing to a steady opening while the A$ is trading at near a 3 month low of around 77.7c.
Disclosure
Market Matters may hold stocks mentioned in this report. Subscribers can view a full list of holdings on the website by clicking here. Positions are updated each Friday.
Disclaimer
All figures contained from sources believed to be accurate. Market Matters does not make any representation of warranty as to the accuracy of the figures and disclaims any liability resulting from any inaccuracy. Prices as at 9/10/2017. 8.00AM.
Reports and other documents published on this website and email (‘Reports’) are authored by Market Matters and the reports represent the views of Market Matters. The MarketMatters Report is based on technical analysis of companies, commodities and the market in general. Technical analysis focuses on interpreting charts and other data to determine what the market sentiment about a particular financial product is, or will be. Unlike fundamental analysis, it does not involve a detailed review of the company’s financial position.
The Reports contain general, as opposed to personal, advice. That means they are prepared for multiple distributions without consideration of your investment objectives, financial situation and needs (‘Personal Circumstances’). Accordingly, any advice given is not a recommendation that a particular course of action is suitable for you and the advice is therefore not to be acted on as investment advice. You must assess whether or not any advice is appropriate for your Personal Circumstances before making any investment decisions. You can either make this assessment yourself, or if you require a personal recommendation, you can seek the assistance of a financial advisor. Market Matters or its author(s) accepts no responsibility for any losses or damages resulting from decisions made from or because of information within this publication. Investing and trading in financial products are always risky, so you should do your own research before buying or selling a financial product.
The Reports are published by Market Matters in good faith based on the facts known to it at the time of their preparation and do not purport to contain all relevant information with respect to the financial products to which they relate. Although the Reports are based on information obtained from sources believed to be reliable, Market Matters does not make any representation or warranty that they are accurate, complete or up to date and Market Matters accepts no obligation to correct or update the information or opinions in the Reports.
If you rely on a Report, you do so at your own risk. Any projections are estimates only and may not be realised in the future. Except to the extent that liability under any law cannot be excluded, Market Matters disclaims liability for all loss or damage arising as a result of any opinion, advice, recommendation, representation or information expressly or impliedly published in or in relation to this report notwithstanding any error or omission including negligence.
To unsubscribe. Click Here


