Subscriber Questions
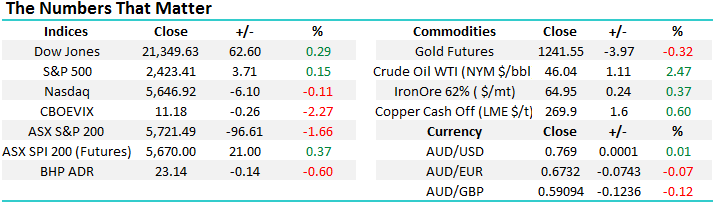
An awful session played out on the Australian Market on Friday with the ASX 200 down by -1.66%, closing below support at 5721 with the ‘yield stocks’ feeling most of the pain, however the sell-off was broad based. In the US on Friday night we saw a very slight rebound and this has SPI FUTURES up +21pts on our market this morning, however expect todays moves to be data driven from Asia. Official Chinese Manufacturing data was out over the weekend and this came in ahead of expectations and the trends here continue to be positive, however the Caixin which is typically a better guide is due out in today and this will have a bearing on how our Material stocks trade.
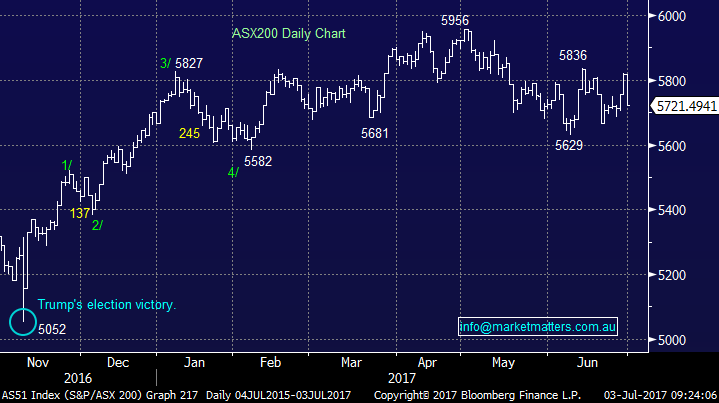
The ASX200 is looking a touch 50-50 as we enter the first full week of July, typically a very strong month for Australian stocks. The 5800 area provided excellent support for the local market during April and the first half of May, before giving way in June. That now becomes resistance if the market is to recover from Fridays decline.
When markets are unclear its best to just sit back and wait for clarity and good risk / reward investing opportunities which will undoubtedly materialise.
ASX200 Daily Chart
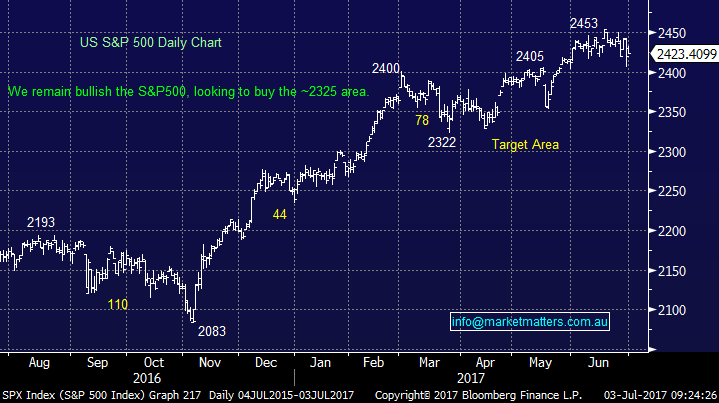
We often highlight the NASDAQ as the leading indicator for markets and that index is now off by -3.16% from recent highs while the S&P 500 is off by 1.95%. We’ve been targeting a ~5% correction for US stocks and this now looks in play. As we suggested on the weekend, the Australian market looks reasonable with the internals of the market improving towards the back end of June. Banks found some support while the resource stocks have moved strongly up from their recent lows – an impulsive move higher throughout last week. July is usually strong for these sectors and looking solely at Australia, we remain comfortable in our overall bullish stance here, however the US market corrects, we’ll obviously see and impact.
S&P 500 Daily Chart
Question1
Hi there, Have you ever considered IAG as a better alternative to QBE? I hold IAG, a far more stable and reliable stock to QBE. What are your thoughts on this? Regards, Paul
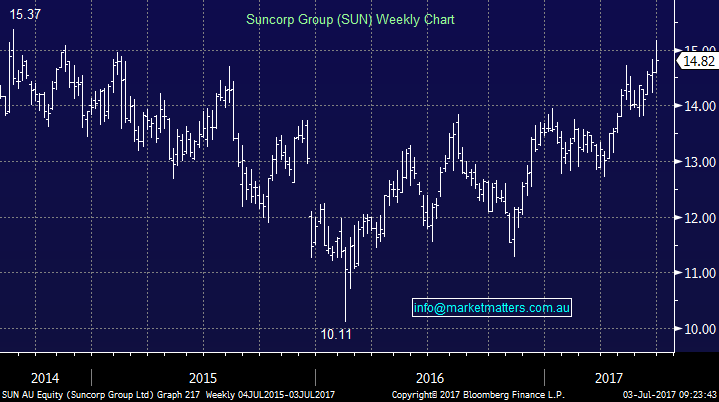
Thanks Paul – we certainly have considered IAG however more in a relative sense to our holding in Suncorp than as a replacement for QBE. We originally purchased QBE into weakness at $10.49 given its exposure to gradually improving global commercial premiums (still declining but at a slower rate), US Interest Rates which we think will rise and a weaker Aussie Dollar. QBE was more a ‘turnaround story’ after a difficult period where they had largely ‘under reserved’ for the policies they had written. We think this has changed (notwithstanding the recent slip) and QBE may finally emerge as a well run, leveraged insurance business with different exposure to IAG and SUN.
IAG is more domestically focussed and we preferred Suncorp in this instance for a few main reasons. SUN had the bank which provided some offset to the more volatile insurance business, we rated Patrick Snowball (the ex-ceo of SUN) pretty highly and had more regular contact with him, and we were sceptical at the time of the deal IAG did with Warren Buffets Berkshire Hathaway which effectively gave Berkshire 20% of IAG's gross written premium income but they also took 20% of its claims. This made IAG a lower risk proposition but one with lower growth – but it also alleviated a lot of their longer term risk which stemmed from the asbestos policies written by CGU Insurance 40 to 50 years ago. They were also caught by the New Zealand Earthquake in 2011 which can take a long time to settle. They needed a partner with deeper pockets and they got one in Buffet. At this juncture, the insurance sector has tail winds and we like it – however having IAG and SUN in the portfolio gives too much of a domestic focus and not enough exposure to rising US rates in our view.
Suncorp (SUN) Weekly Chart
Question 2
G’day, a question for Monday. Given previous highs in SUN at $15.37, which presumably indicates resistance, why would you be looking to sell at $16?? Surely, from a technical perspective, you should either sell just under resistance or, if broken, hang on as that becomes technical support??
Cheers – James
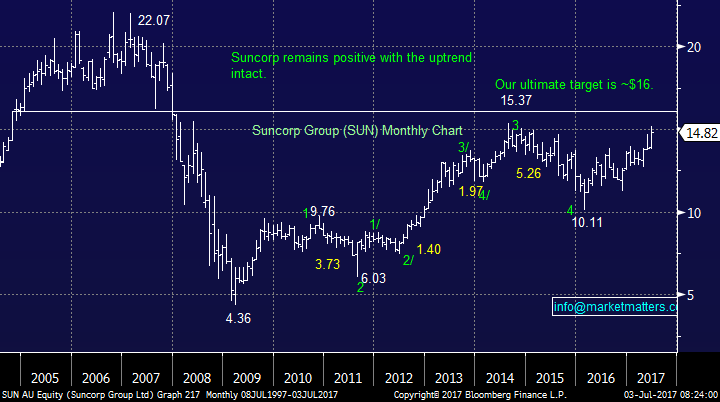
Thanks James. Suncorp and Insurance stocks generally are starting to get a lot of attention and this does get us nervous! We’ve had the $16 price target on SUN for a long time and for much of that it seemed a long way off however gradually the stock has rallied and the number is now insight. We see past resistance at $15.37 as you highlight however in our view, the wave count suggests a likely push up through that level to $16 – which was the strong support in the stock back in 2005 -2008. Obviously we keep an open mind here and as suggested previously, will look to trim our holding by 4% around ~$15.50.
Suncorp (SUN) Monthly Chart
Question 3
Hello MM, GXY price has dropped continuously for a while but it looks like they have found the bottom. We have lots of GXY and wished we sold them when they were up, however we hung on because the future price prediction looked good.
Please advise:
- Do you have any opinion about GXY yourselves?
- Do you have any information as to why their price dropped so low?
Regards, Phil.
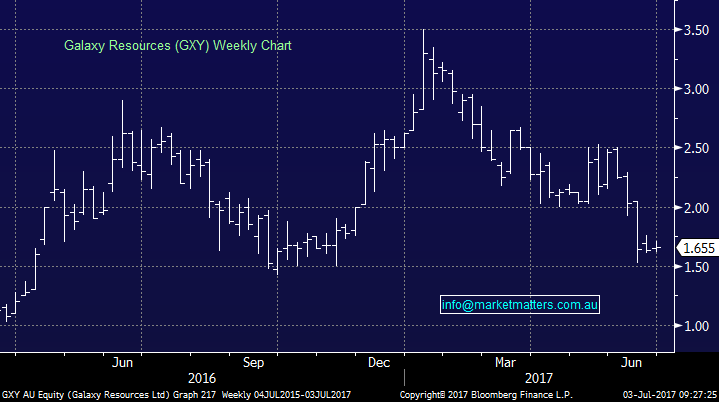
A Lithium play with a very good prospect however the market simply became too optimistic on them. At their peak around $3.50 GXY had a market capitalisation of ~$1.2b with the promise of monetising their assets but with very little actual earnings + a huge amount of expenditure needed to do it. Even now on a market cap of ~$650m this looks rich in our view, however the market generally remains positive on it. 7 Brokers cover it with 6 buys and 1 hold – consensus price target of $3.00. Technically, GXY can be bought here but with stops under $1.50 – however the downtrend is strong and this is a high risk play.
Galaxy Resources (GXY) Weekly Chart
Question 4
Dear MM,
Question hoping you can answer please.
If a person has money in the fixed interest option within a pension fund and is wanting to set themselves up financially for what they perceive to be a significant market correction is the fixed interest option likely to go down along with the rest if the share market or go the opposite way? Is it a safe place to be in a major market correction or would a person need to be in cash?
Love your work
Julie
Thanks Julie, the main difference with Fixed Income is that it has a maturity date at which time you receive the face value of the security back (all things going well) while equities are perpetual. Commenting on this in a general sense only, fixed income is lower risk than equities but higher risk than cash. In times of extreme market panic, cash is the only ‘true’ defensive asset. If you think about a fixed income product, it is a ‘promise’ to pay back your money at a set time in the future, and pay you interest along the way to compensate for 1. Time & 2 Risk. The higher the risk the more you should be paid. That said, fixed income is such a broad area. Government Bonds in our view will go down in price, pushing up yields, however corporate bonds that pay floating rates should remain reasonably well supported.
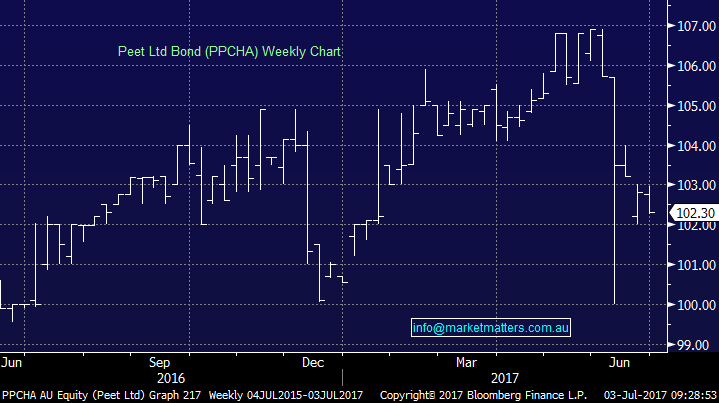
If we use a listed security as an example – being the PEET Bonds Series 1 which trades under the ASX code of PPCHA. This is trading at $102.30 and has a face value of $100 with a maturity on the 7th June 2021 paying a 7.50% fixed rate of interest. If purchased today at $102.30 you will lock in a capital loss of $2.30 given you only get the $100 face value back, however you also get the income on the way through. The Yield to Maturity based on this purchase price is 6.88% pa and this takes into consideration the capital loss. However, there would have been buyers of this bond at $106 and their return would obviously be lower – given they are locking in a higher capital loss over the life of the security. This is a higher risk bond however it highlights the metrics around fixed income. We’ll cover more of themes in the Market Matters Income Report which is being launched shortly.
Peet Bond (PPCHA) Weekly Chart
Overnight Market Matters Wrap
· The Dow and S&P 500 were improved on thin volumes, while the tech heavy Nasdaq closed slightly weaker.
· Oil price continued to recover from its recent lows of sub US$45/bbl, with the benchmark, Brent price rallying over 1% to just under US$48/bbl. as fears of oversupply eased. Iron ore firmed to US$64.95/t, while base metals were mixed.
· Both BHP and RIO will set the tone for a more positive resource sector today, while the Australian dollar continued to be well supported, rallying above 77c in US trading before closing at us76.88c.
· FXJ is expected to continue to be under pressure after falling 8% on Friday, now it appears any bidding war by private equity has ended with both TPG and Hellman and Friedman failing to lodge a bid.
· Data to watch for today includes ANZ jobs ads for June and Building approvals for May, while China's "official" PMI number over the weekend beat consensus expectations, recording a healthy 51.7.
· The Australian market looks set to open with little change and a quieter session from last Friday as indicated by the September SPI Futures and ahead of the US holiday tomorrow.
Disclosure
Market Matters may hold stocks mentioned in this report. Subscribers can view a full list of holdings on the website by clicking here. Positions are updated each Friday.
Disclaimer
All figures contained from sources believed to be accurate. Market Matters does not make any representation of warranty as to the accuracy of the figures and disclaims any liability resulting from any inaccuracy. Prices as at 03/07/2017. 8.00AM.
Reports and other documents published on this website and email (‘Reports’) are authored by Market Matters and the reports represent the views of Market Matters. The MarketMatters Report is based on technical analysis of companies, commodities and the market in general. Technical analysis focuses on interpreting charts and other data to determine what the market sentiment about a particular financial product is, or will be. Unlike fundamental analysis, it does not involve a detailed review of the company’s financial position.
The Reports contain general, as opposed to personal, advice. That means they are prepared for multiple distributions without consideration of your investment objectives, financial situation and needs (‘Personal Circumstances’). Accordingly, any advice given is not a recommendation that a particular course of action is suitable for you and the advice is therefore not to be acted on as investment advice. You must assess whether or not any advice is appropriate for your Personal Circumstances before making any investment decisions. You can either make this assessment yourself, or if you require a personal recommendation, you can seek the assistance of a financial advisor. Market Matters or its author(s) accepts no responsibility for any losses or damages resulting from decisions made from or because of information within this publication. Investing and trading in financial products are always risky, so you should do your own research before buying or selling a financial product.
The Reports are published by Market Matters in good faith based on the facts known to it at the time of their preparation and do not purport to contain all relevant information with respect to the financial products to which they relate. Although the Reports are based on information obtained from sources believed to be reliable, Market Matters does not make any representation or warranty that they are accurate, complete or up to date and Market Matters accepts no obligation to correct or update the information or opinions in the Reports.
If you rely on a Report, you do so at your own risk. Any projections are estimates only and may not be realised in the future. Except to the extent that liability under any law cannot be excluded, Market Matters disclaims liability for all loss or damage arising as a result of any opinion, advice, recommendation, representation or information expressly or impliedly published in or in relation to this report notwithstanding any error or omission including negligence.
To unsubscribe. Click Here


