Subscriber Questions (TLS, OZL, FMG, ERA, SFR, CPH)
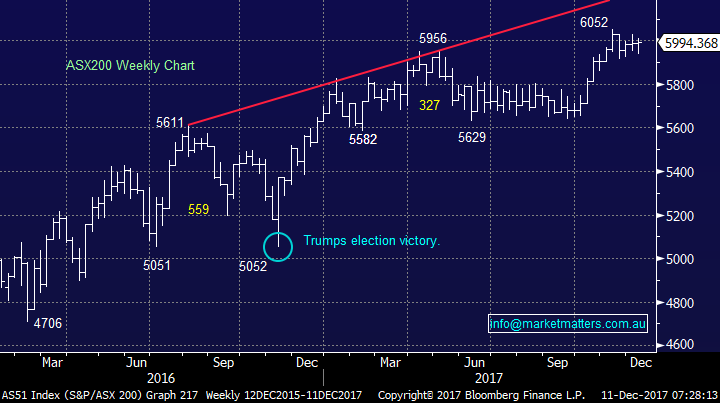
The ASX200 has now entered its seasonally strongest period of the year and this December we are only up 24-points to-date. Assuming we simply see an average December to end 2017 then the ASX200 should reach 6120 in the coming weeks i.e. a gain of +2.5% in December. US stocks look well positioned for further choppy gains into 2018 to complete an impressive multi-month rally with a 5-7% correction likely to follow.
- Our “Gut Feel” at MM is the ASX200 will say goodbye to 2017 around the 6150 level i.e. this would be an impressive +8.6% gain for the year.
This week we have again received an excellent group of questions and we’ve covered 8 in this morning’s report by combining 2 of them in a topical question 1.
ASX200 Weekly Chart
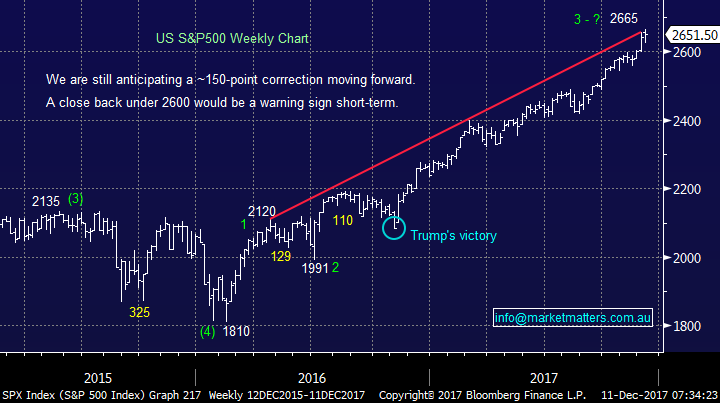
We still believe the US S&P500 is “looking for a top” but following a number of failed attempts on the downside further “choppy” strength into Christmas now feels likely. On balance if we were specifically looking at US stocks we would continue to increase our cash levels in anticipation of a reasonable correction.
US S&P500 Weekly Chart
Question 1
“The TLS dividend is now yielding approximately 6%, which may not be sustainable. Are there other ASX stocks yielding 5% or better, which are more likely to be sustained?” – John W.
“Hi MM, Please advise: Is there any chance that the Telstra Share price will improve in the next week or two? Otherwise I have no option other than getting out now before my losses increase further, so that I can put the funds to better use.” - Thanks Phil B.
Morning All,
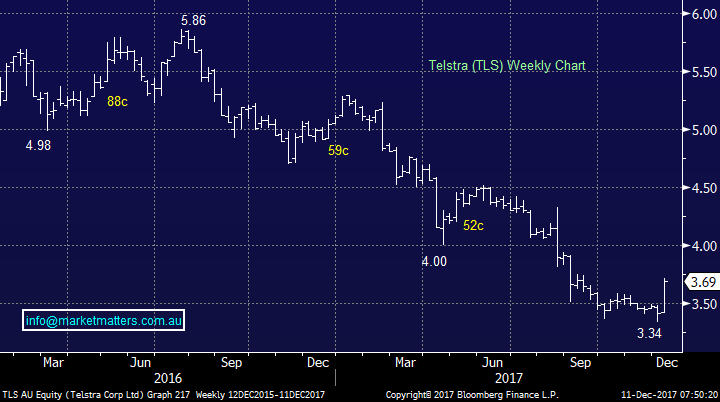
Telstra came back into favour with a bang last week rallying +11.4% from the previous weeks multi-month low. We took a relatively small profit on half of our holding last week as planned at $3.65. Our current thoughts moving forward are:
- Telstra (TLS) $3.69 – we plan to sell our second 5% holding for the MM Growth Portfolio ideally around $3.85 for a ~8% profit. We would again be buyers of TLS into fresh recent lows around $3.30, or below. We believe TLS will maintain its 22c fully franked dividend for at least 2-years but after this the NBN becomes the significant wild card. To give some context here, TLS is likely to have Earnings Per Share (EPS) around ~30c in FY18, ~31c in FY19 and ~26c in FY20. They have guided to 22cps dividend for FY18 so clearly some room to move on this.
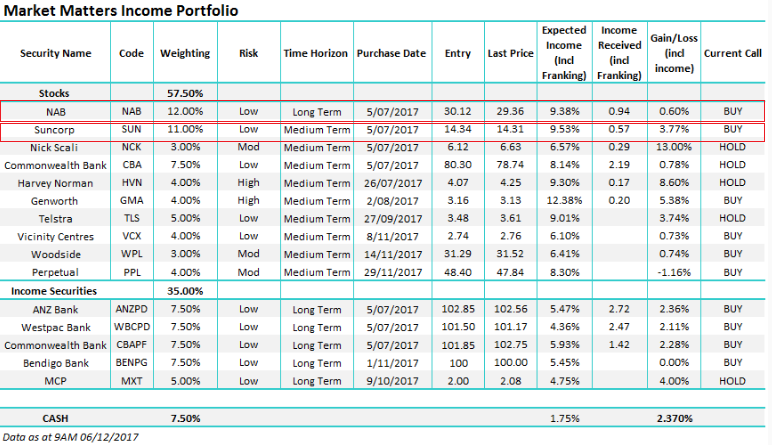
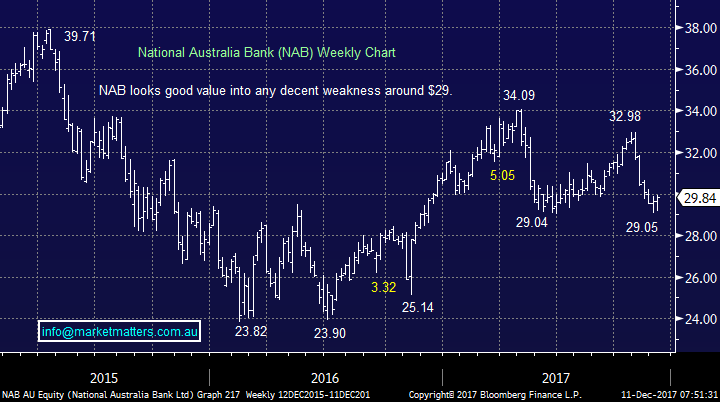
- Our Income Portfolio outlines stocks / hybrids we like for yield, with our two largest weightings being NAB and Suncorp – we continue to like both at current levels, particularly NAB given current seasonality at play.
Telstra (TLS) Weekly Chart
National Australia Bank (NAB) Weekly Chart
Question 2
“Good afternoon, does MM think OZL or FMG would be a better trade based on current prices?” – Regards Michael S.
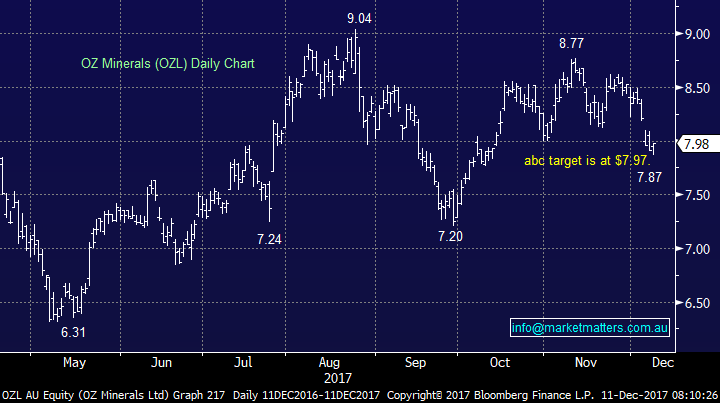
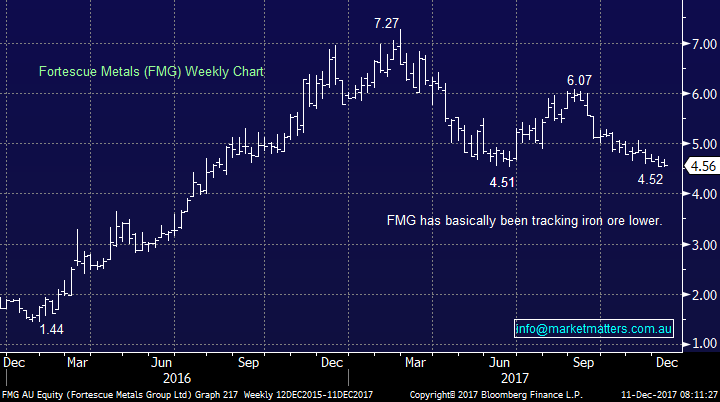
Morning Michael, an excellent question especially as we are long both stocks basically at Fridays closing price. The 2 stocks have endured healthy corrections from their highs of the year but FMG has clearly been the weakest i.e. OZL -11.7% and FMG -37.2%.
Over recent months we have been fans of base metal stocks ahead of iron ore but considering the degree of the correction in FMG compared to OZL we are now evenly balanced. Hence I’m afraid our answer Michael is we have no preference, we like OZL and FMG equally.
OZ Minerals (OZL) Daily Chart
Fortescue Metals (FMG) Weekly Chart
Question 3
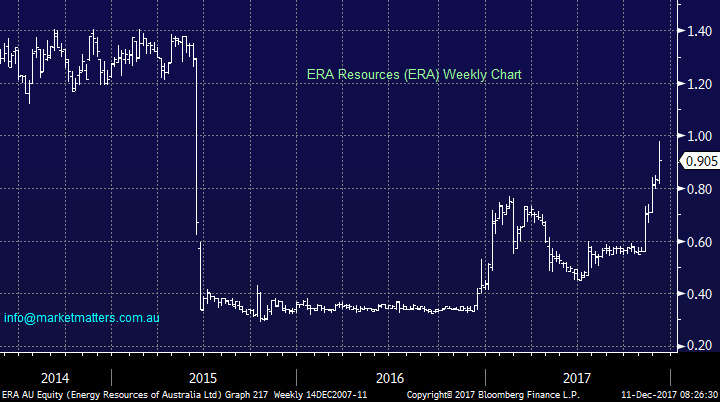
“Hi MM, May I ask if you’ve had a look at ERA recently? There’s little in terms of fundamental data available through their company announcements, but the technical aspects look interesting for both U308 and ERA’s share price. Significant resistance appears to be around the $1.00 level (Fib, 2013 and then this week’s price action), however with the U308 price potentially bottoming and on the improvement, if the 75c level holds there may be some gains to be had. If you have some time, may I ask for your thoughts please? If not, completely understand and have a good weekend.” – Ben H.
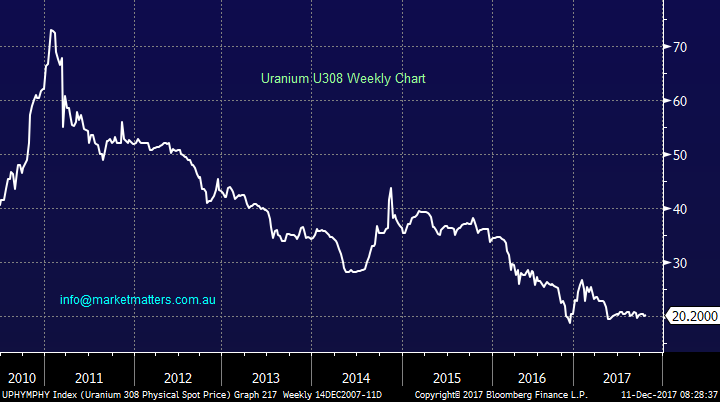
Morning Ben, you certainly like to cast your net wide, uranium stocks have been vehicles for wealth destruction since the Fukushima Daiichi nuclear disaster in March 2011.
We cannot see anything exciting in the uranium chart, the downtrend remains intact. However, the ERA chart is clearly gaining some strength, technically we could be buyers around 90c with stops under 73c – not very exciting risk / reward I’m afraid.
ERA Resources (ERA) Weekly Chart
Uranium U308 Spot Price Weekly Chart
Question 4
“Thanks for the latest income report. Please explain/comment/provide information to enable us to decide on whether income securities are suitable.” - Thanks Ian M..
Thanks Ian, we’re enjoying some good feedback on the Income Report – something we certainly appreciate from subscribers. In terms of your question, it provides us an opportunity to highlight what Market Matters is, and what it’s not. At MM we simply publish two portfolios of stocks / hybrids that we think represent the best opportunities, considering risk versus potential reward to meet the portfolios particular objectives. The primary objective of the Market Matters Growth Portfolio is to provide a level of capital appreciation over the medium to long term with some income return. The primary objective of the Market Matters Income Portfolio is to provide a regular and sustainable stream of dividends, from a combination of high yielding equities and ASX listed debt and preference securities over the medium term (3 years), while conserving capital. Whether or not Income Securities are relevant for you requires further discussion and most likely some level of personal advice – which MM does not offer, although we are obviously closely aligned with James at Shaw and Partners who can offer this level of service.
In terms of the MM Income Portfolio outlined above, we believe in the blended portfolio approach which provides a strong yield with reduced volatility that the underlying equity market. As of Wednesday, the Income Portfolio is expected to yield ~7% grossed for franking – which is attractive to us in such a low interest rate environment.
Question 5
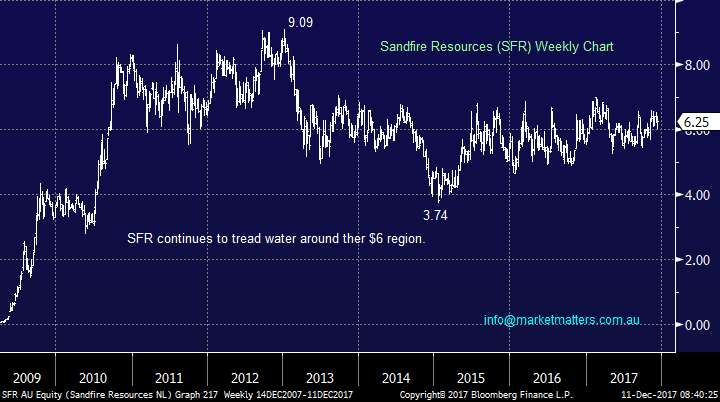
“Hello, Can you please give me some guidance on Sandfire Recourses SFR. I understand copper is down today however they look good to me under $6.00.” – Best regards Wayne S.
Hi Wayne, we prefer OZ Minerals (OZL) for exposure to copper mainly because SFR has struggled to rally away from the $6 area for the last 5-years, even when copper has advanced over 50% - it’s actually been a more conservative play in both directions.
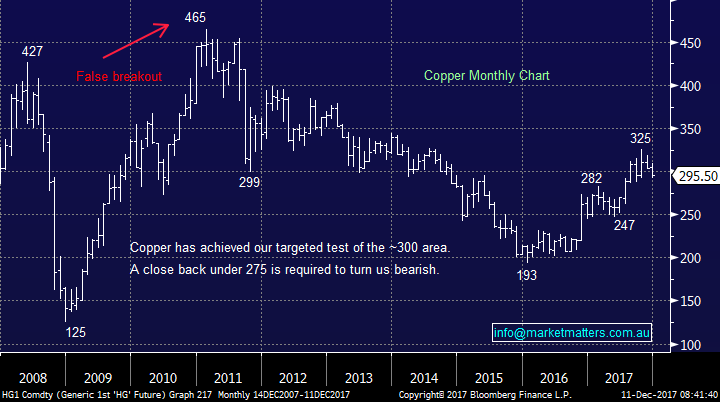
We could buy SFR under $6 but would use the copper price as a stop. If copper breaks back under $US275/lb, ~7% lower, we would not want exposure to the base metal.
Sandfire Resources (SFR) Weekly Chart
Copper Monthly Chart
Question 6
“Guys, how come high PE stocks would be falling when the ten year bond rate has fallen from 2.8% to 2.58% in the last month” - Peter S.
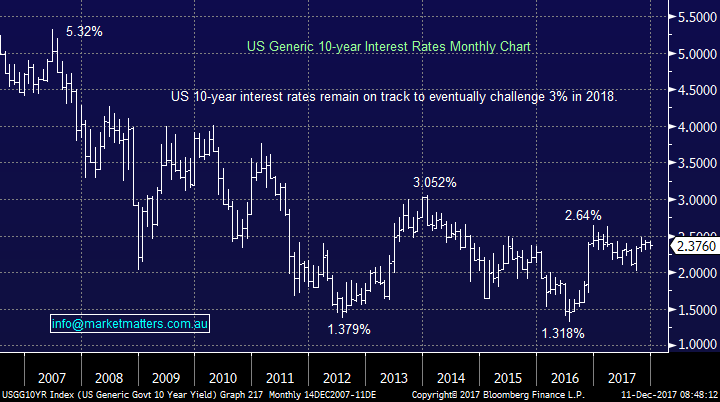
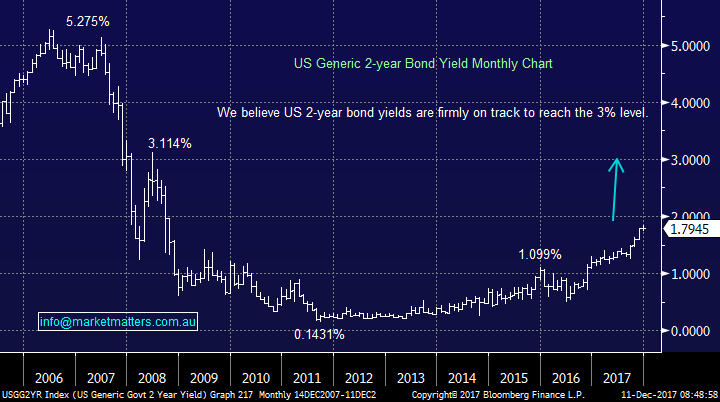
Morning Peter, we believe you need to look at the US bond yields more than our local ones, and focus on the recent movements in shorter dated yields. While our local bond yields have drifted lower the US 10-years have held firm while their 2-years have powered higher. We believe investors are pre-empting a pick-up in inflation and hence 10-year bond yields will track higher over tine, which is clearly not an ideal environment for high PE stocks.
Obviously there always exists the possibility that fund managers are getting it wrong and inflation will remain subdued and long term rates will not pick up but as we have been pushing for most of 2017at MM believe the multi-year bear market for interest rates is over.
US 10-year bond yield Monthly Chart
US 2-year bond yield Monthly Chart
Question 7
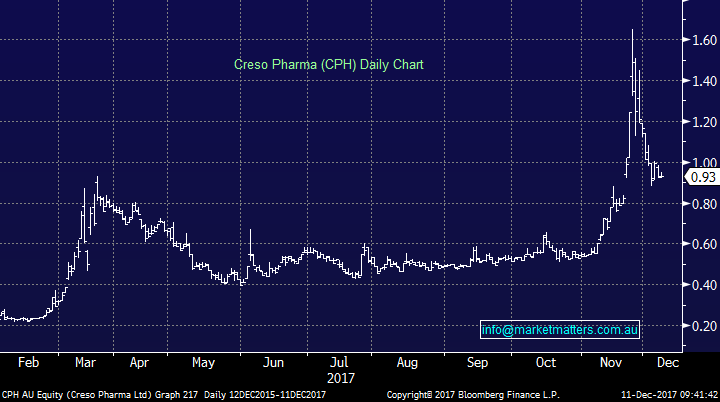
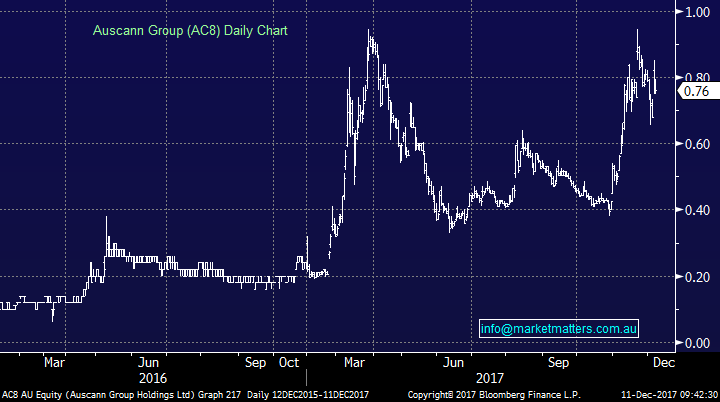
"Hi, new offer for CPH at $1.10 – should I participate? AC8 losing value – what are your thoughts on that stock, are they raising capital too?” - Kind regards Paul H.
For those not across these stocks, CPH is a cannabis stock that rallied from ~20c to ~$1.60, completed an institutional placement for $15.5m at $1.10 and are now trying to complete a Share Purchase Plan (SPP) at the same price to raise a minimum of $2m. A portion of the placement does need to be ratified at the AGM which is today, however the company did very well raising money at $1.10 given the share price now sits at 93cps – it seems to us that the underwriters of the SPP will end up with a lot of the stock earmarked for that part of the raise i.e. makes little sense paying $1.10 versus current market price of 93c.
An obvious observation is that any company on the ASX that is not making money, is cum raise , however AC8 (which is also a ‘pot stock’) did have around $15m cash as at June 30.
Both are very speculative and highly volatile, and won’t appear in the MM Portfolios any time soon.
Cresco Pharma (CPH) Daily Chart
Auscann Group (AC8) Daily Chart
Overnight Market Matters Wrap
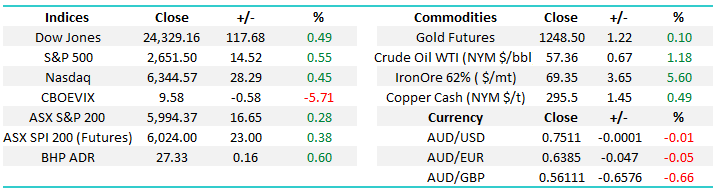
· The US equity markets closed higher last Friday – a better overall jobs number was a plus however wages growth still sluggish. The FOMC meets this week with the 3rd hike of 2017 a ‘done deal’ according to Futures Markets.
· Iron Ore rallied 5.6% with BHP expected to outperform the broader market today after ending its US session up an equivalent of 0.58% to $27.33 from Australia’s previous close.
· The December SPI Futures is indicating the ASX 200 to open 26 points higher towards the 6020 area this morning.
Disclosure
Market Matters may hold stocks mentioned in this report. Subscribers can view a full list of holdings on the website by clicking here. Positions are updated each Friday, or after the session when positions are traded.
Disclaimer
All figures contained from sources believed to be accurate. Market Matters does not make any representation of warranty as to the accuracy of the figures and disclaims any liability resulting from any inaccuracy. Prices as at 11/12/2017. 8.00AM.
Reports and other documents published on this website and email (‘Reports’) are authored by Market Matters and the reports represent the views of Market Matters. The MarketMatters Report is based on technical analysis of companies, commodities and the market in general. Technical analysis focuses on interpreting charts and other data to determine what the market sentiment about a particular financial product is, or will be. Unlike fundamental analysis, it does not involve a detailed review of the company’s financial position.
The Reports contain general, as opposed to personal, advice. That means they are prepared for multiple distributions without consideration of your investment objectives, financial situation and needs (‘Personal Circumstances’). Accordingly, any advice given is not a recommendation that a particular course of action is suitable for you and the advice is therefore not to be acted on as investment advice. You must assess whether or not any advice is appropriate for your Personal Circumstances before making any investment decisions. You can either make this assessment yourself, or if you require a personal recommendation, you can seek the assistance of a financial advisor. Market Matters or its author(s) accepts no responsibility for any losses or damages resulting from decisions made from or because of information within this publication. Investing and trading in financial products are always risky, so you should do your own research before buying or selling a financial product.
The Reports are published by Market Matters in good faith based on the facts known to it at the time of their preparation and do not purport to contain all relevant information with respect to the financial products to which they relate. Although the Reports are based on information obtained from sources believed to be reliable, Market Matters does not make any representation or warranty that they are accurate, complete or up to date and Market Matters accepts no obligation to correct or update the information or opinions in the Reports.
If you rely on a Report, you do so at your own risk. Any projections are estimates only and may not be realised in the future. Except to the extent that liability under any law cannot be excluded, Market Matters disclaims liability for all loss or damage arising as a result of any opinion, advice, recommendation, representation or information expressly or impliedly published in or in relation to this report notwithstanding any error or omission including negligence.
To unsubscribe. Click Here


