Subscriber Questions (RFG, NAN, ALL, BPT, ORG)
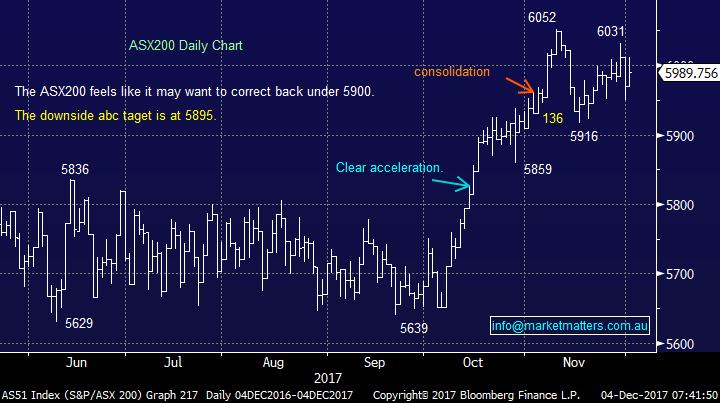
The ASX200 had another fairly quiet week from an index perspective but we’ve seen volatility steadily rising day to day on the index level plus in places from a stock / sector perspective. With seasonally strong December upon us it will be interesting to see if / when any Christmas / window dressing rally unfolds considering the solid year stocks have enjoyed. Our best “guess” at this stage is stocks will rally in a choppy way this month before enduring a decent pullback in early 2018.
- Our “Gut Feel” at MM is the ASX200 will say goodbye to 2017 around the 6150 level i.e. this would be an impressive +8.6% gain for the year.
- Note the average December gain for the ASX20 since the GFC is ~2.5% which targets the 6100 area.
This week we have received an interesting group of questions and a number of comments around alerts this week – which we will address below.
ASX200 Daily Chart
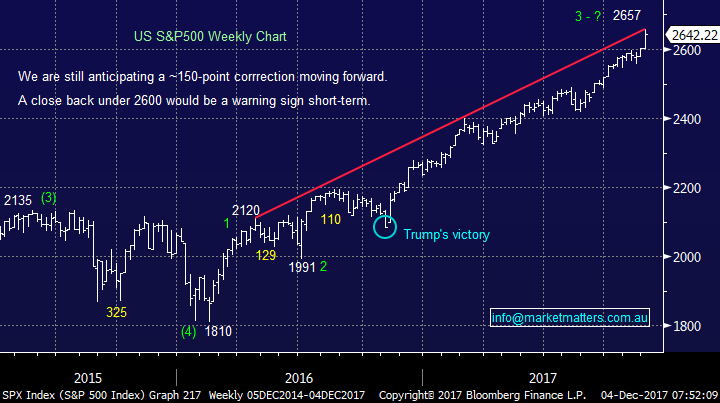
We still believe the US S&P500 is “looking for a top” but following a number of failed attempts on the downside further “choppy” strength into Christmas now feels likely. On balance if we were specifically looking at US stocks we would continue to increase our cash levels in anticipation of a reasonable correction.
US S&P500 Weekly Chart
Comments this week
We received a number of comments this week about alerts, specifically around the alert that went out for Nanosonics. First and foremost, we pride ourselves on being transparent and timely in our approach, we’re real markets guys / girls and we trade and discuss a real portfolio of stocks, not a theoretical one as many of our competitors do. We take what we do very seriously and are always open to comments made by subscribers if the desired outcome is to improve our offering.
In the case of the NAN alert, here is the flow of events;
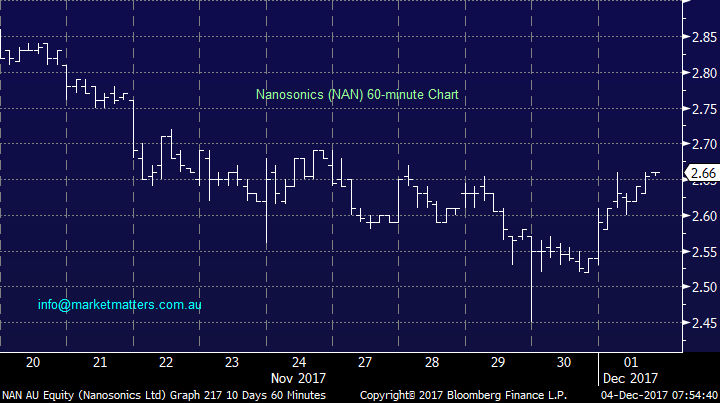
· We sent an alert out saying we are in the marketing SELLING NAN – the text alert suggested that we are sellers, and to refer to the email for more detail. The email outlined our sell level around $2.60.
· NAN quickly dropped to $2.45, so we held - the underlying ASX200 getting smacked ~60-points that morning didn’t help.
· NAN then rallied back and touched a post alert high of $2.57, a price that represented a ~1% discount to the price of the alert (around $2.60). Within our alerts, we typically use the phrase of ‘around’ and for clarity, to our thinking this means a price within say 1% of the desired level, however we appreciate each subscribers view may be different, and that is the beauty of the MM service, we simply advise what we are doing and subscribers can make their own mind up.
· We didn’t sell at $2.57, simply because very limited volume was done at that price – here is the course of sales showing just 1865 shares traded at $2.57 post alert.
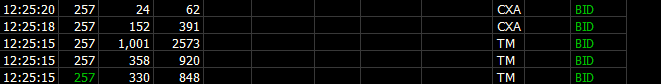
Source; IRESS
· The stock closed that day at $2.54
· In the afternoon report we advised, we did not sell NAN today, given it traded below our sell level. We will continue to monitor and update this alert.
· The following morning, the report stated; Nanosonics (NAN) $2.54 – As planned we attempted to sell NAN around $2.60, the stock plunged with the market down to $2.45 in a flash. As mentioned in yesterday’s pm report we did not sell NAN but still intend to be sellers, however we are amending our level to be around $2.70 if the opportunity arises today.
· The stock closed that day at $2.66
· We then wrote about the position again on the weekend report and we are now sellers ‘Around $2.70’
While we appreciate the frustration and are sincerely sorry that the alerts may have caused some confusion for some, and we will certainly take comments on board, markets are dynamic and these things can / and will likely happen. That said we are actively looking for better, more timely ways to keep subscribers informed, particularly as the number of subscribers grow.
If you have any issues immediately following our alerts moving forward simply drop us an email.
Nanosonics (NAN) 60-mins Chart
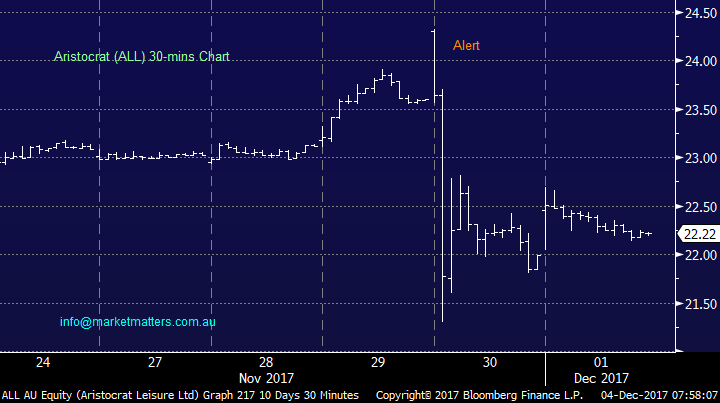
We also had some comments RE Aristocrat (ALL), and the chart below showes how quickly the stock dropped below our sell level.
Aristocrat (ALL) 30-mins Chart
Question 1
“Hi MM Team, I’m wondering if I could get your thoughts on Beach Energy Ltd? Just wondering what targets/levels you see for this stock (both Short Term & Long Term) and also if it is one that may come into the discussion along with ORG, STO, WPL, etc. when looking at energy stocks down the track (given both its recent purchase of Lattice Energy as well as your bullish outlook for Oil targeting around $US70/barrel)?” - Thanks, Leigh P.
Morning Leigh, a very topical question with crude oil trading close to the big psychological $US60/barrel area.
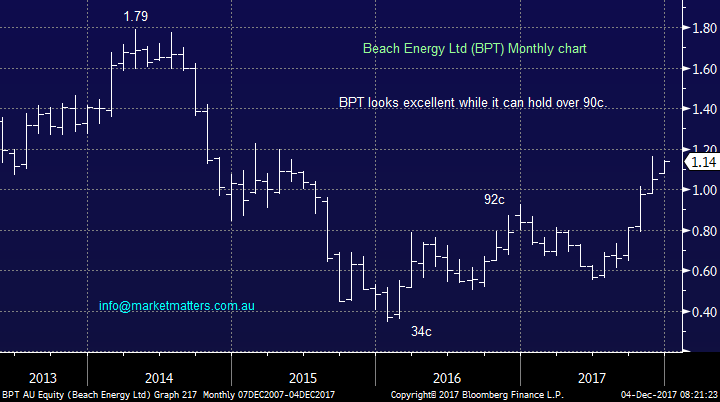
Beach Energy (BPT) looks great technically and as you said has recently purchased Lattice Energy for $US1.25bn which we like very much as an asset / strategic acquisition – hence we are likely to cover BPT more often moving forward.
- We are bullish BPT technically targeting the $1.50 area assuming 90c holds.
- Short-term some consolidation in the $1.10-$1.20 area looks likely.
Beach Energy (BPT) Monthly Chart
Question 2
“Hi There, For your Monday questions I would just like your thoughts on where Origin Energy (ORG) is tracking?” - Thanks, Peter L.
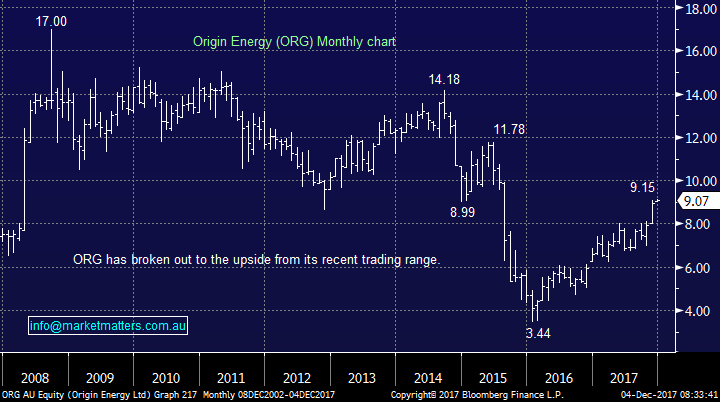
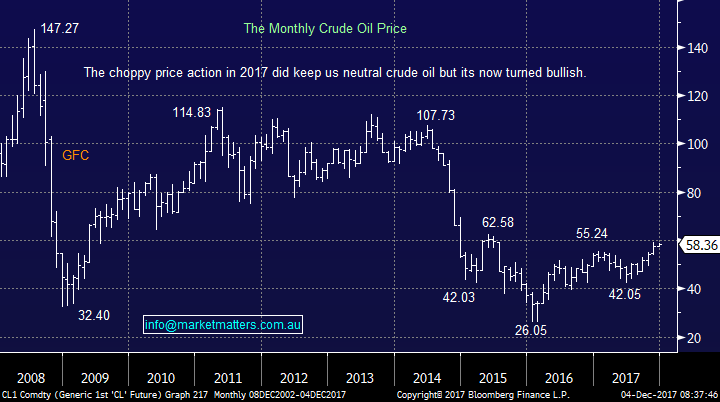
Morning Peter, another question on an energy stock which makes plenty of sense considering crude oils underlying strength. On Friday crude closed above $US58/barrel and at this point in time we remain bullish targeting the ~US70/barrel area.
ORG looks very strong technically assuming it can hold above $8 with a potential target of ~$11.50.
Origin Energy (ORG) Monthly Chart
Crude Oil Monthly Chart
Question 3
“Hi James/Team, Regarding shorted stocks, do you have a view on Retail Food Group (RFG)? Trust you found my summary of the Blue Sky Event in Brisbane interesting. The Harvard professor's view re the bull markets fragility mirrors your own.” - Cheers, Jeff C.
Morning Jeff,
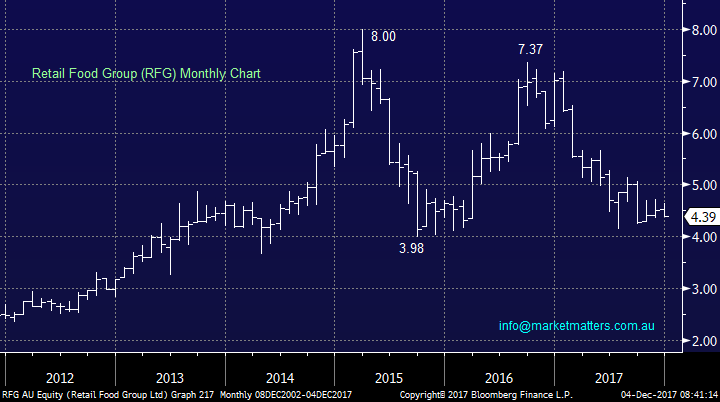
RFG is indeed a heavily shorted stock coming number 6 with ~12% of its stock sold short. A company that manages donut stores and cafes does not excite us as we see the worlds move away from sugar gaining momentum. We see no reason to buy RFG at current levels even though its testing its multi-month $4 low, and think there is a high chance the stock will trade below the previous $3.98 low – another 10% drop.
Retail Food Group (RFG) Monthly Chart
Question 4
“James the Elliott wave count is topping out with 4 fractuals in 5th waves ..the largest being a super cycle top which suggests a large correction, also trend lines from way back are in play at the moment with a poke above, my question is what is the best way to short this thing if correct, how about option position ,,The other one is 30 yr US T bond at around 154...what would be the way to short it? Once again maybe an option contract ..hoping you can help.” - Regards Hedley M.
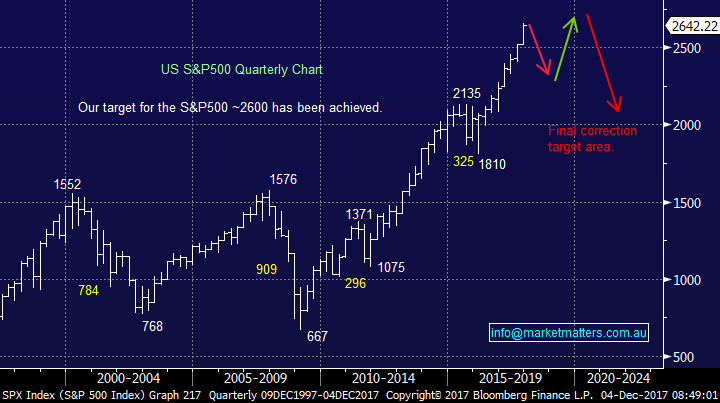
Morning Hedley, I have illustrated how we expect to see US stocks unfold into 2018. As can be seen from the previous 3-4 main tops since 2000 they can take 6-12 months to evolve i.e. investors optimism generally holds on for longer than pessimism with bottoms lasting less than 1-2 months.
Hence if you buy a bunch of puts looking for the market to fall they can easily expire worthless potentially just before the downturn occurs. We would suggest investigating negative facing ETF’s and we intend to cover these in coming weeks. Please note Short selling is for the sophisticated investor.
Alternatively you can follow one path MM will probably take i.e. moving ~50% of our Growth Portfolio into cash looking to buy weakness plus potentially also combined with a negative facing ETF, like the Betashares BEAR.
US S&P500 Quarterly Chart
Overnight Market Matters Wrap
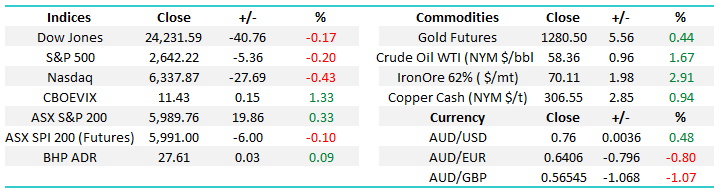
· The US equity markets recovered a large chunk of their early losses when it appeared the senate supported the new tax measures, helping the S&P 500 close only 0.2% weaker. Growing tensions on the Korean Peninsula coupled with expectations of potential further revelations from the FBI investigations, are likely to continue to act as a counter balance to the tax boost this week.
· The Australian resource sector however, should be buoyed this morning by a strong weekend for most key industrial commodities, notably iron ore rallying 2.91% to US$70.11/t. Oil also had a solid weekend in the wake of OPEC’s decision to extend production cuts well into 2018, with benchmark Brent up nearly 2% at US$63.7/bbl. Both BHP and RIO traded 1% firmer in US trading while the A$ is hovering above US76c.
· The December SPI Futures is indicating the ASX 200 remaining to the psychological resistance level of 6000 this morning.
Disclosure
Market Matters may hold stocks mentioned in this report. Subscribers can view a full list of holdings on the website by clicking here. Positions are updated each Friday, or after the session when positions are traded.
Disclaimer
All figures contained from sources believed to be accurate. Market Matters does not make any representation of warranty as to the accuracy of the figures and disclaims any liability resulting from any inaccuracy. Prices as at 04/12/2017. 8.00AM.
Reports and other documents published on this website and email (‘Reports’) are authored by Market Matters and the reports represent the views of Market Matters. The MarketMatters Report is based on technical analysis of companies, commodities and the market in general. Technical analysis focuses on interpreting charts and other data to determine what the market sentiment about a particular financial product is, or will be. Unlike fundamental analysis, it does not involve a detailed review of the company’s financial position.
The Reports contain general, as opposed to personal, advice. That means they are prepared for multiple distributions without consideration of your investment objectives, financial situation and needs (‘Personal Circumstances’). Accordingly, any advice given is not a recommendation that a particular course of action is suitable for you and the advice is therefore not to be acted on as investment advice. You must assess whether or not any advice is appropriate for your Personal Circumstances before making any investment decisions. You can either make this assessment yourself, or if you require a personal recommendation, you can seek the assistance of a financial advisor. Market Matters or its author(s) accepts no responsibility for any losses or damages resulting from decisions made from or because of information within this publication. Investing and trading in financial products are always risky, so you should do your own research before buying or selling a financial product.
The Reports are published by Market Matters in good faith based on the facts known to it at the time of their preparation and do not purport to contain all relevant information with respect to the financial products to which they relate. Although the Reports are based on information obtained from sources believed to be reliable, Market Matters does not make any representation or warranty that they are accurate, complete or up to date and Market Matters accepts no obligation to correct or update the information or opinions in the Reports.
If you rely on a Report, you do so at your own risk. Any projections are estimates only and may not be realised in the future. Except to the extent that liability under any law cannot be excluded, Market Matters disclaims liability for all loss or damage arising as a result of any opinion, advice, recommendation, representation or information expressly or impliedly published in or in relation to this report notwithstanding any error or omission including negligence.
To unsubscribe. Click Here


