Subscriber Questions (ORE, FMG,. IFL, Z1P)
Following two strong sessions overseas the ASX200 should open 15-20 points higher this morning, with BHP looking to be up by ~2%. We are becoming increasingly concerned that the US stock market is rallying with classic “Fear of missing out” (FOMO) characteristics, historically this usually foreshadows trouble ahead in the form of a decent pullback for stocks.
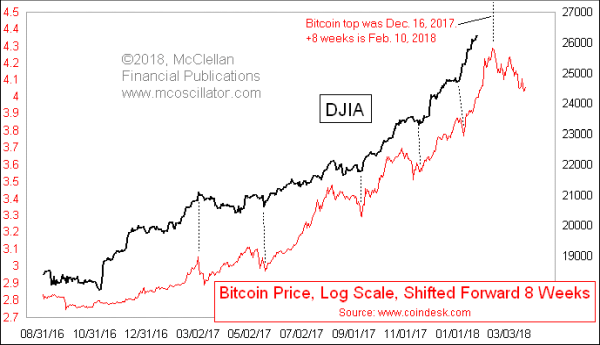
The US S&P500 is enjoying its longest run in history without a 5% correction, from a risk / reward perspective we cannot be buyers until we see such a pullback. We saw a fascinating chart on a highly respected US website over the weekend showing the correlation of the Dow against Bitcoin over the last 2-years, it’s both interesting and another potential reason for caution towards stocks. Since mid-2016 the euphoric rally in Bitcoin has led the Dow by ~8-weeks, if this is correct trouble is looming on the horizon for US stocks in mid-February.
US S&P500 Weekly Chart versus Bitcoin
Time will tell but it certainly would not surprise us at MM as we believe the $US is currently the key for most global markets and that looks very close to a major turning point in our view. – refer to yesterday’s Weekend Report.
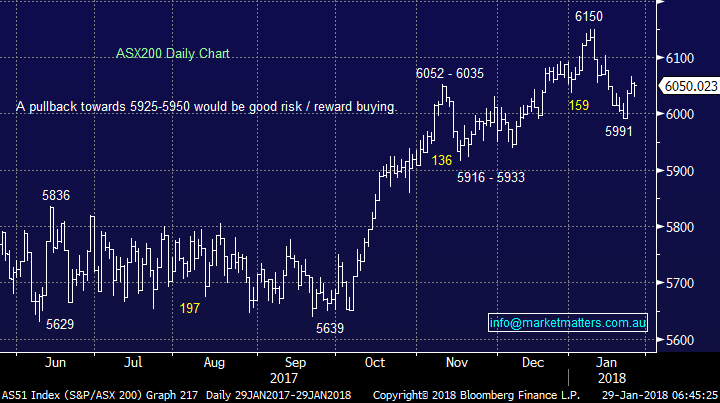
- Our “Gut Feel” at MM is still the ASX200 will reach the 5925-5950 support area in the next few weeks.
ASX200 Daily Chart
This week we have again received an excellent group of questions and we’ve covered 7 in this morning’s report.
Question 1
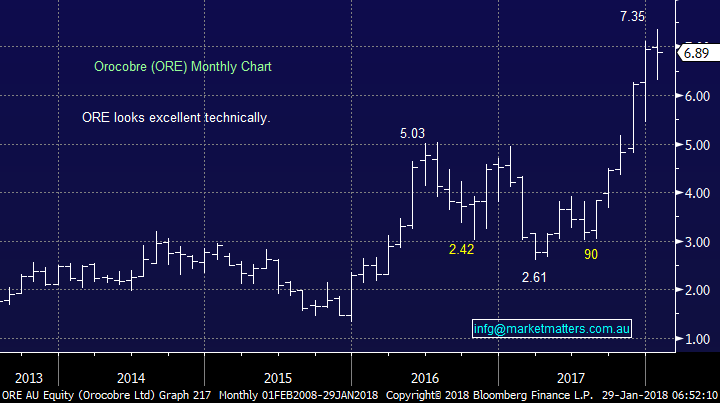
“Hi James, Having bought ORE at $6.38 along with MM, I was wondering what your thoughts are on the rights issue? How will it affect price? Friday 19th was the record date however we may not be eligible not being on the register on that date. What is MM position? P.S. thanks for an excellent newsletter“ – Thanks Rob.
Morning Rob, you are correct we are not eligible for the rights issue but it is the very same issue which caused the short-term weakness in the stock which enabled us to buy around 13% below the months high i.e. the rights issue was at $6.55, a 8.6% discount to the last price at the time while they also announced the investment from Toyota at $7.50 which was obviously at a premium.
MM is long at $6.34 which is currently showing a healthy quick 8.68% paper profit. We are bullish the stock longer term but can see a trading range of $6.50-$7.50 while the issue is digested i.e. a similar ~4-month consolidation as we saw in mid-2017 hence we will consider taking profit into fresh highs if they occur this year.
P.S. Thanks for the thumbs up!
Orocobre (ORE) Monthly Chart
Question 2
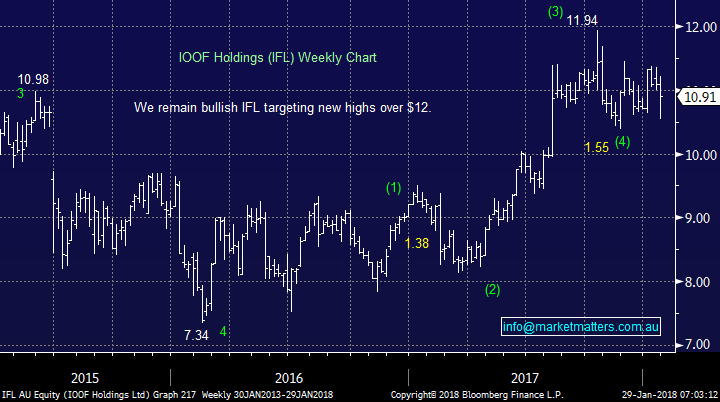
“Good Afternoon MM Team, Could you give your assessment of the prospects for IOOF (IFL) over the next few months? I notice it has had a pullback lately in the face of two days of recovery in the ASX200.” – Thanks John.
Hi John, IFL is oscillating around because of 2 very different broker interpretations of its recent major purchase of ANZ Wealth for $975m. Bells believes it will take a number of years for IFL to reap the benefit while Morgan Stanley is calling the upgrade cycle to begin shortly as the company successfully executes its acquisition.
We agree with MS believing IFL to be excellent value at current levels with a target of $12.25-$12.50.
IOOF Holdings (IFL) Weekly Chart
Question 3
“ Hi Guys, I haven't got the text today? i.e. 24th January” – Regards Sam
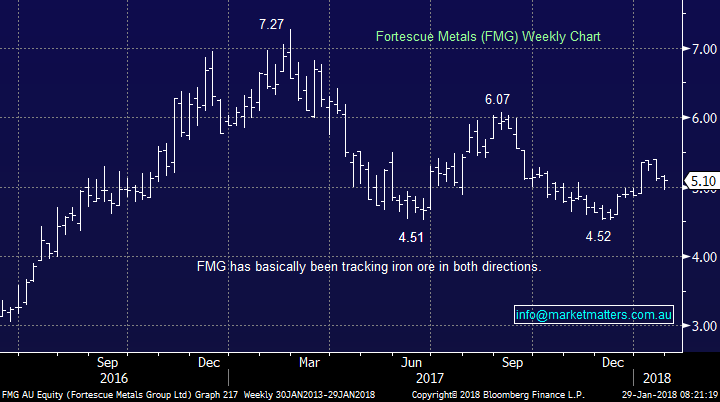
Hi Sam, you are correct, on the 24th we bought Fortescue Metals (FMG) for the Income Portfolio at $4.99 – FMG’s estimated yield for 2018 is 6.35% fully franked.
We send out Text Alerts for the Growth Portfolio only, along with email alerts for both the Income and Growth Portfolio’s. Simply the Income Portfolio being a less active, theoretically more conservative portfolio, minute by minute timing is not such an important requirement and therefore we believe that SMS alerts are not required.
Fortescue Metals (FMG) Weekly Chart
Question 4
“Hi Thanks for continuous insights. May I know your opinion on following 4 stocks? Any suggestions, on entry/exit prices, SVW, EHL, ACK, PLS. Further if you had to pick few stocks for the long term where would you put your money? Finally, global LIC’s are starting to become a thing, any comments on MOGL and upcoming WAM global fund.” – Regards Lakshan.
Morning Lakshan, thank for the question but as it’s very large in nature please excuse the brevity of our answer in places.
4 stocks in question
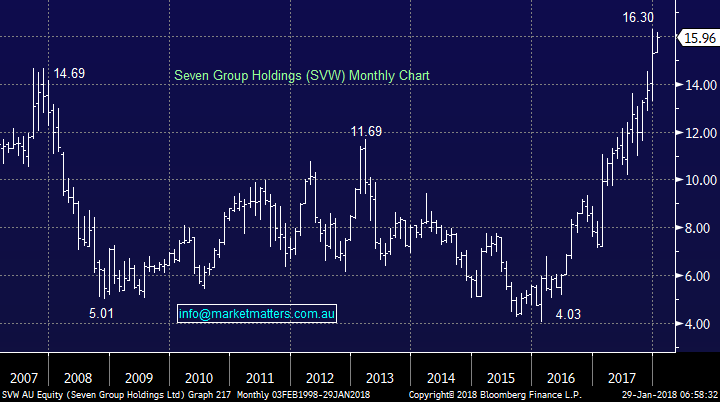
SVW – SVW currently looks strong but from a risk / reward position we would be looking for another $1.50 pullback as a buying opportunity. Looking at last week’s result from Caterpillar in the US, the number was very strong with a big forward order book, upbeat commentary etc, however the stock was up only +0.6%. We use CAT as a global barometer of economic activity – future mining production given it sells earthmoving equipment, and despite the strong result, there was a void of new buyers. Suggests to us that this trade is a crowded one and pullbacks will now become more common
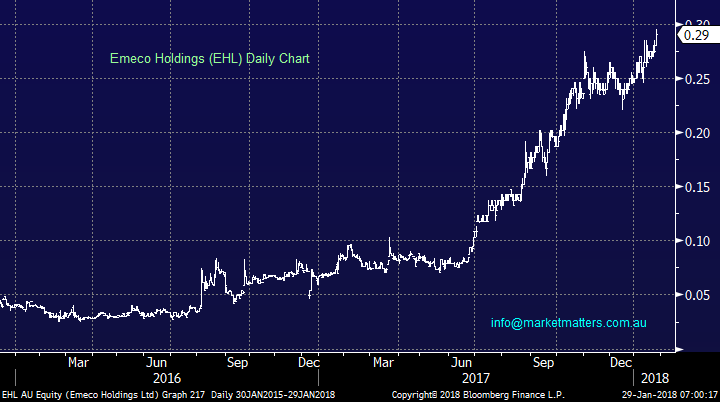
EHL – not a stock we follow but technically we could be buyers around 23c with stops under 14c – not attractive risk / reward. The guys at WAM like this stock and think it has a lot further to go.
ACK – Another stock we do not follow closely but at this stage we would be looking to buy any correction back towards $1.30. Liquidity an issue
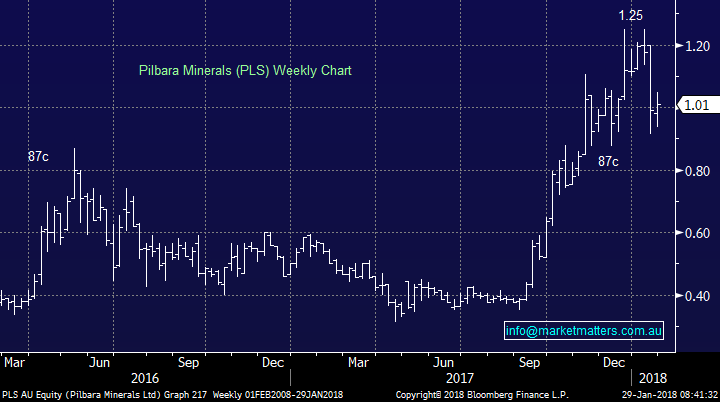
PLS – We still like PLS and would be buyers in the 88-90c region.
A few stocks for the long term is very hard because we use a fluid and flexible approach – remember many stock market cycle’s only last 2 and 4-years. Our favourite holding that we currently see ourselves regularly being long during the next few years is Orocobre (ORE).
LIC’s clearly have their place but just like a company an investor must do their research before purchasing. We hold one LIC in the Income Portfolio (ALF) and this is trading below its asset backing (NTA). Another interesting LIC trading below NTA is CYA – which is now managed by WAM. In short, paying a premium to NTA for an LIC makes little sense in my mind, however getting them at a discount as long as there is a catalyst for that discount to dissolve does make sense in certain situations.
The short answer is, we’re more comfortable following our own analysis / decision making process, however that may include LIC’s when obvious value emerges.
Seven Group (SVW) Monthly Chart
Emeco Holdings (EHL) Daily Chart
Pilbara Minerals (PLS) Weekly Chart
Question 5
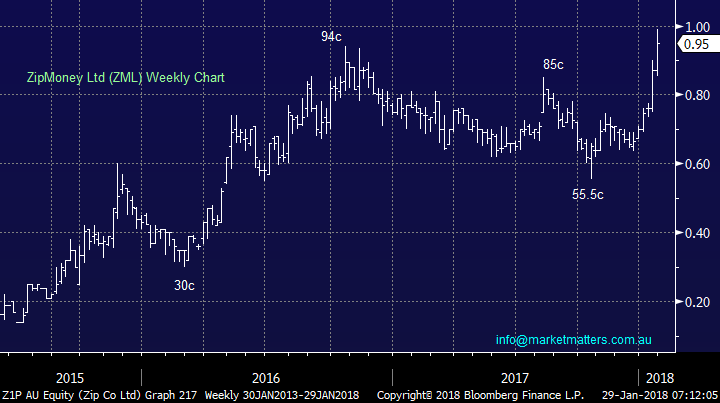
“Hi Guys, I was fortunate to buy Z1P last week at 0.855 and now the price is up to 0.975. Any ideas for an exit strategy would be appreciated.” - Thankyou Alex.
Congratulations Alex, we were too fussy and simply liquidity was an issue for us! We would expect a few months consolidation following this explosive breakout, similar to the end of 2017. Some large line of stock were crossed last week and this is presumably one large holding taking profit while another large holder starts to accumulate stock. This is typical of a stock getting on the radar of more investors. In short, we are still trying to buy Z1P but now as a “trade” between 86 and 88c. We will send a revised alert should the stock fall back into that range.
Over the next 3-5 months we still see Z1P well over $1.
ZipMoney (Z1P) Weekly Chart
Question 6
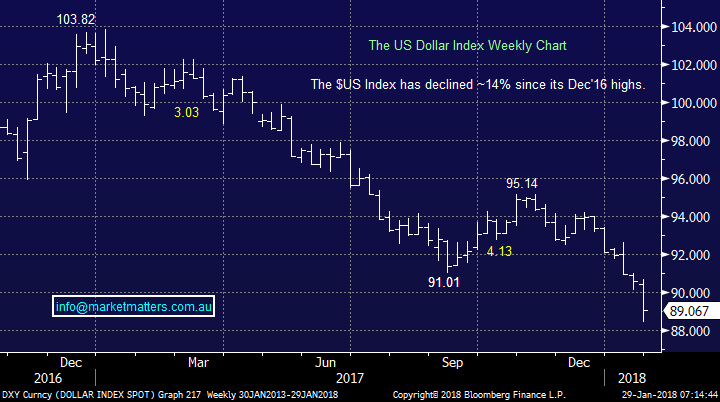
“Good Morning James. Recently, US$ keep dropping which push Aussie Dollar up. As your prediction in your previous article, US$ will go up due to its interest rate up. However, currently US$ is just against your prediction. Is it possible the Trump government's "America First" Policy which US Government push US$ depreciation so it will stimulate its export and economy? Also if US$'s depreciation will certainly push commodities and oil price up? Lastly, what is your view for US dollar trend in 2018?” Thanks Michael.
Morning Michael, if you read our 2018 Outlook Piece closely you will note our $US forecast for the year was in 2 parts – CLICK HERE TO REVIEW OUR 2018 OUTLOOK
- MM expects the $US Index to fall to around the 88 area in early 2018 – smack on so far!
- MM expects the $US will form a major bottom in Q1 and rally at least 10% in 2018 – time will tell.
Our Weekend Report covers this in more detail but from around here we are definitely looking for a $US low.
The $US Index Weekly Chart
Question 7
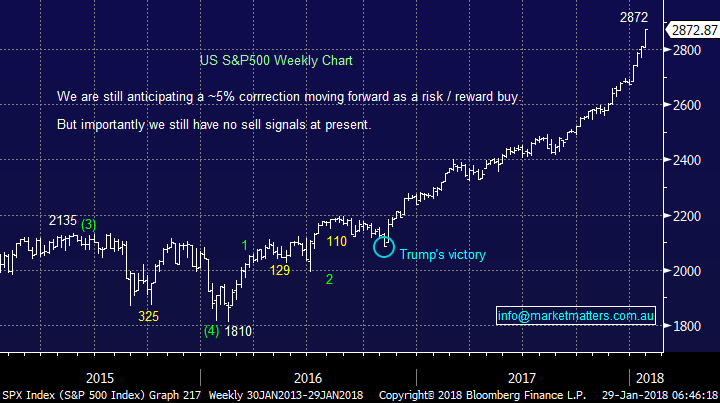
“I have been following this comment in the morning report for a few weeks with no change "US Stocks. The S&P500 has continued its record breaking advance and with no sell signals at present investors should be long, or out. " So have invested in GGUS rather than IVV chasing leverage which is looking good so far Note your proposal to invest in US dollars when you judge the low point. Would you also consider YANK for the leverage?” – Thanks Lester D.
Morning Lester,
Your clearly getting amongst our views which is great to see! There are a number of ways to play a long $US view. Whether or not a leveraged position is taken depends on an individual’s circumstances and that I’m afraid, is outside our realm of providing General Advice / Commentary. Leverage increases both the upside and downside. When I think about an investment, I’m very conscious of ‘where it can go wrong’ in the first instance. Managing the downside is extremely important, more so than managing the upside. If an investor loses 50%, they need to make 100% to get back to breakeven!
Interestingly, I’m doing a video tomorrow with Betashares and we cover the options available to investors in this space, including the leveraged funds that you mentioned.
The US S&P500 Weekly Chart
Conclusion (s)
The US continues to roaring ahead however risks are building
As discussed at length on the weekend, the $US remains the key
Look for a potential low in the $US this week.
Overnight Market Matters Wrap
· The US equity markets continued their relentless charge into record territory, with all major indices setting new highs on the back of the continuing underlying strength of corporate earnings.
· The strength in the tech socks, helped the Nasdaq 100 charge through the 7000 level (+1.54%), the Dow past 26,600 and the S&P500 just 1% shy of 2,900 (+1.2%). This is the strongest start to a year for US equity markets since 1987, with the key indices up between 7.5% (S&P500) and 8.5% (NASDAQ).
· While the US markets continue their bull market charge into 2018, the ASX is by contrast is -0.7% ytd, with the banks and yield stocks weighing on the market while the materials have outperformed. Bonds continued their weaker start to the year, with the US 10 year bonds back to 2.66% from around 2.4% at the start of the year.
· Commodities were mixed over the weekend with oil stronger, gold flat, iron ore easier and base metals mixed. Despite that, in US trading, BHP was +2% and Rio +1%. The A$ firmed above US81c, its highest level since may2015.
· The March SPI Futures is indicating the ASX 200 to open 22 points higher towards the 6075 level this morning.
Disclosure
Market Matters may hold stocks mentioned in this report. Subscribers can view a full list of holdings on the website by clicking here. Positions are updated each Friday, or after the session when positions are traded.
Disclaimer
All figures contained from sources believed to be accurate. Market Matters does not make any representation of warranty as to the accuracy of the figures and disclaims any liability resulting from any inaccuracy. Prices as at 29/01/2018. 8.00AM.
Reports and other documents published on this website and email (‘Reports’) are authored by Market Matters and the reports represent the views of Market Matters. The MarketMatters Report is based on technical analysis of companies, commodities and the market in general. Technical analysis focuses on interpreting charts and other data to determine what the market sentiment about a particular financial product is, or will be. Unlike fundamental analysis, it does not involve a detailed review of the company’s financial position.
The Reports contain general, as opposed to personal, advice. That means they are prepared for multiple distributions without consideration of your investment objectives, financial situation and needs (‘Personal Circumstances’). Accordingly, any advice given is not a recommendation that a particular course of action is suitable for you and the advice is therefore not to be acted on as investment advice. You must assess whether or not any advice is appropriate for your Personal Circumstances before making any investment decisions. You can either make this assessment yourself, or if you require a personal recommendation, you can seek the assistance of a financial advisor. Market Matters or its author(s) accepts no responsibility for any losses or damages resulting from decisions made from or because of information within this publication. Investing and trading in financial products are always risky, so you should do your own research before buying or selling a financial product.
The Reports are published by Market Matters in good faith based on the facts known to it at the time of their preparation and do not purport to contain all relevant information with respect to the financial products to which they relate. Although the Reports are based on information obtained from sources believed to be reliable, Market Matters does not make any representation or warranty that they are accurate, complete or up to date and Market Matters accepts no obligation to correct or update the information or opinions in the Reports.
If you rely on a Report, you do so at your own risk. Any projections are estimates only and may not be realised in the future. Except to the extent that liability under any law cannot be excluded, Market Matters disclaims liability for all loss or damage arising as a result of any opinion, advice, recommendation, representation or information expressly or impliedly published in or in relation to this report notwithstanding any error or omission including negligence.
To unsubscribe. Click Here


