Subscriber Questions (NCM, IGO, MYX, IFL)
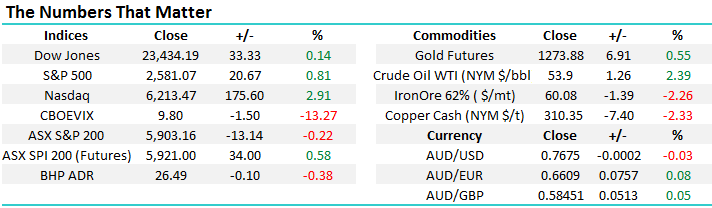
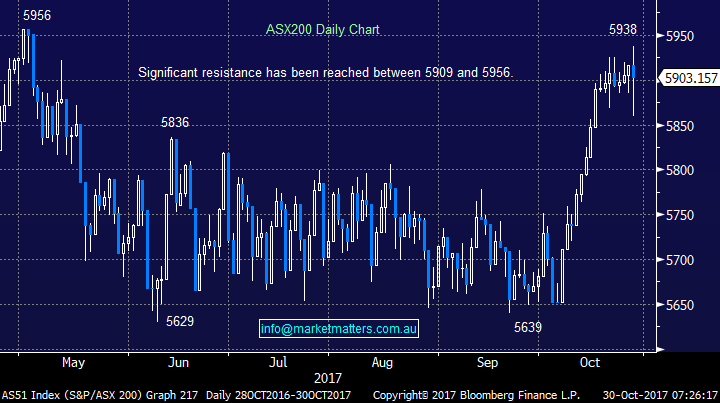
The ASX200 spent last week consolidating the strong gains for the month, this morning we look set to test the 5950 resistance area yet again, i.e. the highs of 2017. We find ourselves in an interesting position when we balance our views on local and global markets:
- The ASX200 looks poised to break through the long-term psychological resistance around 6000 in 2017 / 8.
- However the local banking sector is rapidly approaching the seasonally very weak window of 10-14th November e.g. CBA has corrected over 6% from this period since the GFC and it pays no dividend in the month.
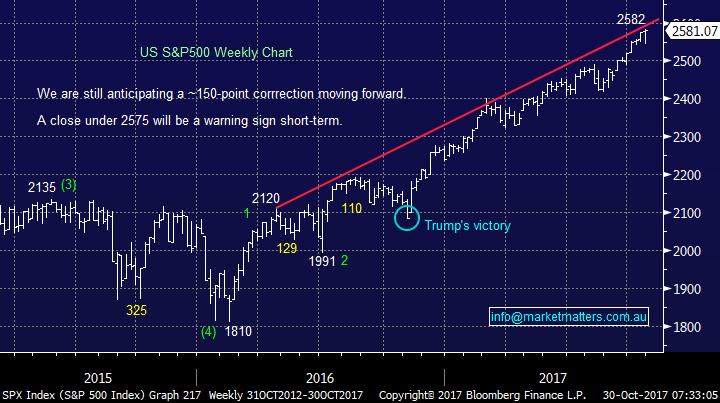
- US stocks on a risk / reward basis still look poised for ~5% correction.
Considering we now only hold 10% cash in the MM Growth Portfolio, our next move is more likely to be a sell than a buy.
This week we again received some excellent questions which are fabulous and we’ve managed to cover 6 very topical ones in this morning’s report, we are sorry if we could not get to yours, but most importantly thanks - keep them coming!
ASX200 Daily Chart
If we were specifically looking at US stocks, we would continue to increase our cash levels in anticipation of a correction.
US S&P500 Daily Chart
Question 1
“For Monday morning, Gold is starting to show some weakness and with the outlook for US interest rates looking still promising coupled with a more bullish USD it appears bleak for this lustrous metal to shine. I appreciate the long term view with Chinese and Indian jewellery purchases supporting strength however shorter term can you explain the reason to continue to hold NCM other than short term market correction hedging?” – Thanks Peter.
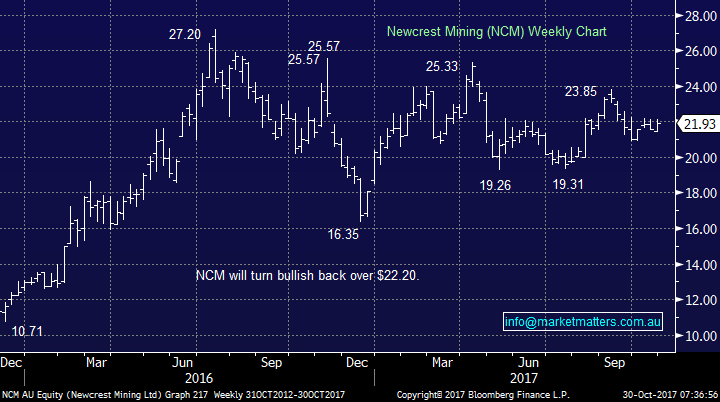
Morning Peter, It sounds like you have been a fly on the wall of our strategy meeting! As you point out we are holding a position in Newcrest (NCM) which is slightly underwater at present. The important points we are considering around this investment:
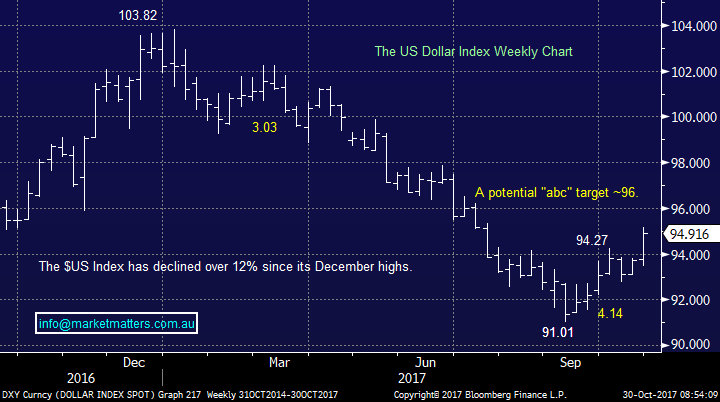
- We believe the $US has a 60-40 chance of making another important low around the 90 area on the $US Index.
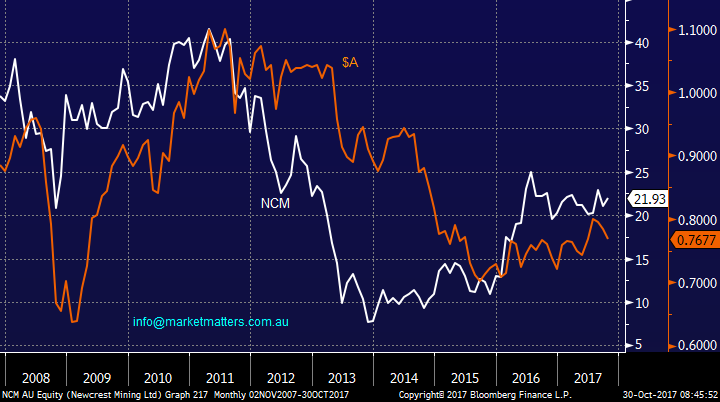
- There is a strong correlation between NCM and the $US with an extrapolated price of over $24 if this unfolds.
- Also, the gold price may be weak in $US, but it’s a lot healthier in $A due to the weakness in the local currency.
- There is always the possibility of a crazy North Korea flare up, but this is definitely not a stand-alone reason to buy a stock.
Hence on balance, while we are considering exiting our NCM position, we believe there remains good possibility of selling in the $24-25 region.
Newcrest Mining (NCM) Weekly Chart
$US Index Weekly Chart
Question 2
“Hi MM, If you guys are looking for AID to track to .65, what would be the situation with Gold?" - Cheers, Sam.
Morning Sam, thanks for the great question as we constantly look for correlations / leading indicators this is one area we have explored recently – the correlation / picture is very clear:
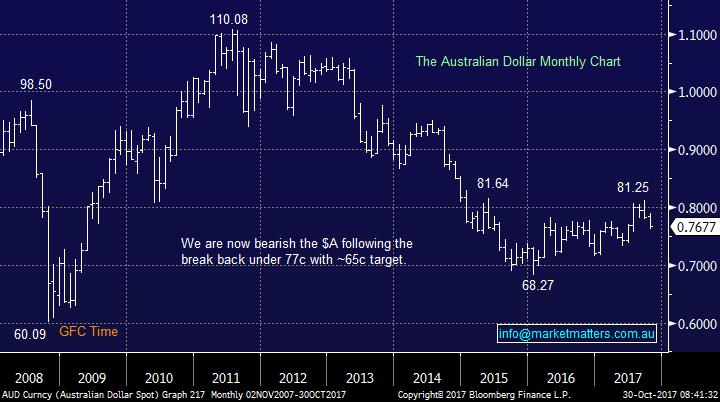
- If we are going to see the $A fall towards the 65c region local gold stocks are highly likely to experience a tough time.
- As outlined in question 1 we expect a final dip in the $US, bounce in the $A, when we plan to exit our NCM position.
Australian Dollar ($A) v Newcrest Mining (NCM) Monthly Chart
Australian Dollar ($A) Monthly Chart
Question 3
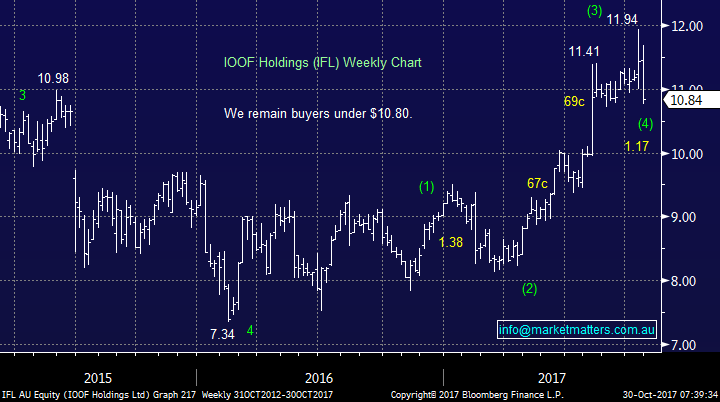
“I entered a buy order for a bundle of IFL at $10.93. Even though the most recent sale at the time was $10.945, it took only about 12-15 minutes before the order was filled. I have noticed lately that my sell orders are filled when I put them on at one or two cents above the most recent price, and on this occasion my buy order was filled at 1.5 cents below the most recent price. In all cases there were scads of orders between latest market price and my bid or ask. On the face of it, this is difficult to explain. The only thing which occurs to me is that many orders listed on the bid/ask table are dummy orders. Even so, how my orders can jump the queue is beyond my ken. Maybe James can comment on this in his Monday questions and answers blog.” - Best Wishes, John
Morning John, this does sound strange and hard to answer without fully understanding what platform you are using. I know when we look at the bids-sells on Blomberg they coincide exactly with the ASX’s “SEATS screen”, in other words most definitely no “dummy orders”. Your order should be filled / in the screen within seconds of being entered and I know this is the case when our staff transact using NAB Trade for example. Could you give me a little more information?
IOOF Holdings (IFL) Weekly Chart
Question 4
“What’s going on with IGO? It’s tumbled around 10% in the last 2 days?” - Thanks, Anthony B.
“Are you concerned about IGO weakness or is this a buying opportunity?” – Sadhana P.
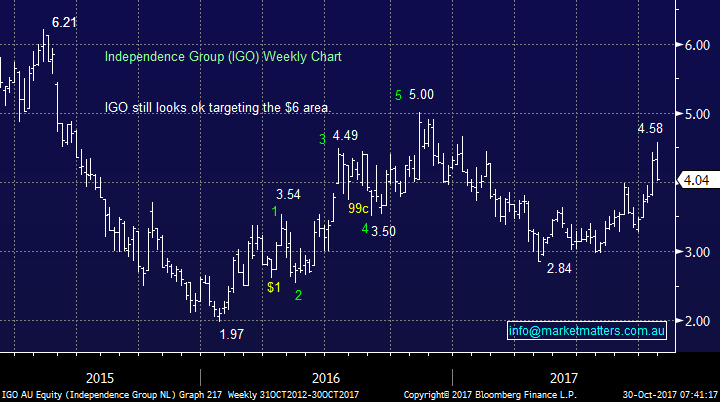
IGO is a Gold and Nickel miner with projects across Australia for those who are not familiar with the company. The simple answer at this stage is no as we look to buy weakness in the Australian resources space into pullbacks – we only have a 5% exposure at this stage. You only have to look at the following weekly chart of IGO to see the stock is often choppy / volatile as it appears to second guess the nickel price.
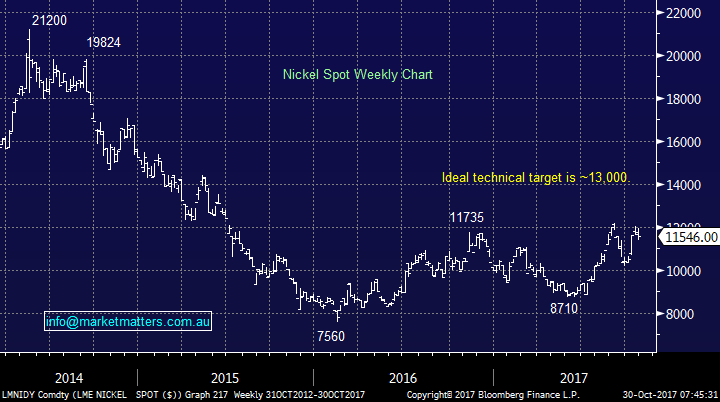
We still like nickel and base metals at current levels and hence are comfortable with IGO. However, we are not planning to average this position plus investors should be prepared for some further day-day volatility.
Independence Group (IGO) Weekly Chart
Nickel Spot Price on the LME Weekly Chart
Question 5
“Like to find out what you think about MYX, does the share has potential?” - Regards, V.N.
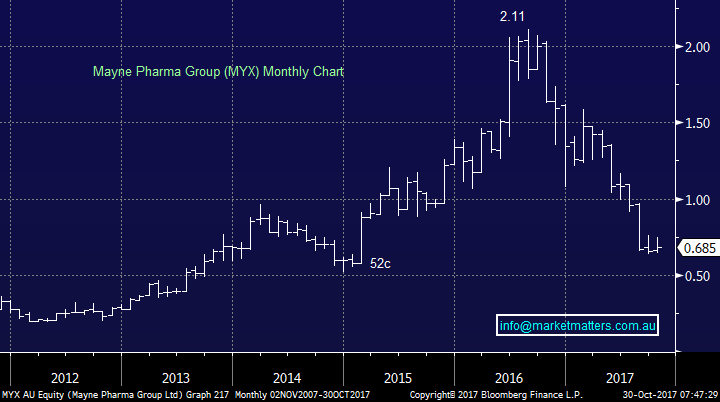
Morning and thanks for another interesting question. Mayne Pharma (MYX) has performed even worse than our telco sector since its highs of 2016, not an award you want to win. The developer and manufacturer of oral pharmaceuticals has totally lost its “market darling” status as it's been disappointing on the earnings front as fierce competition in the United States' generic drug sector continues to weigh on earnings.
From a valuation perspective the stocks is now relatively cheap trading on a est. 11.05x est. 2018 earnings. The stock also remains one of the most shorted stocks in the market with well over 10% of its stock in the hands of short-sellers.
For the aggressive trader out there we could buy MYX around 60c targeting a 20% squeeze higher – but it will be a volatile ride!
Mayne Pharma (MYX) Monthly Chart
Overnight Market Matters Wrap
· The US equity markets closed higher last Friday, with the NASDAQ 100 outperforming the major indices following positive reporting from some of its tech names.
· The US economy expanded at 3% pa in the September quarter, better than analyst’s expectations. President Trump is expected to make Jerome Powell the next Fed Chair which is seen as bullish as his policies are seen as comparable with Yellen.
· The December SPI Futures is indicating the ASX 200 to open 40 points higher towards the 5943 area this morning.
Disclosure
Market Matters may hold stocks mentioned in this report. Subscribers can view a full list of holdings on the website by clicking here. Positions are updated each Friday, or after the session when positions are traded.
Disclaimer
All figures contained from sources believed to be accurate. Market Matters does not make any representation of warranty as to the accuracy of the figures and disclaims any liability resulting from any inaccuracy. Prices as at 30/10/2017. 8.00AM.
Reports and other documents published on this website and email (‘Reports’) are authored by Market Matters and the reports represent the views of Market Matters. The MarketMatters Report is based on technical analysis of companies, commodities and the market in general. Technical analysis focuses on interpreting charts and other data to determine what the market sentiment about a particular financial product is, or will be. Unlike fundamental analysis, it does not involve a detailed review of the company’s financial position.
The Reports contain general, as opposed to personal, advice. That means they are prepared for multiple distributions without consideration of your investment objectives, financial situation and needs (‘Personal Circumstances’). Accordingly, any advice given is not a recommendation that a particular course of action is suitable for you and the advice is therefore not to be acted on as investment advice. You must assess whether or not any advice is appropriate for your Personal Circumstances before making any investment decisions. You can either make this assessment yourself, or if you require a personal recommendation, you can seek the assistance of a financial advisor. Market Matters or its author(s) accepts no responsibility for any losses or damages resulting from decisions made from or because of information within this publication. Investing and trading in financial products are always risky, so you should do your own research before buying or selling a financial product.
The Reports are published by Market Matters in good faith based on the facts known to it at the time of their preparation and do not purport to contain all relevant information with respect to the financial products to which they relate. Although the Reports are based on information obtained from sources believed to be reliable, Market Matters does not make any representation or warranty that they are accurate, complete or up to date and Market Matters accepts no obligation to correct or update the information or opinions in the Reports.
If you rely on a Report, you do so at your own risk. Any projections are estimates only and may not be realised in the future. Except to the extent that liability under any law cannot be excluded, Market Matters disclaims liability for all loss or damage arising as a result of any opinion, advice, recommendation, representation or information expressly or impliedly published in or in relation to this report notwithstanding any error or omission including negligence.
To unsubscribe. Click Here


