Subscriber Questions (MTR, CBA, FGR)

Another week is upon us and we’ve got the underlying feeling that more volatility is around the corner, especially compared to the sedentary advance we experienced during much of 2017. The Fear Index (VIX) is back under 20%, well below its panic high of 50% earlier in the month but well above the sub-10% level where we spent much of last year. Investors can be very quick to forget about tough times and the latest plunge by global equities was only 10-days ago, it currently feels likely that this week will start off with a negative bias to test the foundations of the bounce – BHP being set to open over -2% lower will not help matters.
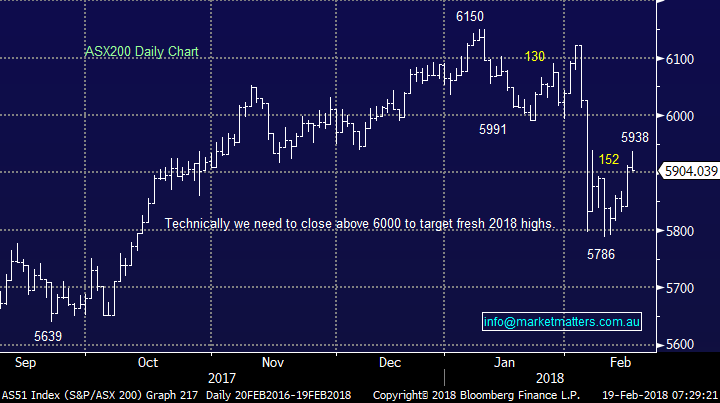
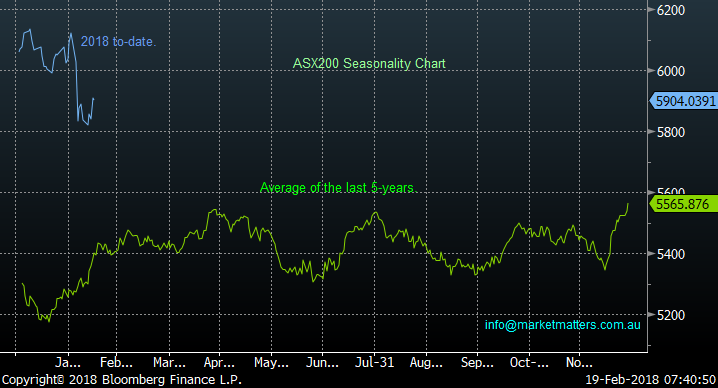
Seasonally local equities should hold together / rally into the dangerous April-May period, remember the quote “sell in May and go away”. From a technical perspective this week is likely to provide some significant clues as to the ensuing months, basically if stocks can hold around Friday’s levels we will become increasingly optimistic that the ASX200 can rally back above 6000 and probably above the year’s 6150 top.
We should also remember at this stage the market is potentially following its usual characteristic of forming a low for Q1 in early February but we are aware that the daily ASX200 picture can easily be interpreted bearishly targeting the 5700 area hence this week is a very important one.
- Our view at MM remains the recent aggressive sell-off by global equities is the warning sign we have anticipated for what will follow over the coming years but the time to jump off the train has not arrived, just yet.
NB We may see US stocks retest their monthly lows while the ASX200 breaks below 5786 because a number of large stocks are trading ex-dividend in this period e.g. CBA $2 last week.
ASX200 Daily Chart
ASX200 Seasonal Chart
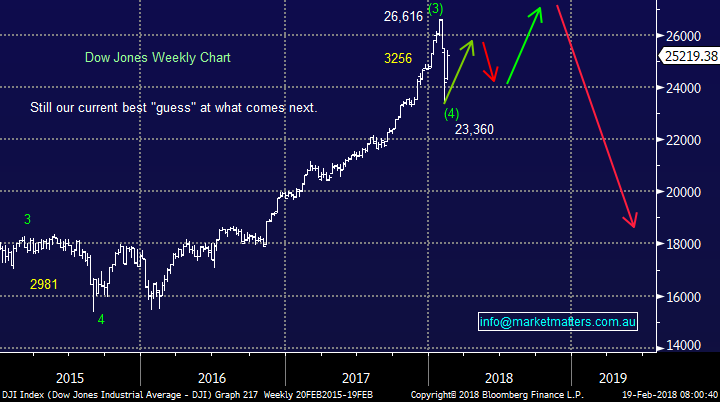
The US Dow Jones gave us our short sharp “warning” correction that we having been waiting for following the strong Christmas rally, it actually came about a month later than we expected and was more aggressive than the 5% we had envisaged.
- MM is looking for a choppy advance by US stocks to fresh all-time highs over the coming months i.e. above the 26,616 for the Dow (over 6 % higher).
- If our” best guess” at what comes next for US stocks is on the money they should pullback this week.
US Dow Jones Weekly Chart
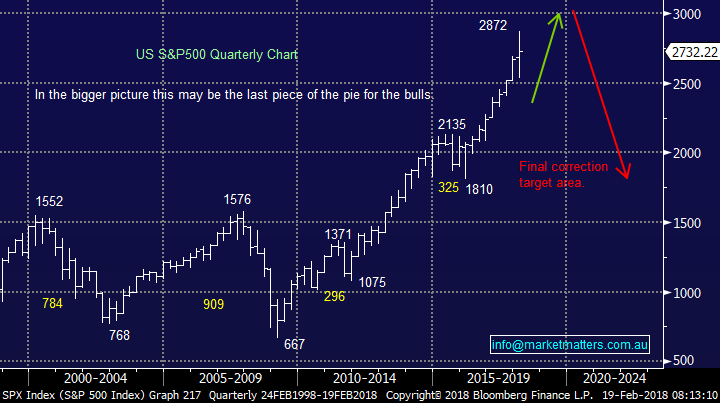
In the bigger picture unfortunately we continue to believe it’s almost “bon voyage” for the bulls as MM targets an eventual test of the 2015 lows as global share markets are positioned almost perfectly to correct the 9-year bull market, following the GFC.
- Corrections are a healthy facet of markets but certainly scare many investors when they are of say greater than -20% which has already occurred 3 times since Sydney hosted the Olympics.
US S&P500 Quarterly Chart
This week we have again received an excellent group of questions with a number interestingly around ETF’s. We’ve answered 6 in this morning report but I’m confident our short / medium term outlook for stocks probably satisfies the majority of subscriber’s thoughts even if they didn’t send us an email this week – ETF’s dovetail excellently into the current markets position because they can be used to hedge / speculate when markets fall.
Question 1
“Good call last night. Love your work. If traders have now positioned themselves for a higher print, then the reaction to a higher print can actually be a higher mkt as hedges are unwound” – Thanks Simon.
Hi Simon, thanks for the pat on the back, we firmly believe that understanding the markets currently belief / position has an enormous impact on how they react to news / economic data. Simply to us at MM too many people were expecting a continuation of the sharp declines by US stocks if the CPI (inflation data) came out strong that the “path of most pain” was clearly up – we often write that investing with the majority is rarely the way to be facing. This is exactly what happened, the CPI print was high and after a few minutes stocks rallied for the remainder of the session – simply all shorter-term traders / investors were bearish already and were started to cover simply leaving nobody left to sell.
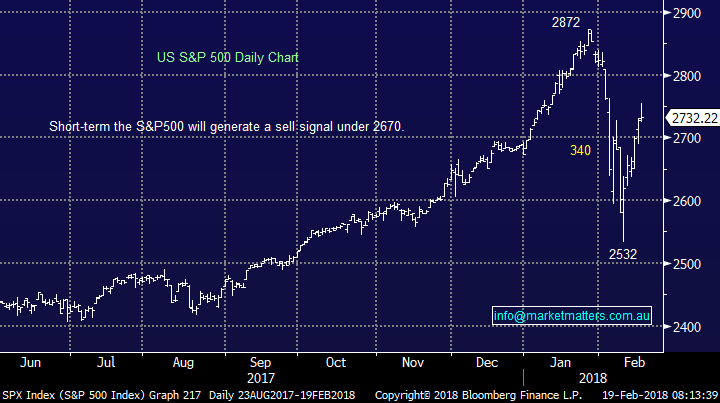
As you can see from the below daily chart of the broad based US S&P500 we are now almost exactly in the middle of the large February range / volatility – from a risk / reward basis we are neutral over the coming days at least, as stocks now feel back at a balanced equilibrium.
US S&P500 Daily Chart
Question 2
“Hello MM Team It says a lot about your thinking No other investment newsletter I am aware of is prepared to look at other alternative ways to invest I am talking about ETFS The new dymo for a different type of investor My only question When do you expect to for ETFS being part your daily comments.” - Kind Regards Alan G.
Moring Alan, thanks for the support and relatively easy, but topical question. I will answer with 2 points:
- I anticipate that we will be looking at a couple of ETFS positions in the coming days / weeks.
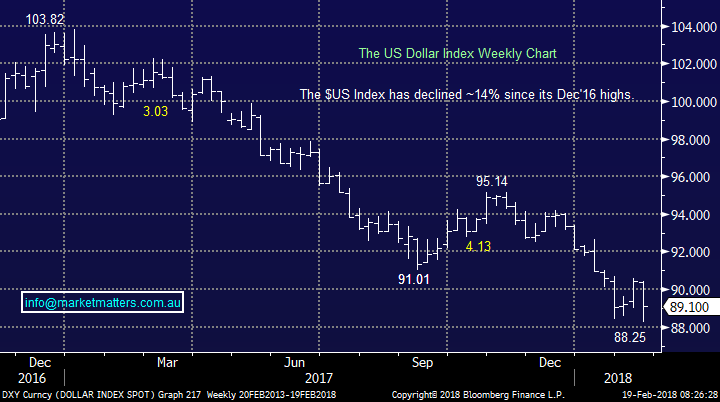
- Specifically, we are looking at buying a $US ETF targeting a +7% rally minimum plus of course we will be looking at negative facing equity ETF’s when we believe stocks are headed lower.
US Dollar Index Weekly Chart
Question 3
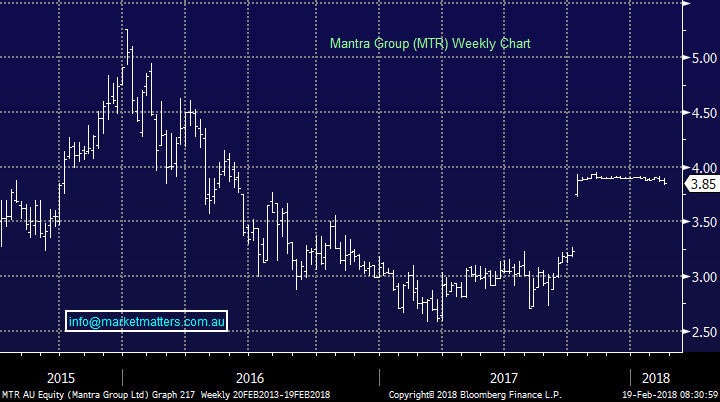
“Mantra (MTR) has had a fairly strong run and as the result of the Takeover Offer from AccorHotels - currently $ 3.92 today. Both Deutsche Bank & Credit Suisse have recently placed large Buy Orders. The Charts indicate the Stock could be peaking. Should I sell this stock as I bought at $2.90 showing a 35% capital gain? Or Hold for further upside growth?” – Thanks Richard O.
Morning Richard, holders of MTR have had a great start to the year as the takeover target has not surprisingly remained strong while the ASX200 has fallen 4% from its January high.
- The bid by Accor Hotels for MTR which has been recommended by the board is $3.96, less than 3% above Fridays close.
- The bid is still being reviewed by the ACCC and this provides to reason for the slight discount + it also needs Foreign Investment Review Board approval – which is probably less of a concern. In our view, the rise of ‘alternative’ accommodation providers (airBNB etc) should be enough to settle the ACCC’s concerns around two such dominate operators jumping in bed together.
The decision for holders now is 2-dimensional:
- Hold out for the last 3% while risking ~15% if the ACCC knocks it back?
- Are there better opportunities elsewhere in the market at current levels – clearly not as good as earlier in the month when the ASX200 was below 5800?
Our view, and we always look in the context of risk v reward, the upside seems now seems disproportionate to the potential downside should something from left field scuttle the deal.
Mantra (MTR) Weekly Chart
Question 4
“Hi there, could you please let me know what risks there are with ETF's on the Australian exchange other than the obvious market risk. Is it only the issuer of the ETF default risk to consider or are there other risks (perhaps unknown). I would like to set up a SMSF soon and need to diversify globally so was thinking of ETFs such as DRUG, FOOD, HACK as well as country/region specific ETF's.” – Regards Simon T.
Morning Simon, ETF’s are certainly the flavour of the month and we can see ourselves kicking off in the sector shortly. Investors should consider a number of facets of investing in ETF’s including the following:
1. Exactly what the ETF is tracking i.e. bullish / bearish – there is likely to be some relatively small deviations on tracking of what the ETF is following.
2. Ensure an understanding of the currency impacts of the ETF – some are currency hedged, some aren’t.
3. Ensure an understanding of the tax implications of ETF’s.
4. How leveraged they are
5. How liquid they are i.e. are you crossing large spreads increasing the costs to transact – most are market made, so it pays to be patient in execution, however a good broker will assist with this.
6. How large / safe are the backers of the ETF.
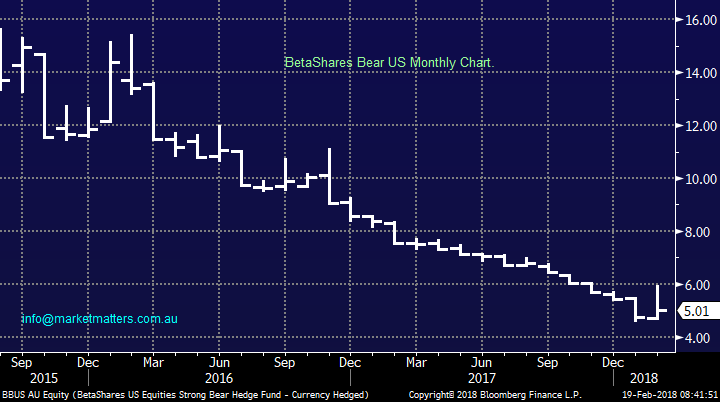
Below is the BetaShares Bear US Fund whose objective is to generate returns that are negatively correlated to the returns of the US share market (US S&P500) hedged to $A i.e. the value has fallen since late 2015 as US stocks have surged.
BetaShares Bear US Monthly Chart
Question 5
“James, with many stocks going ex div soon, can you please explain the cum dividend process.” – Thanks Bruce B.
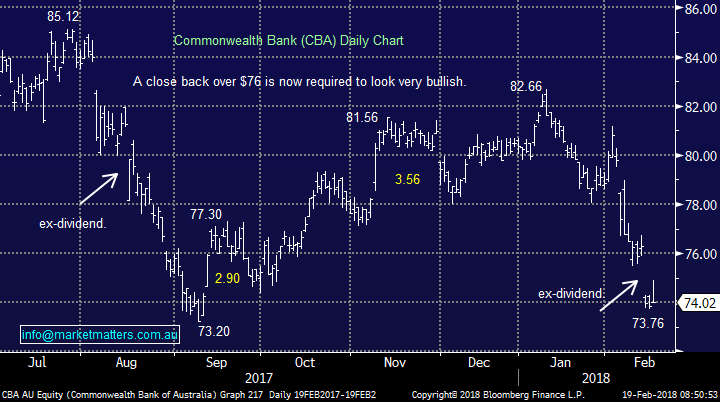
Hi Bruce, thanks for the question that is best explained using CBA from last week as an example:
1.If we bought CBA at ~$76 on the 13th of February we were entitled to the $2 dividend plus potentially the franking component - This is cum-dividend.
2. If you bought CBA at ~$74 on the 14th of February you are not entitled to the dividend but the stock was in this case cheaper (not always) - This is ex-dividend.
In terms of franking credits, here’s the rundown from the source of truth – the ATO.
Total franking credits entitlement of $5,000 or greater
The holding period rule generally applies to shares bought on or after 1 July 1997. It requires you to hold the shares 'at risk' for at least 45 days (90 days for preference shares and not counting the day of acquisition or disposal) to be eligible for a tax offset for the franking credit. The holding period rule only needs to be satisfied once for each purchase of shares. It only applies if your total franking credits entitlement for the year of income is over $5,000. (source:www.ato.com.au)
Commonwealth Bank (CBA) Daily Chart
Question 6
“If you are interested to lean about an Australian company actually producing and selling a graphene product, then First Graphene Limited does this using Sri Lankan vein graphite to create Graphene Oxide.
Hence their 25th January Quarterly Activities Report makes interesting reading, especially the possibility of them getting a patent on the method used to create the Oxide.
I do have shares in these Graphite mines: GPX, BAT and AXE, but currently not in FGR.” - Regards, Phil B.
Thanks for this Phil this is not surprisingly not a company we have looked at due to its sub $50m market cap.
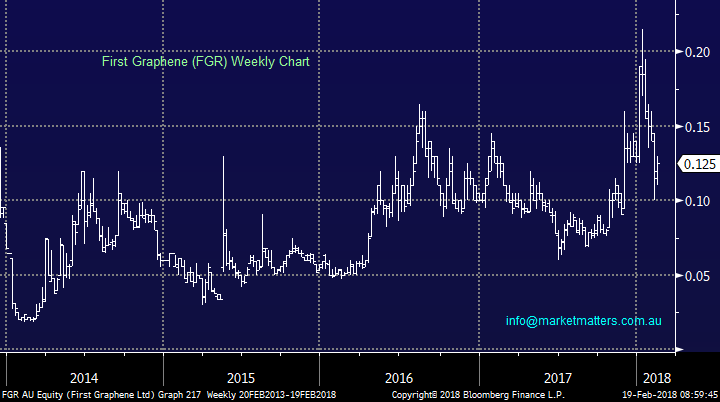
From a purely technical perspective we cannot see anything very exciting with FGR, I prefer GPX with stops under 30c – currently at 32.5c.
First Graphene (FGR) Weekly Chart
Overnight Market Matters Wrap
· The US markets had a volatile session, only for the major indices to close with little change last Friday. Early gains were tempered when news of the indictment of 13 Russians for interfering in the US elections in 2016 broke. For the week, all three indices rose 4-5%.
· The US Commerce Department has recommended that the US restrict aluminium and steel Imports. China has indicated it may hit back with restrictions of its own.
· Aluminium on the LME bounced 2%, while other metals were mixed. Oil was a bit better, while iron ore didn’t trade in China due to the New Year of the Dog.
· The March SPI Futures indicating the ASX 200 to open 9 points lower still testing the 5,900 level this morning.
Disclosure
Market Matters may hold stocks mentioned in this report. Subscribers can view a full list of holdings on the website by clicking here. Positions are updated each Friday, or after the session when positions are traded.
Disclaimer
All figures contained from sources believed to be accurate. Market Matters does not make any representation of warranty as to the accuracy of the figures and disclaims any liability resulting from any inaccuracy. Prices as at 19/02/2018. 8.13AM
Reports and other documents published on this website and email (‘Reports’) are authored by Market Matters and the reports represent the views of Market Matters. The MarketMatters Report is based on technical analysis of companies, commodities and the market in general. Technical analysis focuses on interpreting charts and other data to determine what the market sentiment about a particular financial product is, or will be. Unlike fundamental analysis, it does not involve a detailed review of the company’s financial position.
The Reports contain general, as opposed to personal, advice. That means they are prepared for multiple distributions without consideration of your investment objectives, financial situation and needs (‘Personal Circumstances’). Accordingly, any advice given is not a recommendation that a particular course of action is suitable for you and the advice is therefore not to be acted on as investment advice. You must assess whether or not any advice is appropriate for your Personal Circumstances before making any investment decisions. You can either make this assessment yourself, or if you require a personal recommendation, you can seek the assistance of a financial advisor. Market Matters or its author(s) accepts no responsibility for any losses or damages resulting from decisions made from or because of information within this publication. Investing and trading in financial products are always risky, so you should do your own research before buying or selling a financial product.
The Reports are published by Market Matters in good faith based on the facts known to it at the time of their preparation and do not purport to contain all relevant information with respect to the financial products to which they relate. Although the Reports are based on information obtained from sources believed to be reliable, Market Matters does not make any representation or warranty that they are accurate, complete or up to date and Market Matters accepts no obligation to correct or update the information or opinions in the Reports.
If you rely on a Report, you do so at your own risk. Any projections are estimates only and may not be realised in the future. Except to the extent that liability under any law cannot be excluded, Market Matters disclaims liability for all loss or damage arising as a result of any opinion, advice, recommendation, representation or information expressly or impliedly published in or in relation to this report notwithstanding any error or omission including negligence.
To unsubscribe. Click Here


