Subscriber Questions (GXY, KDR, ORE)
You can feel the concern drift over Australian investors like a thick morning mist following last week’s ~5% aggressive and volatile sell-off. However at this stage the market is behaving itself and interestingly enough, it was 2017 that was more unusual in its resilience as opposed to 2018 with its weakness.
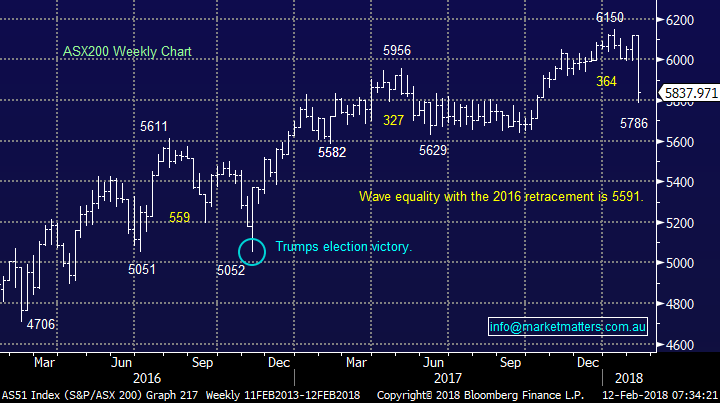
- The average pullback within a year for the ASX200 is over 10% e.g. in 2016, it corrected 10% from May to November.
- The pullback in 2017 of only 5.5% was actually the statistical outlier – technical analysts would argue it corrected in time by treading water from May to October.
Interestingly in both cases May was the problem month - remember the quote “sell in May and go away”.
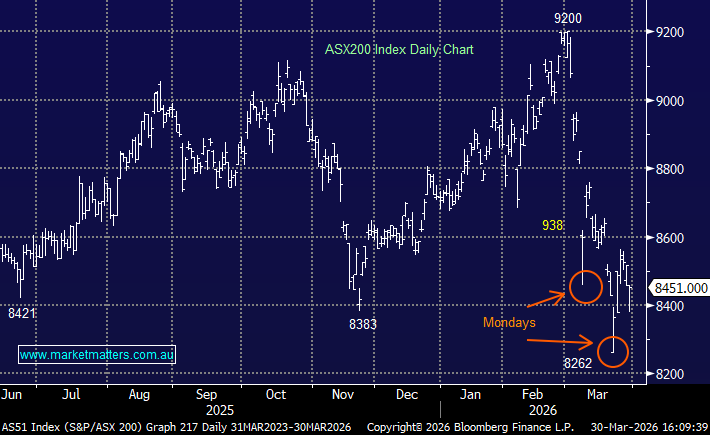
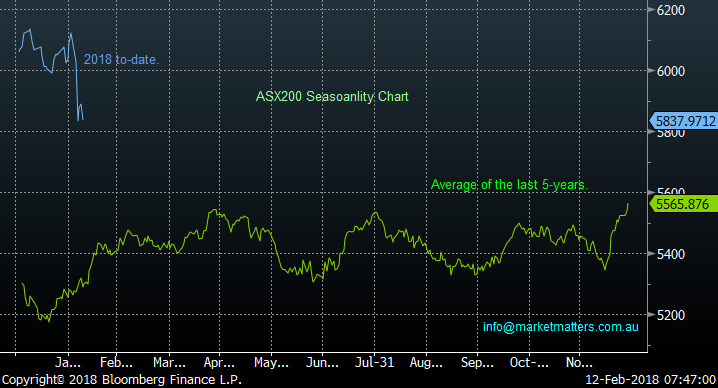
We should also remember at this stage the market is potentially following its usual characteristic of forming a low for Q1 around this time – we have quoted this statistic repeatedly so far this year. Although while we must acknowledge that last week’s sell off was more aggressive than usual, which can be visualised in the Seasonality Chart, our bias is now a positive one for the next ~3-months.
- Our view at MM is last week’s aggressive sell-off by global equities is the warning sign we anticipated for what will follow over the coming years but the time to jump off the train has not arrived just yet.
ASX200 Weekly Chart
ASX200 Seasonal Chart
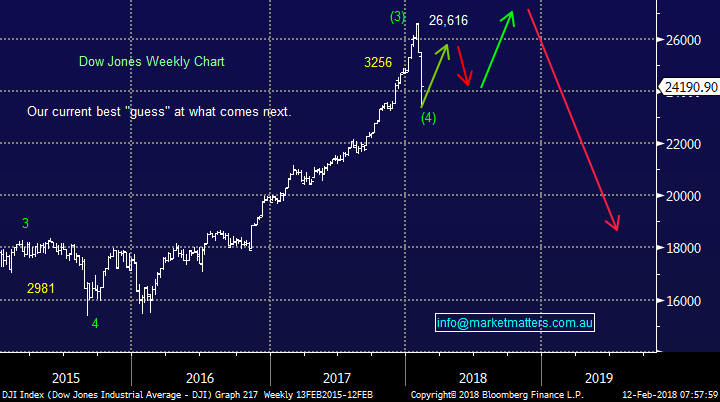
The US Dow Jones has finally given us our short sharp “warning” correction that we having been waiting for since January.
- While we expect volatility to remain elevated last week’s panic at this stage looks likely to be the worst of it.
- MM is looking for a choppy advance by US stocks to fresh all-time highs over the coming months i.e. above where they were 10 days ago.
Please note; US Inflation Data is out Wednesday (US time), which will be the markets main focus – a higher inflation print will see rates up and stocks down while an inline / lower print should confirm a short term low for equities.
US Dow Jones Weekly Chart
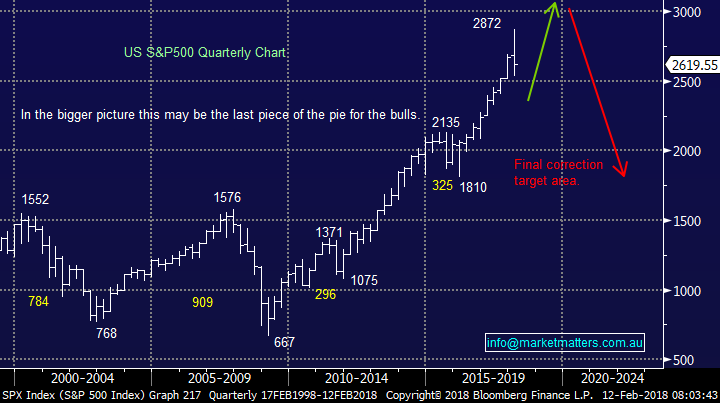
In the bigger picture unfortunately we believe it’s almost “bon voyage” for the bulls as MM eventually targets a test of the 2015 lows as global share markets correct the 9-year bull market, following the GFC.
- Corrections are a healthy facet of markets but certainly scare many investors when they are large - say greater than -20% which has already occurred 3 times since Sydney hosted the Olympics – however, the 5% we saw last week given the relative calm we saw in 2017 has clearly rattled some.
US S&P500 Quarterly Chart
This week we have again received an excellent group of questions with the vast majority around what to do this week / moving forward which has been covered above and in the Weekend Report.
We’ve answered 4 others in this morning’s report but I’m sure the above short / medium term outlook for stocks probably satisfies the majority of subscriber’s queries.
Question 1
“Hi James, I follow most of your Alerts and am wondering how I should interpret “below v about”?” - Thanks, Steve E.
Morning Steve, you obviously have a knack of asking the question for the masses!
At MM we write about and send alerts based on what we are doing in our own portfolio and over the years we have collected a diverse group of subscribers. Ultimately, our belief is that subscribers decide what suits them however below are some numbers behind the terms we use.
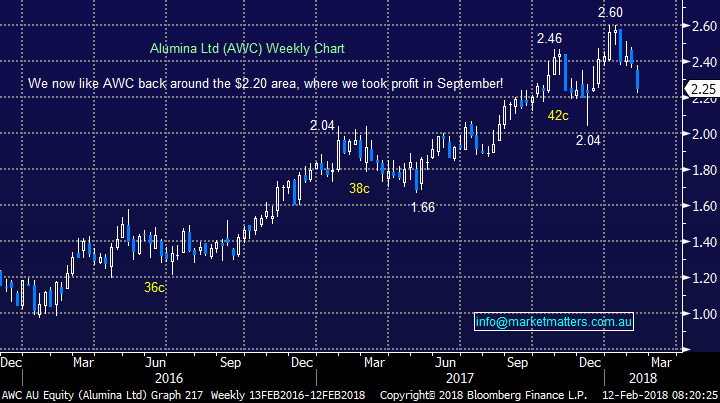
- Below - When we say below we mean just that, below the certain price. e.g. if we are looking to buy AWC below $2.20 we will most likely layer bids between $2.15 and $2.19.
- Limit – When we say limit it means at that price or better. e.g. If we are looking to buy BHP at $29.00 limit, our average price on the order will end up being $29.00 or below. On the sell side, this would mean our average exit price would be $29.00 or higher
- Around – When we say around, we mean within ~1% of the mentioned price by the end of the order. For instance, around $76 for CBA would equate to a buy price up to $76.76 or a sell price down to $75.24 .
Again, we stress that MM simply outlines what we are doing, and each individual subscriber can make up their own mind on their specific approach.
Alumina (AWC) Weekly Chart
Question 2
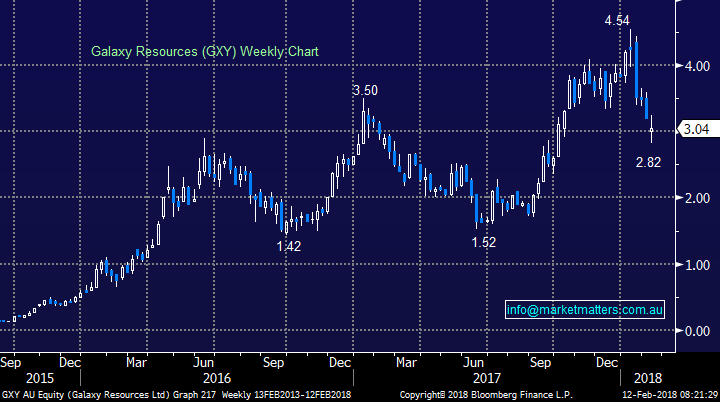
“What’s MM/s thoughts on GXY? I’m showing a 9% loss and debating whether I should hold or cut my losses.” – Chris G.
Hi Chris, a tricky one for us to answer but here goes.
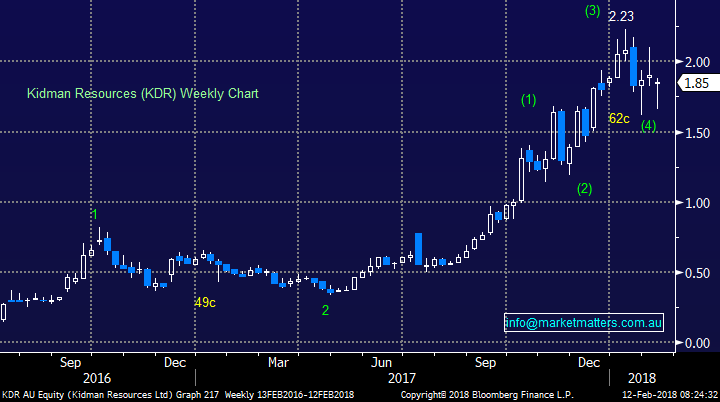
- We like the lithium space hence our holding in Kidman Resources (KDR).
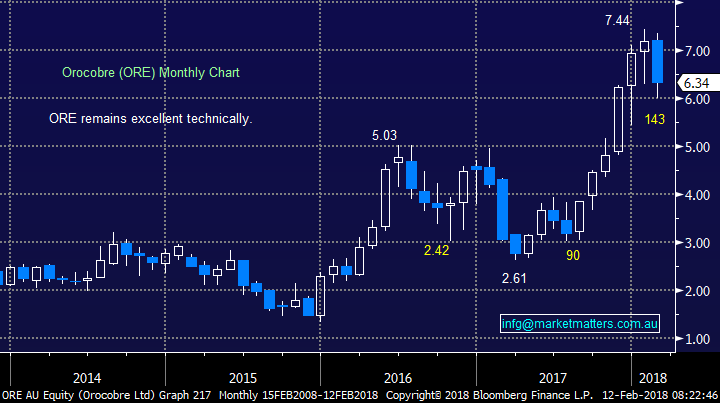
- Also, we are considering buying back into Orocobre around the $6 region.
In summary - If we are correct with KDR and ORE then in all likelihood the highly correlated GXY will recover but it’s not our preferred exposure to the lithium space at this stage.
Galaxy Resources (GXY) Weekly Chart
Orocobre (ORE) Monthly Chart
Kidman Resources (KDR) Weekly Chart
Question 3
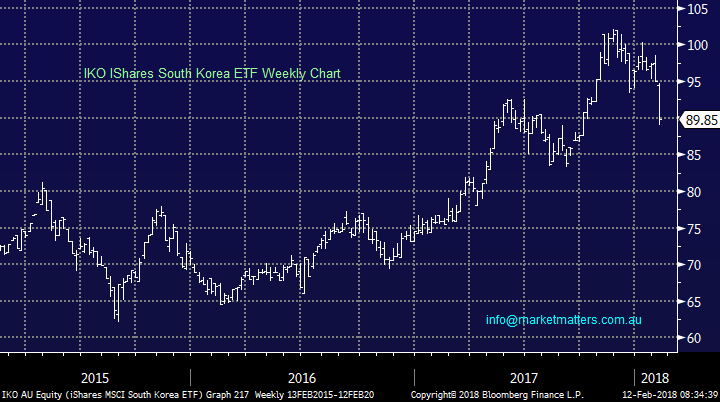
“MM don’t seem to discuss ETFs. However, I thought you may be able to explain why while IKO has declined 6.5% since 21 /11/17 and 4.56% since Thursday while most international ETFS issued on the ASX (e.g. IJP/IHK) have been more or less mirroring US shares. I was wondering if this is a buying opportunity or if there is something I am missing, except for North Korea that is.” - Chris G.
Hi Chris, I’m excited to say we see MM covering ETF’s more and more as 2018 evolves as we anticipate wanting some bearish exposure to stocks – and perhaps a broader thematic portfolio using ETFs may follow.
With regard to the IKO ETF it’s an ETF holding shares on the South Korean exchange domiciled in the US – so it holds South Korean companies focused in the consumer discretionary, financial and IT sectors. Hence this is a basket that has a number of differences to say the simple US S&P500.
- The Korean Index is more closely correlated to the Emerging Markets (EEM) / Asia than US stocks.
- Also, they have a $US exposure that is likely to influence performance in these volatile times.
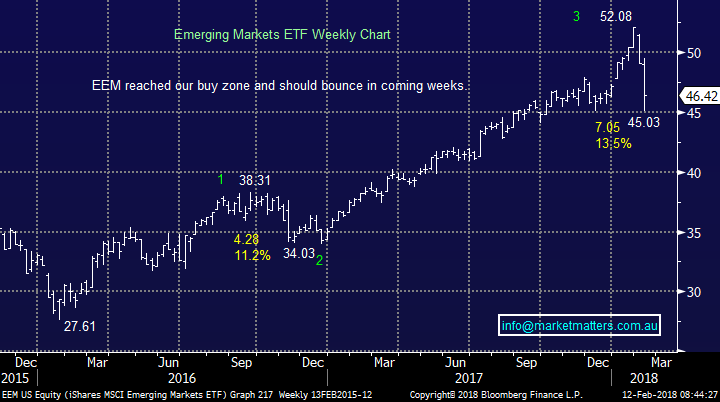
From a technical perspective we can see a touch more downside before the risk / reward will look very exciting, unless we see a close back above the 94 area. However considering we are bullish the EEM at current levels we must be by default net positive at current levels on the IKO.
IKO iShares ETF Weekly Chart
Emerging Markets ETF (EEM) Weekly Chart
Question 4
“Good Morning James. The huge volatile in the world share market. do you think we as a retail investors should buy some bear fund such BEAR, BBUS or BBOZ to hedge our position during the volatile period? does it make sense? also will you adjust your view on the crude oil to target $70-80 based on the last week huge drop on the oil price?” – Michael S.
Hi Michael, Thanks for two very topical questions, we will answer is terms of our view on markets in a general sense - it’s important that subscribers fully understand our logic / thoughts during periods of high volatility.
- At this stage we believe stocks are net bullish after this recent pullback (warning) but we do intend to utilise negative facing ETF’s in 2018/9, theoretically not just yet
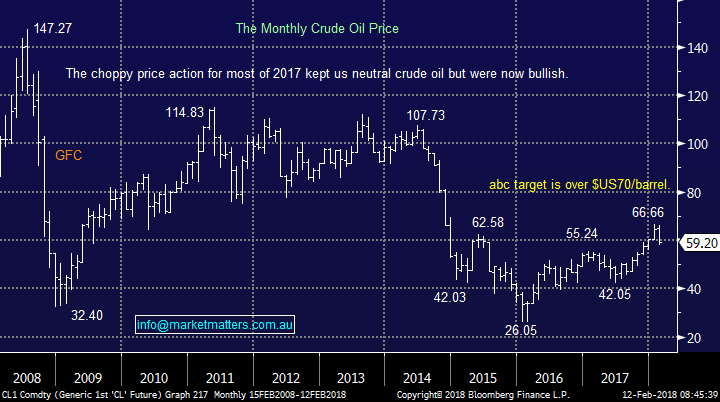
- We still have a $US70/barrel target for crude oil (not $80) but will lose confidence in this view if we see too much time below $US60/barrel.
- The risk factor this week is the US inflation data on Wednesday evening their time
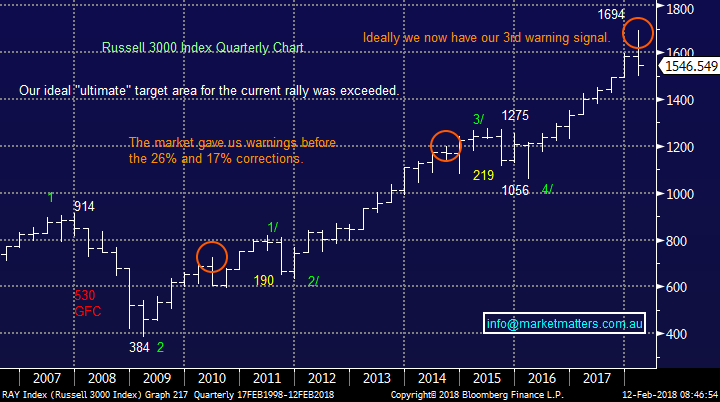
Russell 3000 Quarterly Chart
Crude Oil Monthly Chart
Overnight Market Matters Wrap
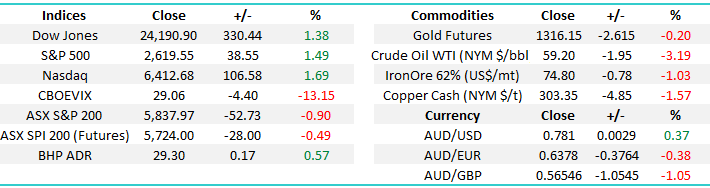
· Another session of wild swings was witnessed in the US markets overnight, with the Dow ending its session up 1.38% after hitting a 3-month intraday low of 23,360 and the broader S&P 500 up 1.49%.
· Interest rates remained close to 4 year highs, with the key 10 year benchmark slightly weaker again at 2.85%.Commodities also remained under pressure, with oil continuing to suffer from increased US supply with the key benchmark Brent price falling another 3.5% to under us$63- 10% below the recent high of US$70/bbl. Other commodities were generally easier, with copper down 1.5% at US$3.03 and gold and iron ore also slightly lower at US$1315/oz. and US$ 76.50/t.
· BHP is expected to outperform the broader market, after ending its US session up an equivalent of 0.6% from Australia’s previous close to the $29.31 area.
· The March SPI Futures indicating the ASX 200 to open 51 points lower towards the 5785 area this morning.
Disclosure
Market Matters may hold stocks mentioned in this report. Subscribers can view a full list of holdings on the website by clicking here. Positions are updated each Friday, or after the session when positions are traded.
Disclaimer
All figures contained from sources believed to be accurate. Market Matters does not make any representation of warranty as to the accuracy of the figures and disclaims any liability resulting from any inaccuracy. Prices as at 12/02/2018. 8.00AM.
Reports and other documents published on this website and email (‘Reports’) are authored by Market Matters and the reports represent the views of Market Matters. The MarketMatters Report is based on technical analysis of companies, commodities and the market in general. Technical analysis focuses on interpreting charts and other data to determine what the market sentiment about a particular financial product is, or will be. Unlike fundamental analysis, it does not involve a detailed review of the company’s financial position.
The Reports contain general, as opposed to personal, advice. That means they are prepared for multiple distributions without consideration of your investment objectives, financial situation and needs (‘Personal Circumstances’). Accordingly, any advice given is not a recommendation that a particular course of action is suitable for you and the advice is therefore not to be acted on as investment advice. You must assess whether or not any advice is appropriate for your Personal Circumstances before making any investment decisions. You can either make this assessment yourself, or if you require a personal recommendation, you can seek the assistance of a financial advisor. Market Matters or its author(s) accepts no responsibility for any losses or damages resulting from decisions made from or because of information within this publication. Investing and trading in financial products are always risky, so you should do your own research before buying or selling a financial product.
The Reports are published by Market Matters in good faith based on the facts known to it at the time of their preparation and do not purport to contain all relevant information with respect to the financial products to which they relate. Although the Reports are based on information obtained from sources believed to be reliable, Market Matters does not make any representation or warranty that they are accurate, complete or up to date and Market Matters accepts no obligation to correct or update the information or opinions in the Reports.
If you rely on a Report, you do so at your own risk. Any projections are estimates only and may not be realised in the future. Except to the extent that liability under any law cannot be excluded, Market Matters disclaims liability for all loss or damage arising as a result of any opinion, advice, recommendation, representation or information expressly or impliedly published in or in relation to this report notwithstanding any error or omission including negligence.
To unsubscribe. Click Here