Subscriber Questions – & getting the most out of Market Matters
We’ve had quite a number of new subscribers come on board over the past few weeks with many questions around navigating the site, and importantly how to get the most out of Market Matters. Rather than answer each question individually in today’s note, here is a broad take on the service. Firstly, each individual is different and has a resource like Market Matters for a different reason. Some simply like it for the SMS Alerts when we buy or sell a stock, some like the macro commentary and positioning insight we provide, some like the fact we run an actual portfolio rather than a long list of recommendations, while others are simply looking for a different take on what’s happening in the financial markets – and our take is often quite different to the mainstream view! On the other hand, some don’t like our brevity and can’t stand our spelling mistakes – but that’s OK too.
From our perspective we see the different components of the service in different ways. When we launched a number of years ago, our desire was to simply pass on the information and insight that we gathered in our daily role as investment managers, working with both institutional and retail clients, and importantly, managing our own money in the market. Our opinion was simple; too much that was written / spoken about the market was theoretical, often formulated by those who were simply not in the day to day grind of investing money. We came up with the concept of ‘bridging the gap’ between what we saw as professional investment managers and what retail investors were being exposed to. That still holds true today however the accessibility of information has improved dramatically. Retail investors now have access to a lot of research, a lot of insight, and frankly, a lot of competing views. We’ve gone from a scarcity of information, to information overload.
At Market Matters, we see ourselves as a portal that collects information, strips out the noise, takes the good bits and overlays it with our own knowledge in the areas we have experience. From that we present a clear view (our view) and then write about how we will act on that view. We’re not simply here identifying ‘good businesses’ to buy, we’re taking in all the available information, be it macro, technical and fundamental and overlaying this with common sense and importantly the experience we’ve gained managing money through different market cycles.
In terms of the service, the Morning Note details our mind set and views for the trading days / week ahead, and outlines in no uncertain terms where we see the market headed, and importantly how we’ve positioned our own portfolio of stocks. The Afternoon Note is a brief overview of the day’s trade focussing in on areas of interest to us and our portfolio. Our portfolio screen is updated each Friday with our current holdings, weightings, open P & L and more and this dove tales in with our Recent Activity page which tracks the last 30 instances of activity within our portfolio. We also have varies pages that track past alerts and give subscribers a list of stocks we’ve traded, the good, the bad and the indifferent, and our thinking at that time.
The SMS & email alerts when we trade are obviously popular, however the Weekend Report which is sent each Sunday at 10am is where the grunt work is done. We certainly present our views within the report and detail our thinking for the week ahead, however the Chart Pack within the report is incredibly important in our view. Global Financial Markets are interconnected and movements in one asset class can have a big bearing on movements in another – and the Chart Pack outlines our views on global indices, bond markets, key commodities, currencies and the main sectors we track on the Australian Market. We’d encourage you to view the Chart Pack as a good way of understanding the process and work that formulates our views.
Above all, getting the most out of Market Matters requires an open mind and a willingness to challenge the status quo. To all our new subscribers, welcome, we hope you find the service beneficial. To all our existing subscribers, thankyou for your ongoing support, we’re working hard to continually improve our offering which in the New Financial Year will include an Income Portfolio (with a difference!).
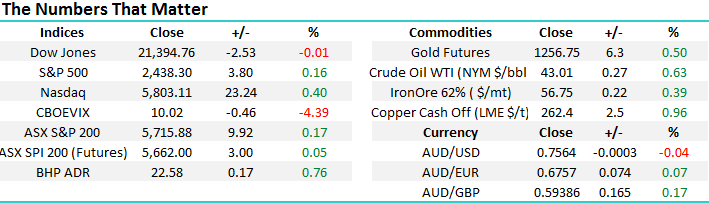
In terms of the market, another fairly quiet weekend for news flow, leaving us happily positioned with 15% cash, looking for opportunities into any further weakness towards the end of June. The ASX is likely to open flat this morning and
Question 1
"Hi MM, That was an excellent interview with Martin Crabb. However, I would be grateful if you could provide more information about the mere 3% 2018 growth in the resources sector as forecast by Martin Crabb in your recent video.
Why is 2018 growth only 3%. How does this fit with the entire minerals market, eg would Gold and Lithium also be only 3%? Some figures to back up this claim would be a good idea.
Regards, Phil."
Thanks Phil - For those that missed the video – it can be viewed here; In terms of the 3% growth number this is the Material Sector generally with different parts having different levels of growth, depending on a lot of factors, such as commodity prices, the profitability of operators in that commodity class listed in Australia, and the size of the company earnings. As the charts below will show, courtesy of the very good mining analyst at Shaw and Partners, Peter O’Connor the earnings recovery kicked off in early 2016 and we’ve seen very strong earnings growth from the sector, and that has been the main driver of the +17% growth in earnings of market generally.
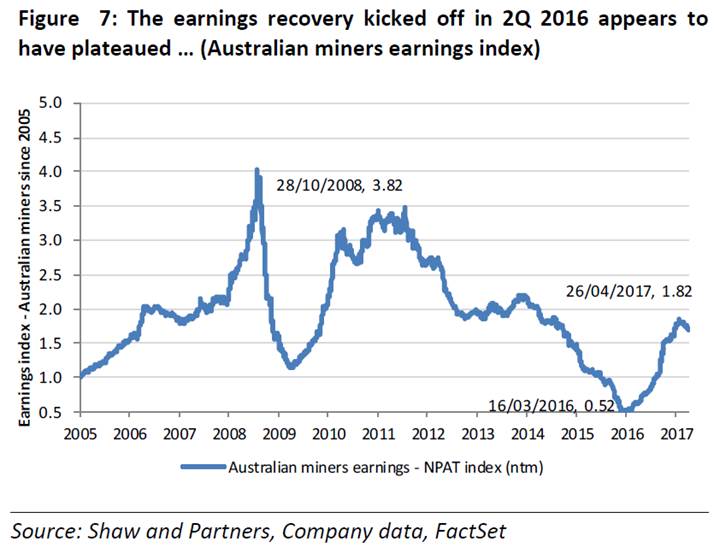
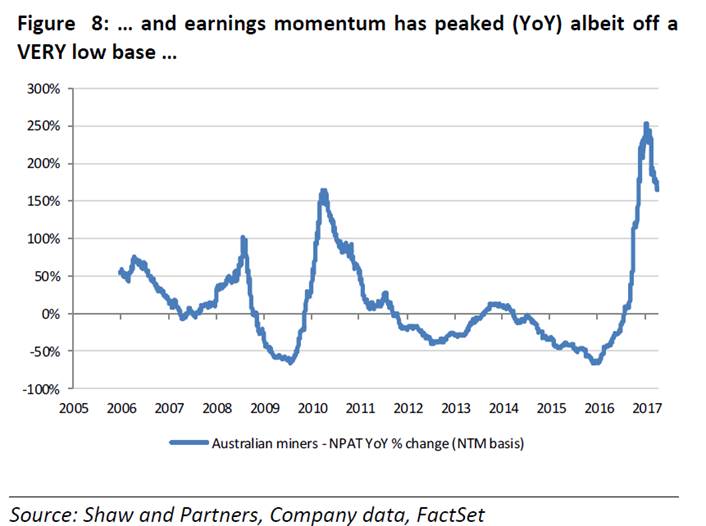
We now have Iron Ore prices a lot lower and Coal prices have rolled over, Oil is down and other base metals have yet to rally so the momentum in earnings has stalled – as the chart below shows. As Martin suggested, earnings expectations are now for +3% growth but that is coming on the back of a very strong period. So, still growth but slowing growth is the key takeout.
Question 2
"Hi MM, I have your email, Citi report about (selling of FMG). Am I better selling all of FMG now? before down to $3.90 because i have lot or FMG shares. many thanks
Regards TONY Chiu"
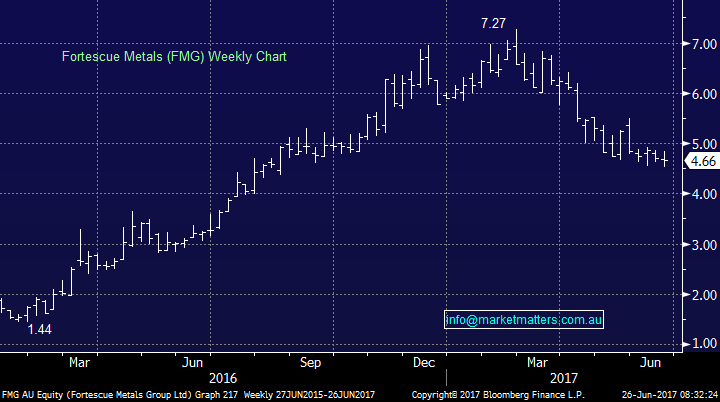
Thanks Tony, as you may know we own Fortescue in our portfolio from $4.665 and we like it here. We wrote about the Citi downgrade of the FMG share price to simply highlight that a lot of the bigger firms are often behind the curve when it comes to making calls, whether that be stocks, commodities, indices etc. As we mentioned above, the key is having an open mind and we certainly don’t discount what Citi have suggested, however in our view this bearishness in terms of iron Ore price assumption which was the basis for Citi’s downgrade has already been priced into the stock. We are therefore buyers of FMG rather than sellers like Citi. That’s what makes a market!
Fortescue Metals (FMG) Weekly Chart
Question 3
"Hi Guys Is FMG and WBC still a buy? As I haven't add these to my portfolio yet. Thanks Mike"
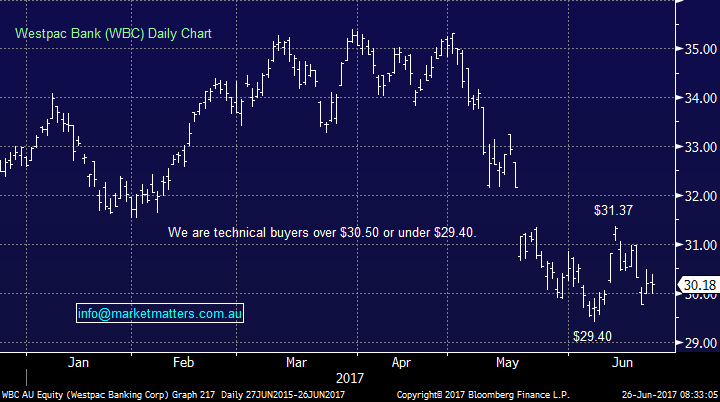
Thanks Mike, we’ve covered FMG above so we’ll review Westpac here. We have 5% in Westpac and will look to increase that holding by another 2.5% on a decline below $30 – so yes, we are comfortable with Westpac around current levels, we’re simply being fussy given our existing position (+ other bank holdings). WBC may or may not drop below $30 given the big decline the banks have already experienced + the seasonally strong period we’re about to enter. If it doesn’t then we’ve still got a reasonable exposure and will benefit from the rally. We’re comfortable holders of Westpac here despite getting into the stock slightly early at $32.70 – although we did pick up the dividend of 94cps share fully franked
Westpac Bank (WBC) Daily Chart
Question 4
"Hi. I enjoy your reports so down to earth and easy reading - no ifs or buts Thanks. I am heavily invested in the penny dreadful miners - and losing money. Would you be kind enough to let me have your thoughts esp. TNG where I have gone overboard. Cheers Clive Brown"
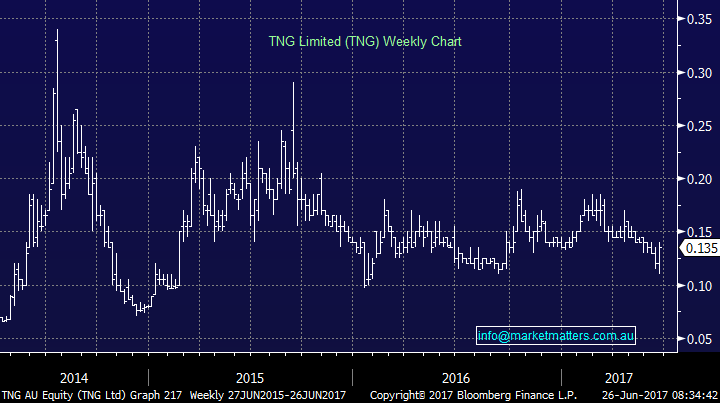
Thanks for the positive comments Clive. We tend to stay in areas of the market that we have an edge and unfortunately the smaller parts of the market are often too much of a gamble for us. For those interested, TNG is a diversified miner with a market capitalisation of $108m. Technically the stock is trading at the bottom of the range and some reasonable volume has come in recently, which is a positive. There’s also a good degree of buy side interest here and a run up in share price from 13.5c to 18c would not surprise.
TNG Limited (TNG) Weekly Chart
Question 5
"The announcement from QBE surely doesn't warrant a 10% write off on share price possibly 6% but is there any interest at buying at these levels from an analyst perspective? Thanks Peter"
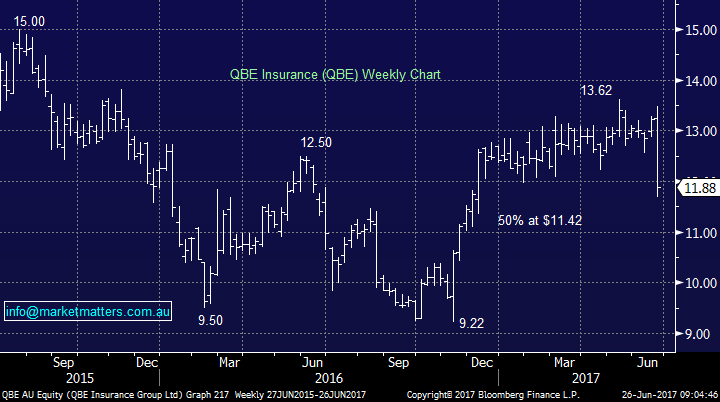
Thanks Peter – if we look solely at the impact to earnings then no given it’s about a 6% hit to shorter term numbers, but the reputational damage is harder to quantify. QBE has a long history of disappointing the market and the recent update is another example of this. Thinking about the ‘bear case’ for QBE, this stems from how complicated the business is, and the lack of visibility on earnings. There are many moving parts that dictate earnings of this company and they run a very complicated global model. We like the story given they’ve had a period of beating market expectations, global insurance premiums are improving (from a low base) and the investment portfolio is starting to kick goals. It’s been a long time since both of these trends have been improving in unison and QBE is an extremely leveraged play on both. As we suggested at the time, we’re buyers below $11.50 but sellers above $12.50. We own the stock from $10.49
QBE Insurance (QBE) Daily Chart
Question 6
"Hello MM, I currently hold a position in WBC after recent recommendations but would like your thoughts on the following; The latest Moody’s Report (Moody’s Investors Service) they have downgraded the long-term ratings for the major Australian banks (including Westpac Banking Corporation) by one notch to Aa3 from Aa2. It has revised the rating outlook for the major Australian banks to “stable” from “negative”. However, short term issuer credit ratings for the major Australian banks (including Westpac) were unchanged. Importantly, the change was driven by deteriorating credit conditions in Australia with elevated levels of debt and rapid credit expansion as they will most likely lead to credit quality problems later. I.e. rising household debt with low nominal wage growth has led to very high levels of household leverage, thereby increasing the household sector’s and the banking sector’s sensitivity to some potential risks. Based on Westpac Banking Corporation’s balance sheet at 31 March 2017 they recently announced 0.06% (6 basis points) levy in the 2017 Federal Budget will apply to approximately $615 billion of Westpac’s liabilities (‘Impacted liabilities’). Impacted liabilities would exclude certain prescribed items including approximately $174 billion of financial claims scheme eligible deposits. This Levy is expected to be tax deductible, but will not attract franking credits (Australian tax imputation credits). Based on the estimates, it would result in an additional cost of approximately $65 million after tax in H2FY17. On an annualized basis, that represents a cost of around $370 million or around $260 million after tax. However, the exact cost will depend on the final form of the new legislation passed and the composition of Westpac’s liabilities. The impact of the Levy for shareholders was estimated at around 8 cents per share, which represents 4.3% of dividends paid (188 cents per share) in 2016. Given the impact of new levy and increasing pressure on net interest margins in the sector, would it not be best to SELL at current levels of $29.77? Regards Dean"
Thanks Dean – a well thought out question. Two parts that are relevant to our view on Westpac.
Who will wear the impost? Banks have a good track record of passing on increased costs to consumers and this is likely in this scenario – whether it be 100% or a portion of it – banks will not wear it all. Assuming the federal bank levy doubles by 2020 to 12bps (states zero) but that the banks can pass on half the cost to customers the impact on Westpac is about a 3.2% hit to earnings over 3 years. Bank share prices have fallen significantly more than this and we think it has been built into the price.
In terms of net interest margins, these have been weak, but the outlook is improving. Higher interest rates will help here but banks are doing a good job of managing costs + forcing through out of cycle rate hikes. Lending growth is weak but they’re re-pricing their mortgage book effectively. Net interest margins should improve from here.
Question 7
"Question /comment you talk about the uk , german ,japan, swiss ,us ,spain etc markets I know the Australian pillars are 4 banks rio and bhp what are the pillars of the others or where is that sort of info found i would say Canada is probably mining but spain ??? any info appreciated regards. John"
Hi John – we get this data through Bloomberg. The UK is dominated by financials which account for 21% of the index, followed by consumer staples at 18% then energy at 13%. In Germany consumer cyclical stocks are the main weighting at 17% followed by Financials at 18% and Healthcare at 14%. In Spain the financials dominate with 39% weighting, followed by industrials at 17% and utilities at 12%. In terms of Canada, financials are the key sector at 38% followed by energy at 22% and materials at 9%.
Overnight Market Matters Wrap
· The energy sector in the S&P 500 gained on Friday night, but was down 3.87% for the week as investors worry that energy companies won’t be able to meet current forecasts.
· US flash manufacturing PMI fell to 52.1, below consensus and the lowest in nine months.
· Metals on the LME were mostly better, while gold, oil and iron ore are all trading higher.
· The June SPI Futures is indicating the ASX 200 to open marginally higher, towards the 5720 area this morning.
Disclosure
Market Matters may hold stocks mentioned in this report. Subscribers can view a full list of holdings on the website by clicking here. Positions are updated each Friday.
Disclaimer
All figures contained from sources believed to be accurate. Market Matters does not make any representation of warranty as to the accuracy of the figures and disclaims any liability resulting from any inaccuracy. Prices as at 26/06/2017. 8.00AM.
Reports and other documents published on this website and email (‘Reports’) are authored by Market Matters and the reports represent the views of Market Matters. The MarketMatters Report is based on technical analysis of companies, commodities and the market in general. Technical analysis focuses on interpreting charts and other data to determine what the market sentiment about a particular financial product is, or will be. Unlike fundamental analysis, it does not involve a detailed review of the company’s financial position.
The Reports contain general, as opposed to personal, advice. That means they are prepared for multiple distributions without consideration of your investment objectives, financial situation and needs (‘Personal Circumstances’). Accordingly, any advice given is not a recommendation that a particular course of action is suitable for you and the advice is therefore not to be acted on as investment advice. You must assess whether or not any advice is appropriate for your Personal Circumstances before making any investment decisions. You can either make this assessment yourself, or if you require a personal recommendation, you can seek the assistance of a financial advisor. Market Matters or its author(s) accepts no responsibility for any losses or damages resulting from decisions made from or because of information within this publication. Investing and trading in financial products are always risky, so you should do your own research before buying or selling a financial product.
The Reports are published by Market Matters in good faith based on the facts known to it at the time of their preparation and do not purport to contain all relevant information with respect to the financial products to which they relate. Although the Reports are based on information obtained from sources believed to be reliable, Market Matters does not make any representation or warranty that they are accurate, complete or up to date and Market Matters accepts no obligation to correct or update the information or opinions in the Reports.
If you rely on a Report, you do so at your own risk. Any projections are estimates only and may not be realised in the future. Except to the extent that liability under any law cannot be excluded, Market Matters disclaims liability for all loss or damage arising as a result of any opinion, advice, recommendation, representation or information expressly or impliedly published in or in relation to this report notwithstanding any error or omission including negligence.
To unsubscribe. Click Here


