Subscriber Questions (AGL, APT, BKL, CYB, JHG, NAB, ORE, VOC, TPM, WPL, WSA, Z1P)
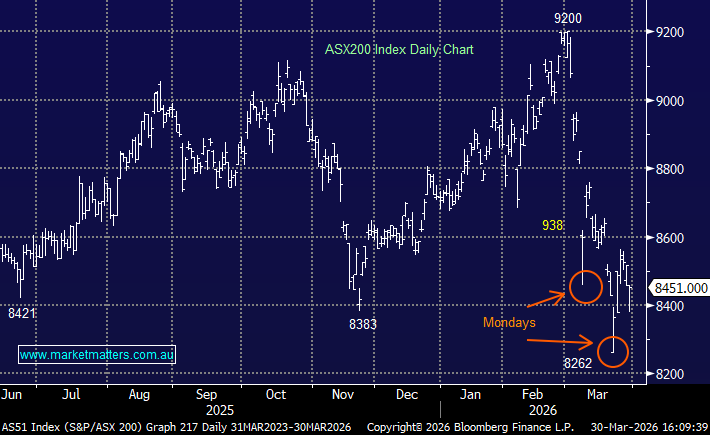
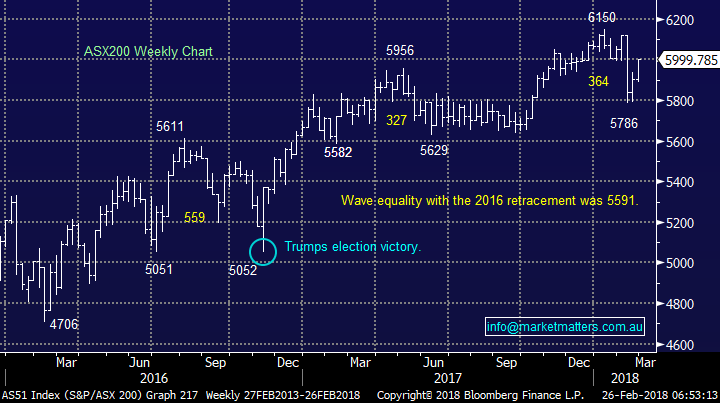
Time certainly does fly with March arriving on Thursday and the week of global panic for stocks rapidly becoming a distant memory. This morning the ASX200 is set to open around 6030, less than 2% below the years high – what sell off!! The steady pick up in performance from our banks last week may be a sign of the required market internals to push us through the years 6150 high – we think so.
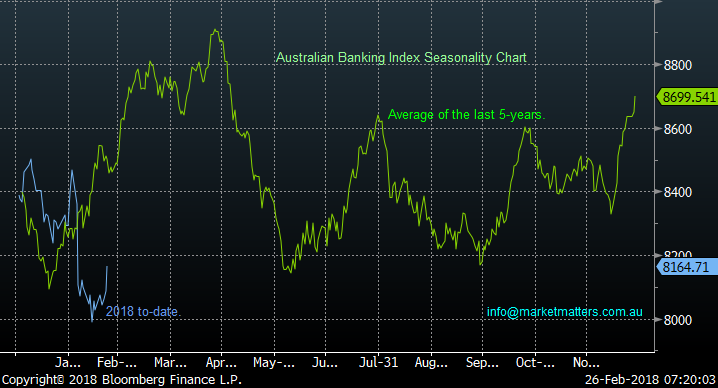
Seasonally local equities usually rally into the dangerous May period, remember the quote “sell in May and go away”. Over the last 10-years the data for the All Ordinaries is pretty consistent:
- Average return for March +1.4% and April is +1.6%.
- Followed by an average return in May of -2.2% and June -2.5%.
Hence at MM we are looking for levels to start increasing our cash position following our move to almost fully market committed during this month’s much publicised aggressive sell-off – remember from the Weekend Report our feeling at this stage is we are likely to be taking some profits in the resources sector first.
Our view at MM remains the recent aggressive sell-off by global equities is the warning sign we have anticipated for what will follow over the coming years but the time to jump off the train has not arrived, just yet.
ASX200 Weekly Chart
Australian Banking Index Seasonality Chart
The US Dow Jones gave us our short sharp “warning” correction that we having been waiting for following the strong Christmas rally, in fact it arrived about a month later than we expected.
- MM is looking for a choppy advance by US stocks to fresh all-time highs over the coming 1-2 months i.e. above the 2900 for the S&P500 i.e. over 5 % higher.
- We would not be surprised to see a ~3% pullback / consolidation from the current area.
Nasdaq Weekly Chart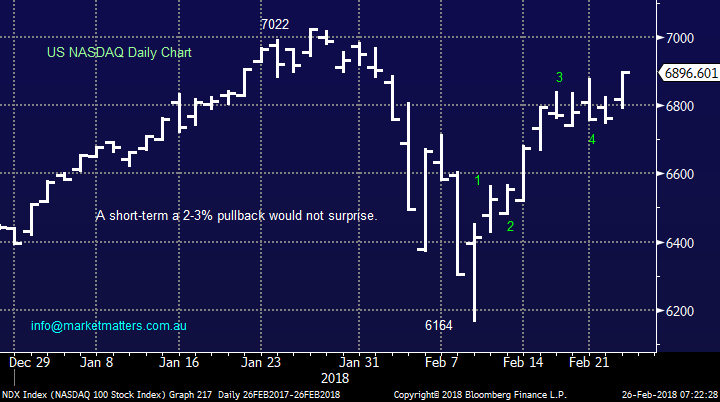
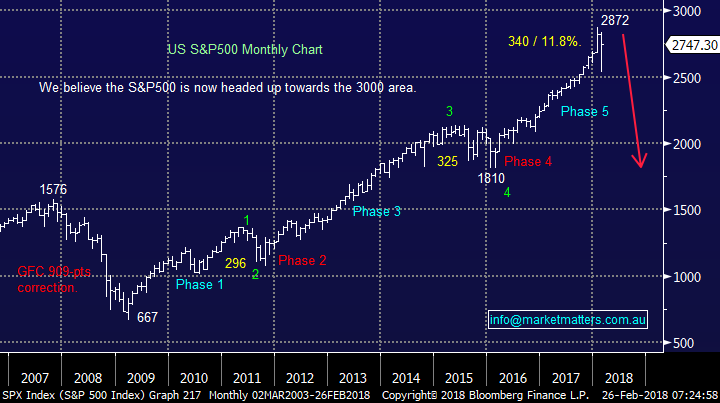
In the bigger picture unfortunately we continue to believe it’s almost “bon voyage” for the bulls as MM targets an eventual test of the 2016 lows as global share markets are positioned perfectly to correct the 9-year bull market, following the GFC.
- Corrections are a healthy facet of markets but certainly scare many investors when they are of say greater than -20% which has already occurred 3 times since Sydney hosted the Olympics.
US S&P500 Monthly Chart
This week we have received a record number of questions which importantly raised some excellent issues. Today I have answered 15 in total with 3 wrapped into one answer, please excuse the brevity of some answers but I must be finished before the market opens! Thanks for the questions / engagement, please keep them coming!
Question 1
“JHG has fallen from seemingly entrenched over $50 to under $45. What’s your current view of the stock and what drove the fall? There was heavy selling pressure recently” – Hugh F.
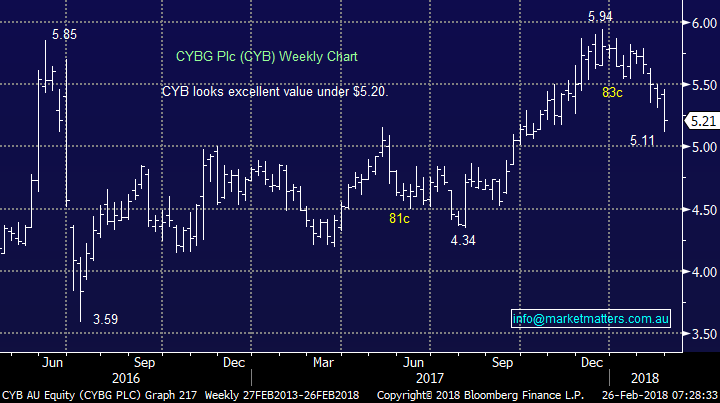
Hi Hugh, I believe it’s a reflection of the weakness in both the UK and European equities on a relative basis as opposed to an issue with the company – as you can see from the below UK facing CYB is also down almost 9% over the last month while our overall banking Index is down under 1%.
At this point in time we believe that European markets will regain their “mojo” over March / April enabling us to probably exit both of these stocks at far better levels.
Janus Henderson (JHG) Weekly Chart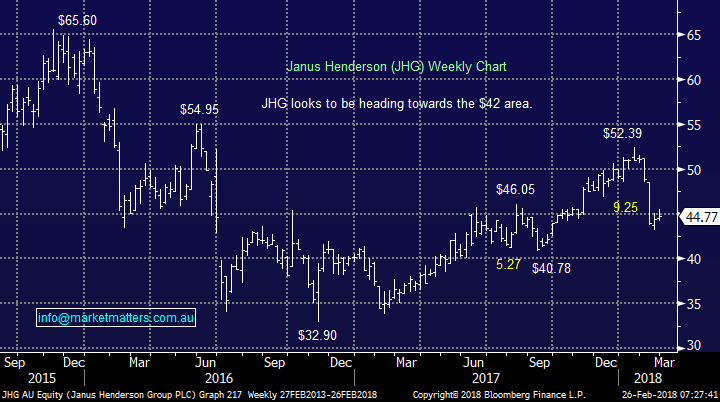
CYBG Plc (CYB) Weekly Chart
Question 2
Interesting in terms of the Lithium space as Elon Musk said they should be called Nickel batteries as they contain so much Nickel. Lithium, as it sounds so exotic, gets the banner headlines. How superficial - but then how many bother to ' scratch below the surface'. Could not resist that pun! Maybe catching up to you. Your reports are very concise with fun and no flab.” – Thanks Bruce.
Morning Bruce, thanks for the thumbs up and mention of lithium / nickel, markets of definite interest to MM.
- We still like lithium stocks and are enjoying our exposure via Kidman Resources (KDR) at this point in time. Market heavyweight Orocobre (ORE) still looks excellent targeting +$7.50 but prudence forces us to hold just the one position.
- We also like nickel stocks but our favourite Western Areas (WSA) did not reach our targeted ~$2.80 buy zone during the recent market sell-off.
Orocobre (ORE) Monthly Chart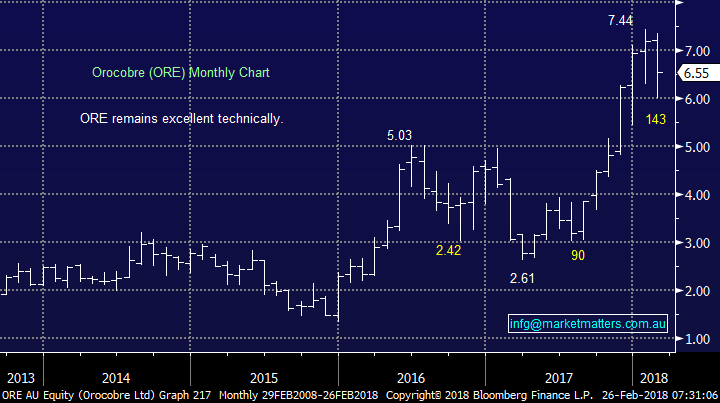
Western Areas (WSA) Monthly Chart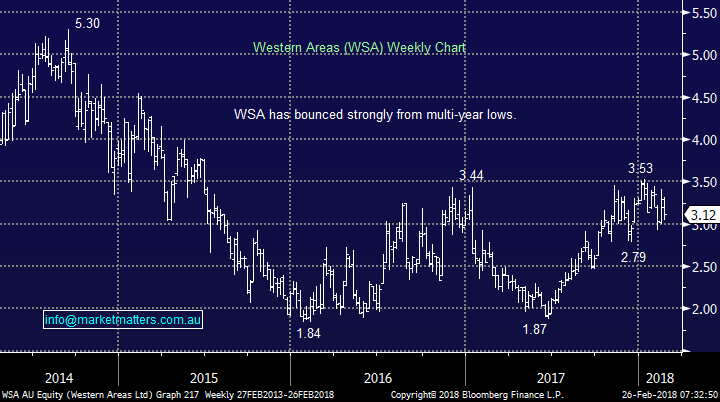
Question 3
“Thanks for your commentary on WPL today, however it's not totally clear to me what is going on with this stock, with it's capital raising. On the surface WPL, looks like a Buy at today's close of $28.63, since it's close to its 52 week lows, and also now somewhat below the valuations of those analysts I usually follow. I also note that your own entry for both MM portfolios was a little higher than today's close of $28.63. As I don't have any WPL currently, I am looking to pick up a small holding at Tuesday's open, at around the price of today's close, for a possible short term trade. Am I missing something here?.” - Thanks Gil W.
“Hi James, Is there a reason why didn’t you sell us out of WPL when you know there was going to be capital raising at a much lower price?” – Anthony
“Good Morning James Last week, WPL did capital raising. I do have a question about it. the temporary code WPLR is trading now, for example, I bought 1000 WPLR on the market, does it mean, I can purchase 1000 WPL later at $27 per share? also what is your thought about WPLR? will you plan to purchase it at right price? Also I am pretty happy to take the great ride on A2M on last week. my question is what your opinion about A2M in the next couple of months' trend, should I get off the train or keep on board to take next ride.” – Michael S.
Morning Gil / Anthony / Michael,
Woodside is frustrating at present with the share price basically ignoring a greater than 20% appreciation in the crude oil price. Our thoughts on WPL which hopefully answer the above 3 questions:
- We like WPL under $29 and can easily see a rally back towards $31, especially as we still target the $US70/barrel area for crude oil.
- Last week the stock traded ex-dividend US49c fully franked (~62.5c local currency) so the shares effectively closed above $29 on Friday.
- Shareholders like ourselves on the 19th of February are entitled to 1 for 9 shares at $27 (not including the dividend) – this reduces our average entry down by just over 40c. Hence we believe the position can go back into the black but not significantly.
- Unfortunately we were unable to exit after the rights issue was announced at $27 because the stock was suspended from trading and proceeded to open down ~$2 where we would have been buyers if we were not already long.
- However our concern is we believe that the $US / resources trend of the last 2-years is close to completion hence we do not envisage holding WPL in 6-months’ time.
- Buying the WPLR rights is simply buying the ability to purchase more stock at $27. Assume someone bought rights $1.77 on Friday, then the effective entry price is the $1.77 plus $27 for the shares. – the dividend is not included. Some traders may simply trade the rights as it provides a more aggressive exposure to movements in the underlying share price.
PS Michael, A2M had a fantastic report and we are waiting for the stock to settle down before evaluating good risk / reward buying opportunities i.e. while the stock soared close to 40% last week it also closed over 14% below its spike high.
Woodside Petroleum (WPL) Monthly Chart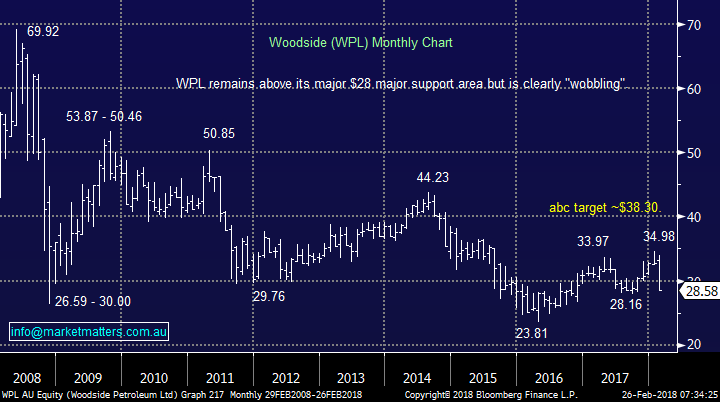
Question 4
“ Good Morning, Question on APX, can you shed any light on the ongoing price drop. Everything I read seems to point to it being a good long term share.” - Thanks Geraldine R.
Hi Geraldine, I believe you may have the code wrong as APX is soaring not falling. The tech company which specialises in artificial intelligence is in acquisition mode and clearly the market likes its strategy for now. At this stage its not a stock MM follows closely so I cannot pass on our opinion.
Appen Ltd (APX) Weekly Chart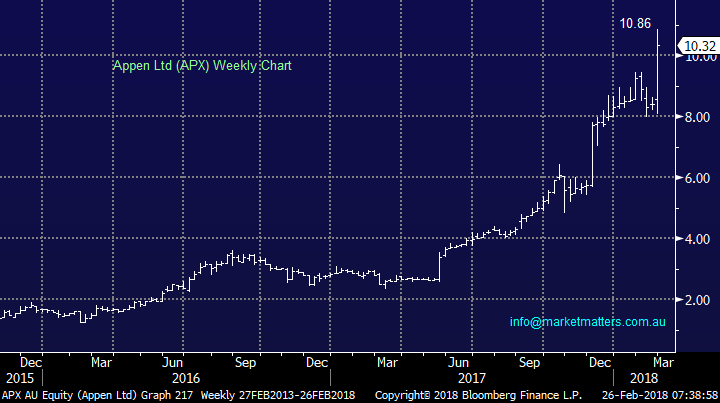
Question 5
“ I am a new subscriber and have been very impressed with your notes & reports. What are your thoughts on Vocus Group Limited (VOC) as a speculative buy? Shares hammered yesterday on a poor result and interim dividend cut, VOC minus 41.59% 1 year return, we hold Telstra (TLS) also down 28.78%.
VOC has John Ho on the board (Joined last month) who is also a non-executive Director & Chairman Of Bellamy’s (BAL), Bellamy’s share price is up 207.96% over the last 12 months, Can Mr Ho weave his magic at Vocus?” - Thank you Chris T.
Morning Chris, a very well throughout and articulated question, and timely, given VOC have just parted ways with their CEO, Geoff Horth - a positive move I think given we had little confidence in Geoff. That said, over the past few years VOC has been our nemesis - the stock that cost us most in terms of performance in recent years. We took a loss on our position but in short, I’m glad we're out!
The telco’s are having an awful time at present but investors should remember markets are cyclical. MM’s thoughts on the sector:
- From an investment perspective we like TLS into fresh recent lows under $3.30.
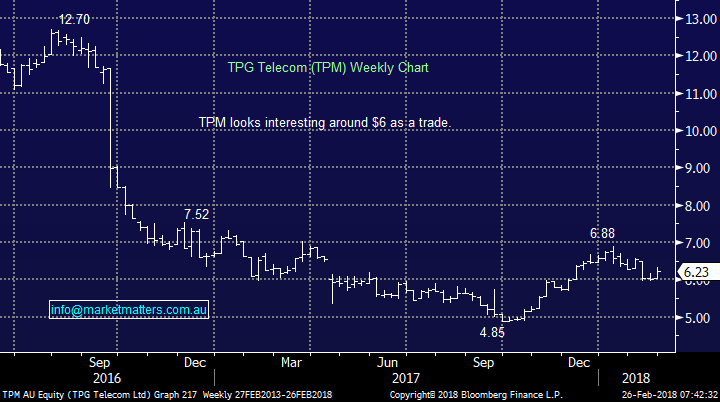
- As a speculative buy we prefer TPG Telecom close to $6.
Our left-field view is that the Telcos may outperform over the next 12-18 months but not exciting buy signals have been generated yet.
Vocus Ltd (VOC) Daily Chart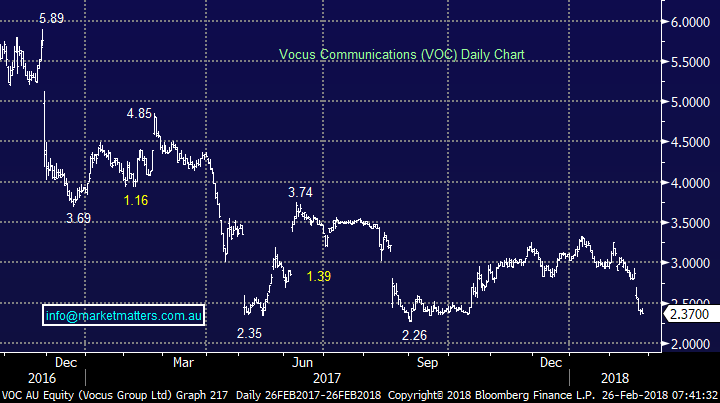
TPG Telecom (TPM) Weekly Chart
Question 6
“Hi, You have mentioned your current goal is to turn to a higher proportion of cash in May and that you will put that cash in US$. How will you convert or hold US$?” – Regards Merrelyn S.
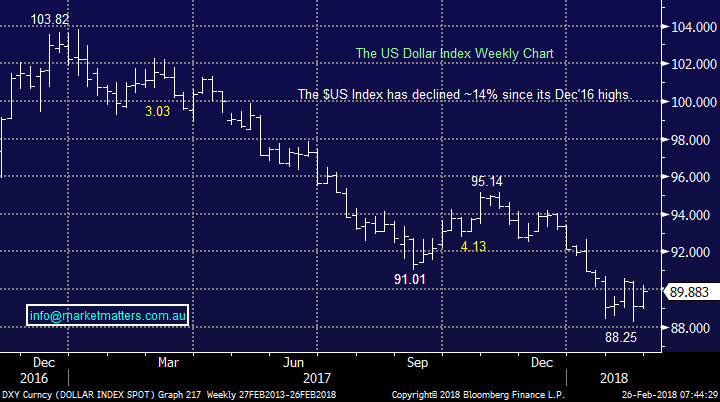
Hi Merrelyn, great question because we obviously have not been clear enough with our explanation around our $US strategy:
- We intend to have little or no resources exposure once we believe the $US has bottomed in 2018, ideally under 88.
- We may buy some $US earning stocks but at this point in time as a group they are expensive.
- We are looking at holding some of our funds as we increase our cash position in an US ETF – this will be explained by email / alert as the time approaches / arrives.
$US Index Weekly Chart
Question 7
“Hi, can you please add a section to the bottom of the report showing when the dividends are going to be paid for all the shares on we may have through your recommendations Please leave say last 5 you have recommended to sell as sometime I ride the bump and sell on the next rise.” -
Regards Paul H.
Hi Paul, an excellent point, we are looking at adding a number of bells and whistles to the service over the next 6-months but pure opinion / ideas in a timely manner will always take priority over information that can be googled so it may take a little while, I appreciate the patience.
Question 8
“Good afternoon Editor, Without being derogatory, it appears that when the market is running hard in an upward direction, your emails come thick and fast. However, you appear to stay on the "communication sidelines" when volatility increases. Or am I missing emails?” - Regards. DAVID
Hi David, I think you must be confusing our service with someone else! We deliver the same number of emails daily whether the markets falling or rallying, whether we are right or wrong. I would go so far as to say when the markets falling our reports are more detailed, I know I arrive at work closer to 6 than 7....
Question 9
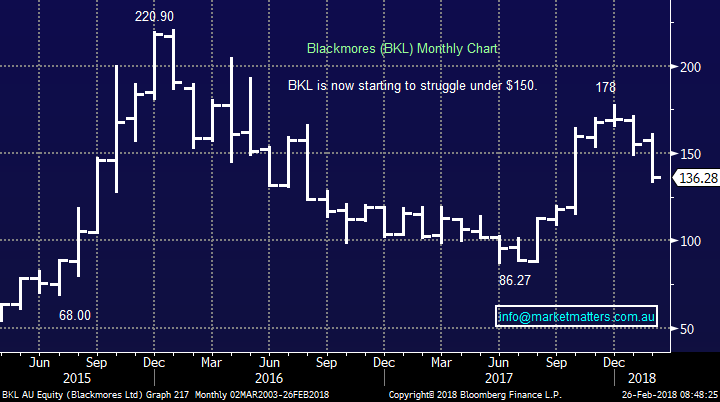
“Hello, I hope this is the approved way of contacting you. As a new subscriber I am not sure. Please let me know if I have erred. Why is there no mention of Blackmores in today’s newsletter. They reported today, and I’m sure many of my fellow MM subscribers would be interested in learning your take on the result.” - Thanks, Bev H.
Hi Bev, sorry we should have given BKL some airtime in the afternoon note. The shares were sold off well over 10% despite a 20% lift in the first half’s profit, plus a 15% increase in dividend to $1.50 the problem was primarily expectations were too high. What did catch our eye is BKL are struggling to receive money from its China partners with an increase in doubtful debt provisions to $2.8m, this gets noticed when a stock is valued on over 30x.
We are neutral BKL at current levels, it’s been a rollercoaster of late and with the overall market at such an interesting junction it's hard to get excited about Blackmores
Blackmores (BKL) Monthly Chart
Question 10
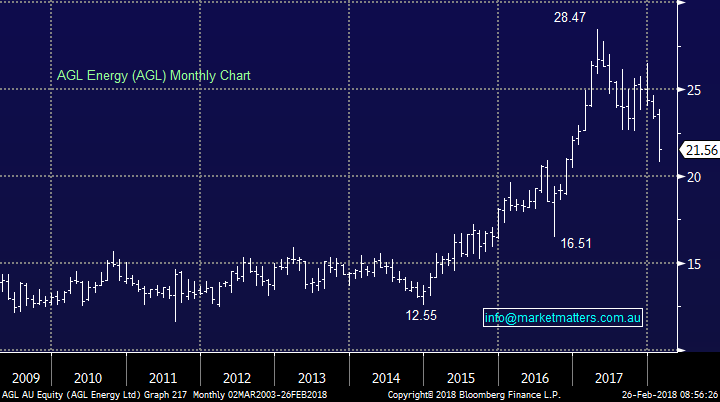
“Subscriber Questions AGL What’s wrong with AGL? Last December Goldman Sachs on CommSec recommended them as a buy. And they are still on the list. Your thoughts would be appreciated.” – Alex R.
Morning Alex, I’m sorry but AGL is firmly in the “yield play sector” which is exactly what we have been preaching to avoid as global interest rates increase.
We have no interest in any of these stocks including Sydney Airports (SYD) and Transurban (TCL) at this point in time, although they are likely to catch a relative bid tone if we are correct and the market turns down aggressively later in the year.
AGL may be tempting if it’s around $20.50 and the ASX200 is up at say 6250 in April.
AGL Energy (AGL) Monthly Chart
Question 11
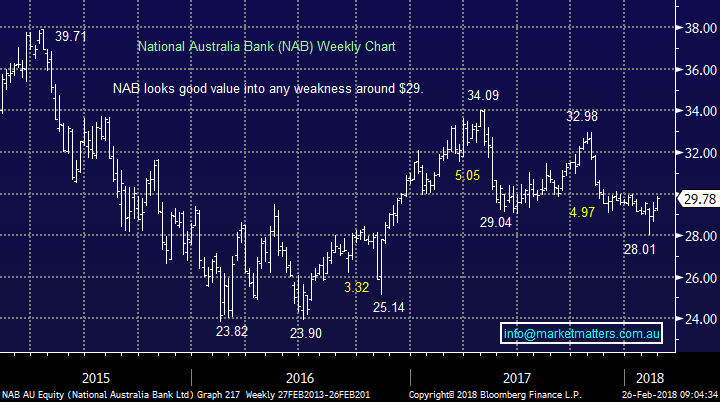
“Hi, I am holding NAB in my growth portfolio and was wondering how to sell the stock after the dividend is paid. IE so many stocks drop rapidly once a dividend is paid....how do they get the dividend and get out prior to the stock falling so far?? What is the procedure??” – Wayne S.
Hi Wayne, not possible i'm afraid - it would be great if it was! A stock trades cum-dividend or ex-dvidend, or in other words, with the dividend or without.
Some good news is what NAB usually does moving forward, consider over the last 10-years:
- The average gain in March is +5.35% and April its +2.6% - this potentially makes the drop on a $1 fairly palatable.
National Australia (NAB) Weekly Chart
Question 12
“Hi I am a relatively recent subscriber and 100 % happy with the quality of your reports, market commentary and recommendations. I am retired and primarily invest to earn income and take some capital growth to top up income when needed. My portfolio is 50 % bank hybrids, and the balance is banks, resources , oil and gas and quality mid-caps. Recently you have been reinforcing the point that it will be time to hop off the 'train' when the ASX 200 nears 6250 points. Will you please comment whether this advice applies to the Growth Portfolio which seems to be more a trading portfolio, or does it also apply to the Income Portfolio to the same or lesser extent...after all if the market were to fall 20% then it seems it will be time to reduce all equity holdings whether held for income or growth and buy them back later.” - Thankyou Russell.
Morning Russell, Our blanket thoughts:
- The Growth Portfolio – will move heavily to cash, plus probably ETF’s short the market and long $US.
- The Income Portfolio – we will probably leave / increase hybrids, may hedge with a negative ETF, and are especially likely take the money on our BHP, FMG and WPL holdings. In short, we'll have a more defensive yield focus with a skew towards floating rate securities (which is the case now)
Question 13
“Hi MM Enjoy reading your reports and insights. For the weekend update it would be great to include a technology sector especially given the performance of FANG in the US. Afterpay and NextDC have advanced well in the past few weeks.” – Thanks Nathan IS.
Hi Nathan, I agree but we also are receiving many comments to shorten the reports and make them more concise. We do try and look at the FANGS’s around once a month and the NASDAQ daily which is almost the same thing.
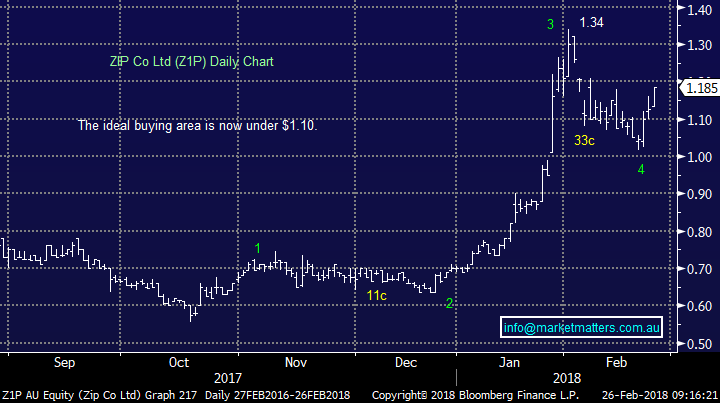
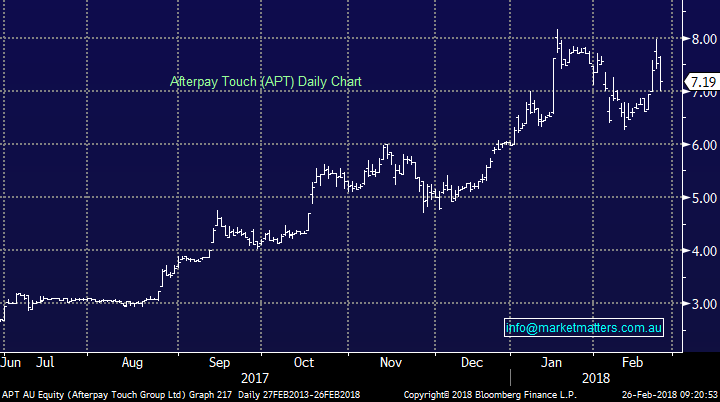
We have talked about Z1P over recent weeks and currently like the stock down around $1.10, it feels better risk / reward than AfterPay (APT) over $7.00
ZIP Money (Z1P) Daily Chart
AfterPay (APT) Daily Chart
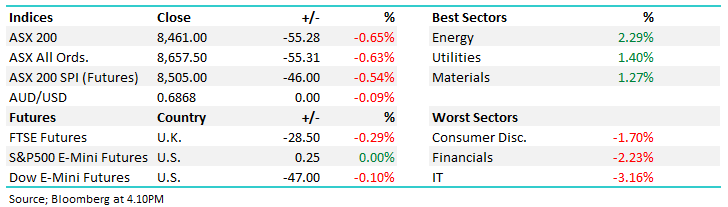
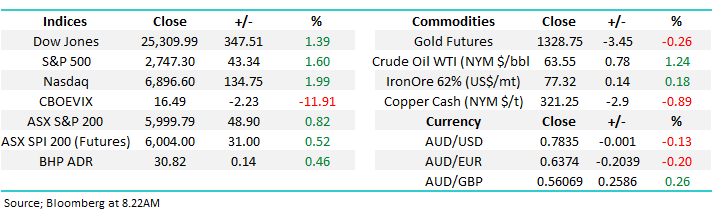
Overnight Market Matters Wrap
· The US equity markets rallied last Friday, led by the tech. heavy, Nasdaq 100 up nearly 2% as investors poured funds back in after comments by the US Fed placing them at ease about the current interest rate hikes anticipation this year.
· Commodities were mixed with oil continuing its recent recovery, crude oil rallied 1.24% higher to US$63.55/bbl., having been as low as US$58.07/bbl. earlier this month. Iron ore likewise traded firmer, while Gold and base metals lost some ground.
· Companies trading ex-dividend today are Aurizon (AZJ), CC-Amatil (CCL), Steadfast Group (SDF) & Wesfarmers (WES).
· The March SPI Futures indicating the ASX 200 to open 36 points higher, testing the 6035 level this morning.
Disclosure
Market Matters may hold stocks mentioned in this report. Subscribers can view a full list of holdings on the website by clicking here. Positions are updated each Friday, or after the session when positions are traded.
Disclaimer
All figures contained from sources believed to be accurate. Market Matters does not make any representation of warranty as to the accuracy of the figures and disclaims any liability resulting from any inaccuracy. Prices as at 26/02/2018. 8.13AM
Reports and other documents published on this website and email (‘Reports’) are authored by Market Matters and the reports represent the views of Market Matters. The MarketMatters Report is based on technical analysis of companies, commodities and the market in general. Technical analysis focuses on interpreting charts and other data to determine what the market sentiment about a particular financial product is, or will be. Unlike fundamental analysis, it does not involve a detailed review of the company’s financial position.
The Reports contain general, as opposed to personal, advice. That means they are prepared for multiple distributions without consideration of your investment objectives, financial situation and needs (‘Personal Circumstances’). Accordingly, any advice given is not a recommendation that a particular course of action is suitable for you and the advice is therefore not to be acted on as investment advice. You must assess whether or not any advice is appropriate for your Personal Circumstances before making any investment decisions. You can either make this assessment yourself, or if you require a personal recommendation, you can seek the assistance of a financial advisor. Market Matters or its author(s) accepts no responsibility for any losses or damages resulting from decisions made from or because of information within this publication. Investing and trading in financial products are always risky, so you should do your own research before buying or selling a financial product.
The Reports are published by Market Matters in good faith based on the facts known to it at the time of their preparation and do not purport to contain all relevant information with respect to the financial products to which they relate. Although the Reports are based on information obtained from sources believed to be reliable, Market Matters does not make any representation or warranty that they are accurate, complete or up to date and Market Matters accepts no obligation to correct or update the information or opinions in the Reports.
If you rely on a Report, you do so at your own risk. Any projections are estimates only and may not be realised in the future. Except to the extent that liability under any law cannot be excluded, Market Matters disclaims liability for all loss or damage arising as a result of any opinion, advice, recommendation, representation or information expressly or impliedly published in or in relation to this report notwithstanding any error or omission including negligence.
To unsubscribe. Click Here