Sector rotation is the key to coming weeks (TLS, BHP, NAB)
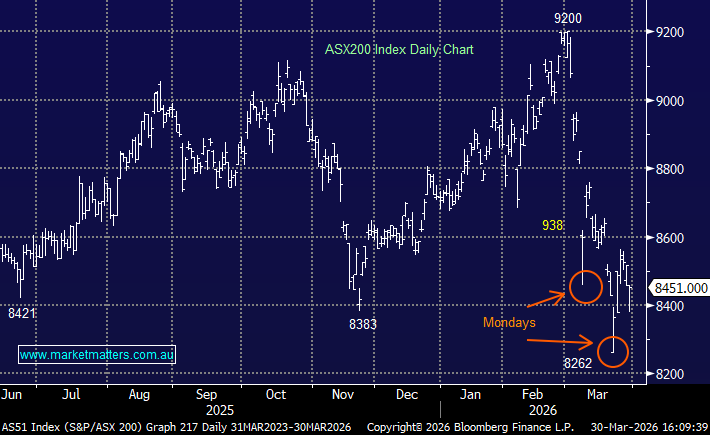
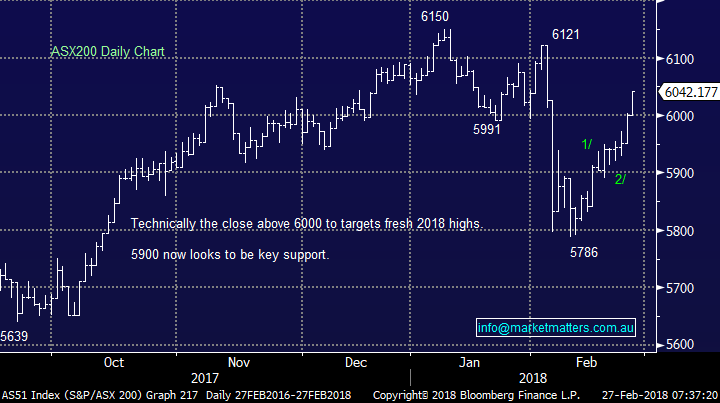
The ASX200 looks set to open around 6075 today, now only around 75-points / 1.2% below the high of 2018, of course the Dow being up a storming 400-points helps the equities cause. Our short-term bullish view at MM remains firmly intact:
· MM is targeting the 6250-6300 region for the ASX200 in March / April for the ideal opportunity to significantly increase our cash position.
As we expected the recent volatility / yield tantrum has rapidly become a distant memory and our view at the start of 2018 remains intact and will continue to be the core to our investment decisions until further notice:
1. Stocks would have a ”warning style” correction for a short-term buying opportunity in early 2018 – this obviously occurred and we bought aggressively.
2. Many global indices will make fresh all-time highs between now and the end of April before its time to get off the stock market express and reassess.
Today’s report focuses on 5 prominent sectors of the ASX200 to gauge how best to play this, what we believe, will be a final surge by global stocks.
ASX200 Chart
1 Banking Sector
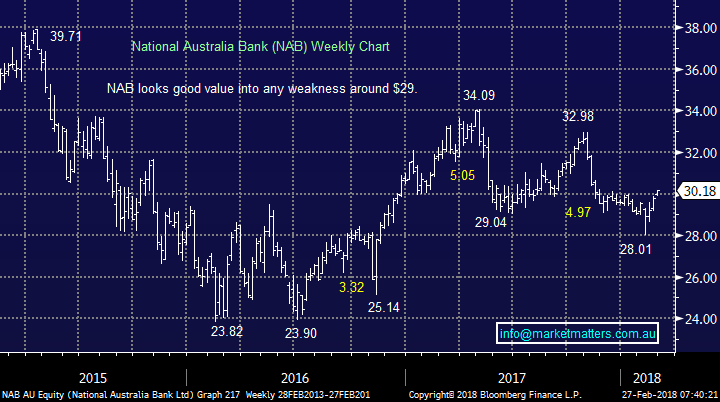
We are approaching the strongest 2-months of the year for our Banking Sector which is easy to comprehend as the majority of the sector pay very attractive dividends in May. Let’s consider our favourite of the big 4 banks as March looms, over the last 10-years;
· NAB has gained +5.35% in March and +2.65% in April i.e. a combined +8%.
Local banks have been under relative pressure since late 2017 as investors have become increasingly concerned with the Australian housing market and our economy – the RBA have not felt close to raising interest rates, unlike the US, a higher rate environment which assists banks profitability. However last weekend housing auctions were strong and if this is repeated in the next few weeks I can see many of the recent “bank sellers / shorters” buying back their positions.
We are bullish Australian banks in the next 2-months.
National Australia Bank (NAB) Chart
2 Real Estate Sector
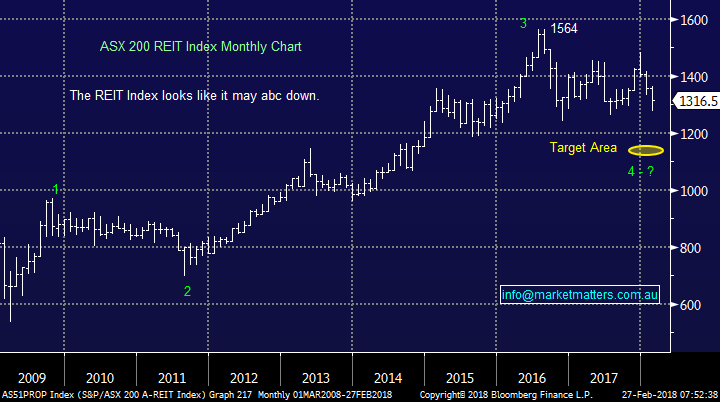
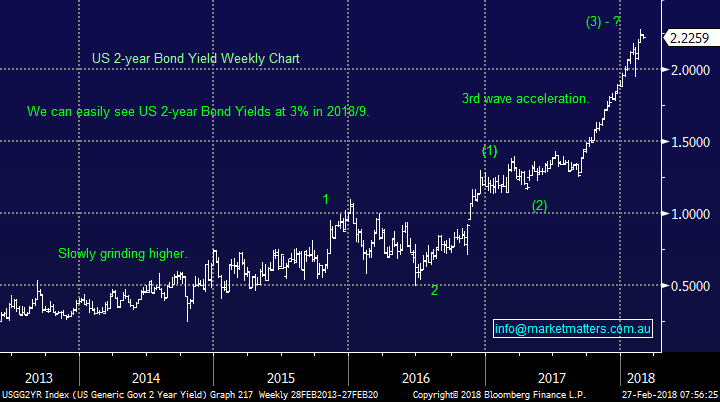
It may be tempting at times to buy “cheap” stocks just because they have fallen significantly but the question that should always be asked is always why? In this case it’s because global bond yields are rising, a major negative for the Real Estate Sector. A few quick observations at this point in time:
1. Bond yields remain very bullish but they may be getting a touch ahead of themselves and we can see US 2-years back towards 2% which should help the sector short-term.
2. This should also help the overall stock market in general.
3. However our ultimate target for the Real Estate Sector is over 10% lower.
Hence, we believe investors should not buy the struggling Real Estate Sector in 2018.
NB This opinion also applies to other “yield play” stocks like Sydney Airports (SYD) and Transurban (TCL).
ASX200 Real Estate Sector Chart
US 2-year Bond Yields Chart
3 Resources Sector
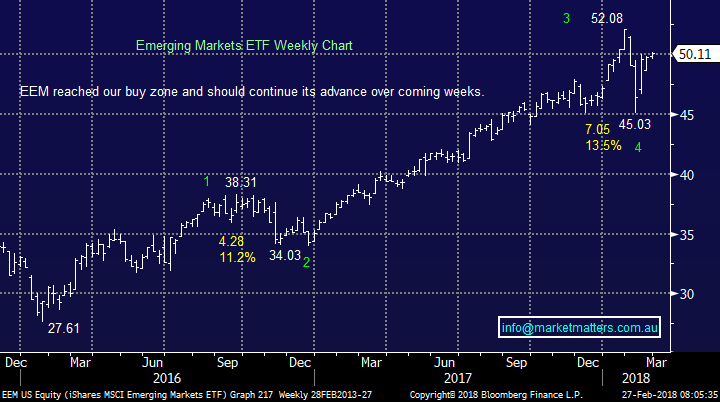
The Australian resources sector is highly correlated to the Emerging Markets Index (EEM) which is arguably our favourite market at this point in time. While we expect further consolidation of the coming weeks we are bullish targeting gains of up to 10%.
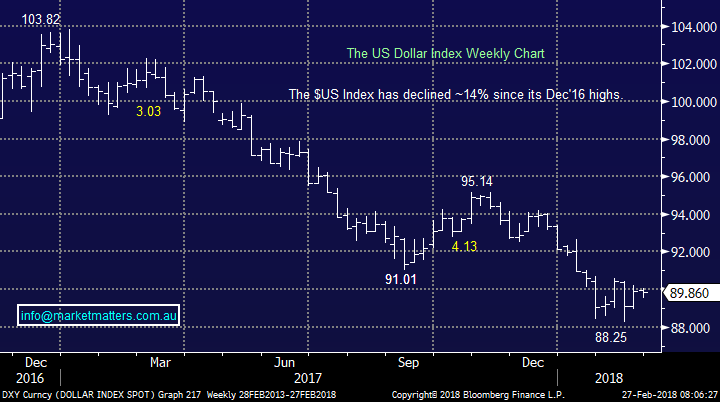
We will be concerned with this bullish outlook if the $US Index starts breaking back over 91 but last night’s reversal lower is supportive of the sector for now.
When we look at the usual seasonal pattern for the heavyweights BHP and RIO during March / April we must take into account their respective dividends – BHP 55c on the 8th of March and RIO $2.28 on 1st of March, both fully franked. Over the last 10 years:
1. BHP usually falls -1% in March and gains +3.9% in April.
2. RIO usually gains +0.1% in March and + 3% in April.
Noticeably lower normal performance than NAB even after dividends. We reiterate our “trade” from the Weekend Report:
· We are buyers of NAB and sellers of BHP on a relative performance basis over the coming few months – for the more sophisticated investor.
To the average investor NAB is a better buy here and moving forward BHP is likely to be sold first out of our Growth Portfolio.
Emerging Markets (EEM) Chart
$US Index Chart
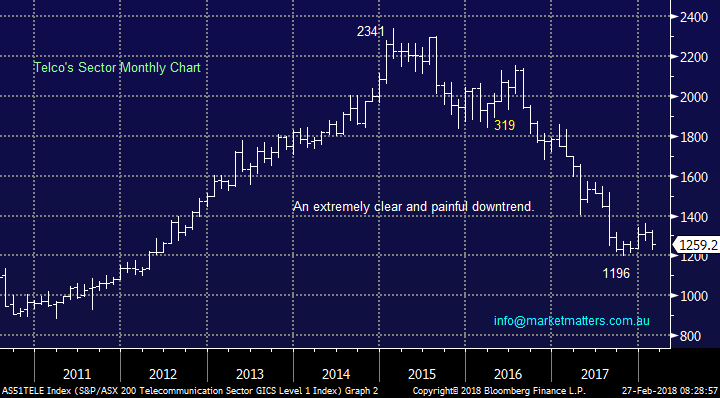
4 Telco Sector
We all know about the carnage that has unfolded in the Telco Sector – a 49% plunge from the highs of 2015 and to rub salt into the wound while global equities rallied strongly. Catching a falling knife is very dangerous when investing and statistically not a prudent course of action but conversely, we do know that markets are cyclical unless an industry goes the way of the dodo, or say Kodak.
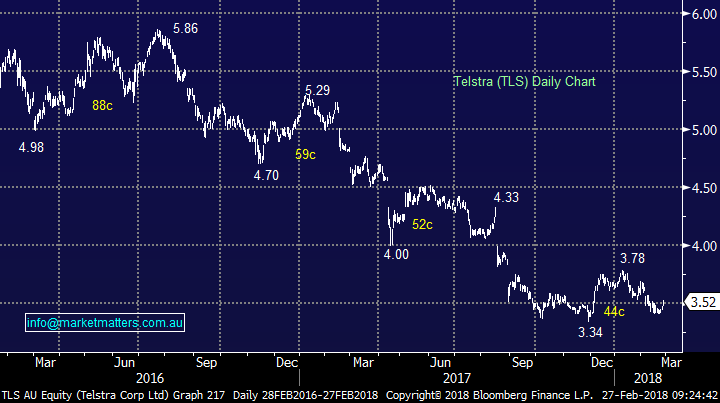
We believe that from a risk / reward perspective Telstra (TLS) is no longer a clear sell and is worth buying into weakness. TLS is currently paying a 6.2% fully franked dividend which would become 6.8% at say $3.25.
Also, the Telco’s usually outperform during bear markets / significant corrections which is what we believe is on the horizon for stocks.
Hence, we are unlikely to sell our TLS into weakness but ideally we will still be on the sell side ~$3.80 – TLS goes ex-dividend tomorrow for 11c fully franked.
ASX200 Telecommunications Sector Chart
Telstra (TLS) Chart
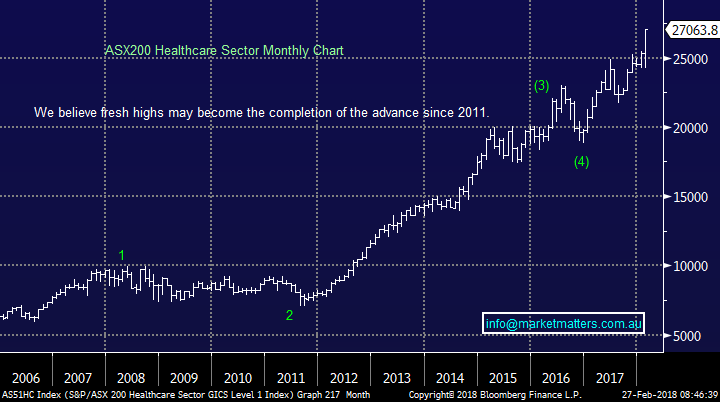
5 Healthcare Sector
Our local Healthcare Sector is a tricky one because of a few conflicting fundamentals:
1. In a rising interest rate environment, the Healthcare Sector / high PE stocks usually underperform.
2. March and April are usually positive for say CSL but they are far from standout months, unlike banks.
3. The market is undoubtedly complacently long this sector.
4. If we are correct and the $US is approaching a major low many of this sector should benefit e.g. CSL and ResMed.
We have to remain neutral at present.
ASX200 Healthcare Sector Chart
Conclusion (s)
No major change, at this stage we are comfortable with our short-term bullish call targeting new all-time highs from a number of global indices in the next few months.
On the sector level we prefer banks to resources moving forward and are likely to take some profits in this area first in March / April assuming our view unfolds.
Against the crowd we like Telstra under $3.20 after tomorrows 11c fully franked dividend.
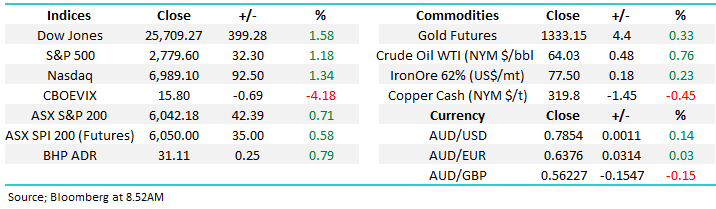
Global Indices
US Stocks
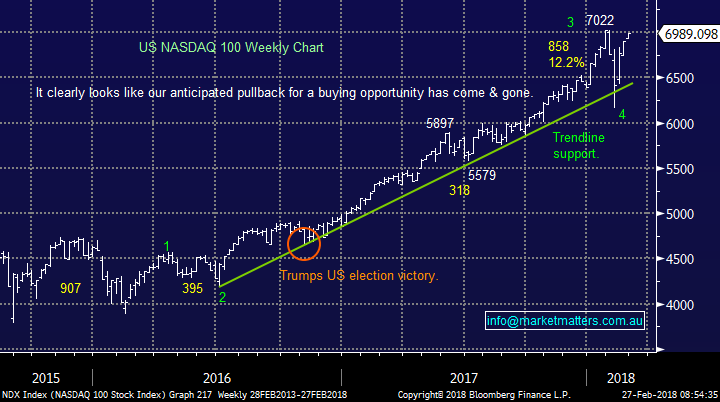
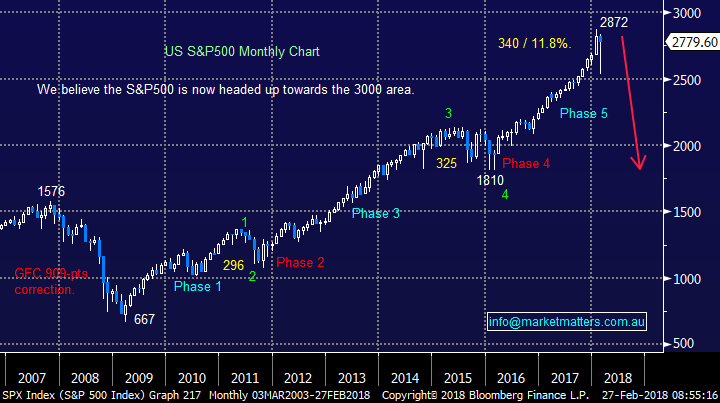
Our target area for the recent aggressive weakness by US stocks was reached and to-date has been rejected strongly, we remain bullish targeting ~7% gains from this mornings close.
Noticeably the NASDAQ is now only 0.5% below its all-time high.
US NASDAQ Chart
US S&P500 Chart
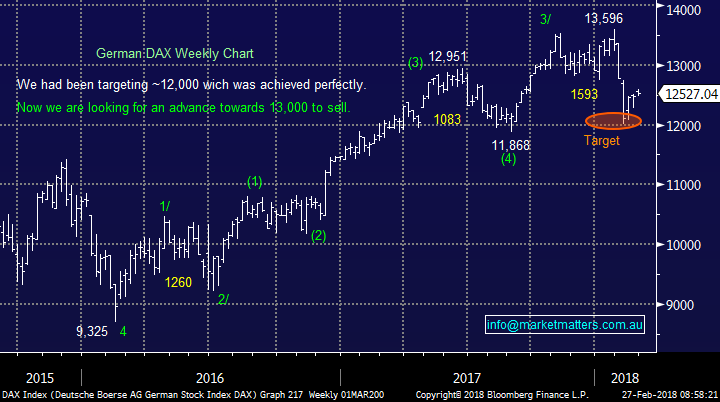
European Stocks
No major change we are now targeting around the 14,000-area for the German DAX before we will turn bearish i.e. a rally from here of over 10%! However, at this stage European equities have not embraced the global “bounce” by stocks but we believe they will moving forward.
German DAX Chart
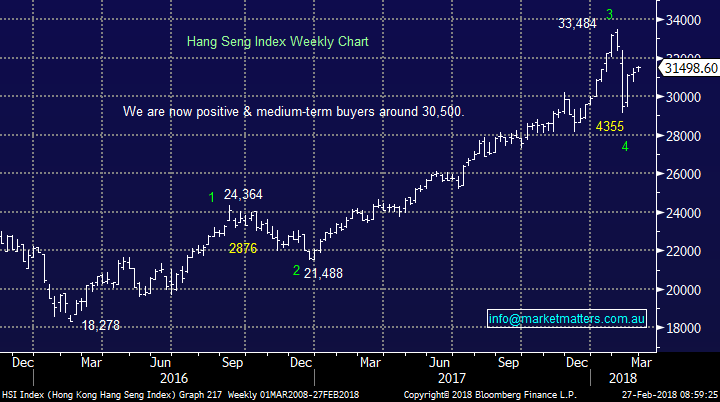
Asian Stocks
Similarly, to western global indices the Hang Seng corrected over 10% and looks good from a risk / reward perspective under 30,500.
The more time the market can spend between 31,000 and 32,000 the stronger it will become.
Hang Seng Chart
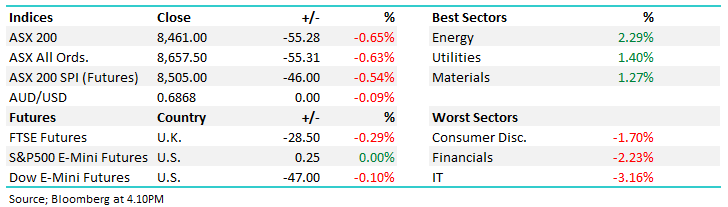
Overnight Market Matters Wrap
· The US equity markets continued to climb on its game of snakes and ladders, with the S&P 500 back above the levels from the February sell-off as investors wait for the first comments from US Federal Reserve Chairman, Jerome Powell tonight.
· On the commodities front, gold, crude oil and iron ore futures firmed higher, while copper was the weakest link.
· The March SPI Futures indicating the ASX 200 to open 35 points higher this morning testing the 6080 level.
Disclosure
Market Matters may hold stocks mentioned in this report. Subscribers can view a full list of holdings on the website by clicking here. Positions are updated each Friday, or after the session when positions are traded.
Disclaimer
All figures contained from sources believed to be accurate. Market Matters does not make any representation of warranty as to the accuracy of the figures and disclaims any liability resulting from any inaccuracy. Prices as at 27/02/2018. 8.13AM
Reports and other documents published on this website and email (‘Reports’) are authored by Market Matters and the reports represent the views of Market Matters. The MarketMatters Report is based on technical analysis of companies, commodities and the market in general. Technical analysis focuses on interpreting charts and other data to determine what the market sentiment about a particular financial product is, or will be. Unlike fundamental analysis, it does not involve a detailed review of the company’s financial position.
The Reports contain general, as opposed to personal, advice. That means they are prepared for multiple distributions without consideration of your investment objectives, financial situation and needs (‘Personal Circumstances’). Accordingly, any advice given is not a recommendation that a particular course of action is suitable for you and the advice is therefore not to be acted on as investment advice. You must assess whether or not any advice is appropriate for your Personal Circumstances before making any investment decisions. You can either make this assessment yourself, or if you require a personal recommendation, you can seek the assistance of a financial advisor. Market Matters or its author(s) accepts no responsibility for any losses or damages resulting from decisions made from or because of information within this publication. Investing and trading in financial products are always risky, so you should do your own research before buying or selling a financial product.
The Reports are published by Market Matters in good faith based on the facts known to it at the time of their preparation and do not purport to contain all relevant information with respect to the financial products to which they relate. Although the Reports are based on information obtained from sources believed to be reliable, Market Matters does not make any representation or warranty that they are accurate, complete or up to date and Market Matters accepts no obligation to correct or update the information or opinions in the Reports.
If you rely on a Report, you do so at your own risk. Any projections are estimates only and may not be realised in the future. Except to the extent that liability under any law cannot be excluded, Market Matters disclaims liability for all loss or damage arising as a result of any opinion, advice, recommendation, representation or information expressly or impliedly published in or in relation to this report notwithstanding any error or omission including negligence.
To unsubscribe. Click Here