Remain open-minded – the next few years will be volatile but opportunities will abound!
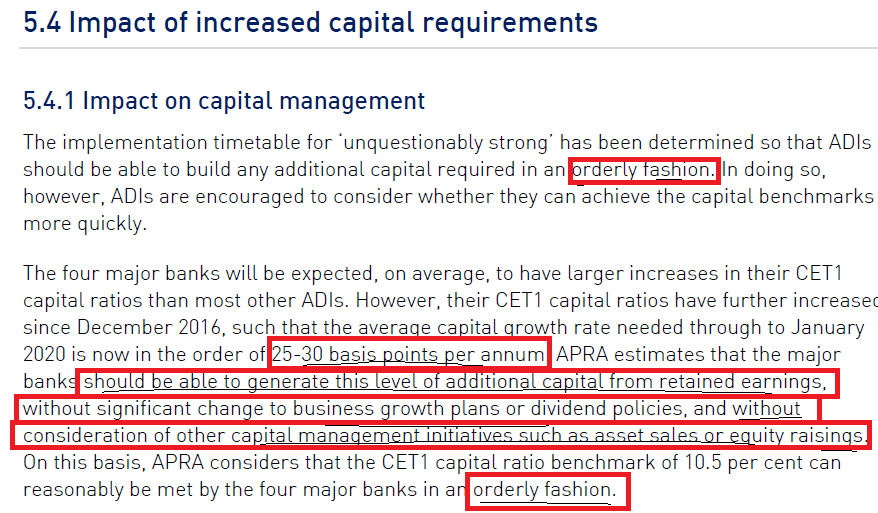
Before we get into the report today, APRA just out with information on Bank Capital Requirements.
From the release. This should be well received by the market today and be a net positive for the banks.
…back to usual programming….
The local stock market was simply whacked yesterday but not necessarily for the reasons that many columnists will be touting overnight. The 68-point / 1.2% decline was undoubtedly very aggressive but we do not believe the selling in equities was due to comments by the RBA concerning the future direction of Australian interest rates:
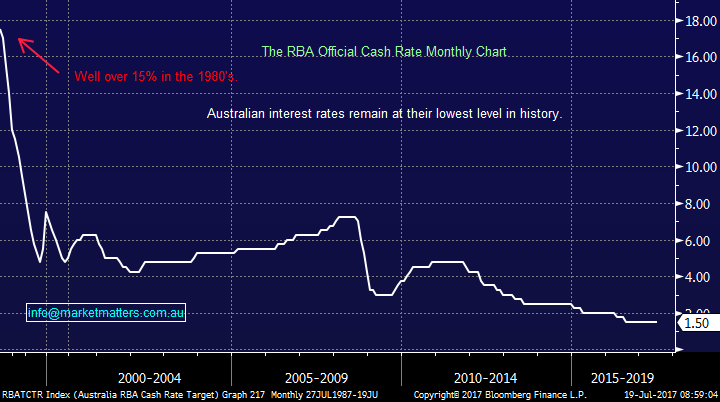
1. The RBA are pegging 3.5% as the new normal for the Australian cash rate i.e. a whopping 8 interest rate increases above today's level!
2. The RBA has essentially moved into line with the hawkish stance of the central banks from Britain, Canada, Europe and the US, ironically just as markets are doubting their economic optimism.
The RBA’s strong message sent the $A soaring to its highest level since May 2015, interestingly when the ASX200 was testing the psychological 6000 level, and the Dow was over 3000-points / 17% beneath this mornings close. Also, Australian 3-year bond interest rates not surprisingly rallied back over 2% but remained below levels earlier in March. We remain positive Australian 3-year bond rates targeting close to 2.5% - a bullish view we have held for well over 6-months.
When we consider the significant decline in global interest rates since the 1990’s a move back to 3.5% is only a blip on the radar compared to interest rates close to 18%! However, it is greater than a doubling of interest rates from today’s lowest level in history and hence will undoubtedly harm some investors who have over leveraged themselves in recent times believing interest rates would remain low forever.
RBA Official Cash Rate Monthly Chart
Moving back to yesterday’s savage decline our reasoning for the sell-off not being down to the RBA we believe is extremely well founded:
1. The RBA minutes were released at 11.30am catapulting the $A up over 1c in a matter of minutes implying the news was a surprise but the ASX200 was already down ~50-points i.e. most of the damage had occurred prior to the RBA minutes.
2. The banking and insurance sectors fell more than the overall market yet they benefit from increasing interest rates, assuming we do not see a surge in bad debts.
3. The real estate sector closed positive while the classic “yield play” stocks like Sydney Airport and Transurban fell by less than the broad index.
The selling was focused in the SPI futures market where the volume was up over 30% from the recent average i.e. Professional investors / traders were dumping the broad Australian stock market.
While the RBA comments did not help our market neither did the much-discussed pending APRA ruling on our banks, average result by RIO or President Trump’s continued struggle to repel Obamacare but perhaps investors are just getting out before a pullback to test the 5500 area!
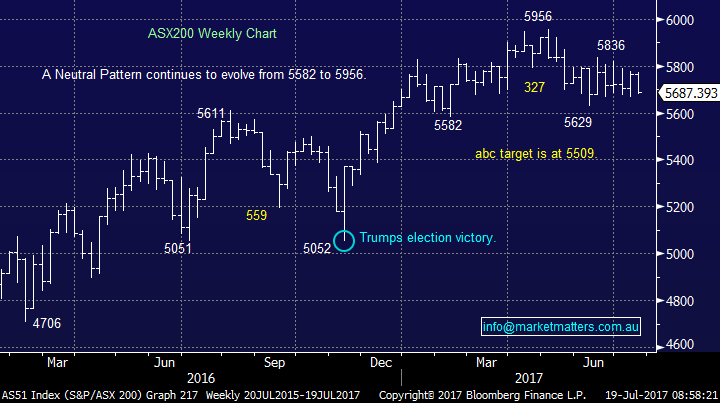
With only 9-trading days remaining this July, the statistical fact remains a break of the current 5629-5836 trading range should occur shortly and follow through for at least 50-points. Our “gut feel” remains we will get a relief rally in the dominant banking sector following this morning’s announcement around APRA’s funding requirements but the negative momentum is clearly building.
ASX200 Weekly Chart
US Stocks
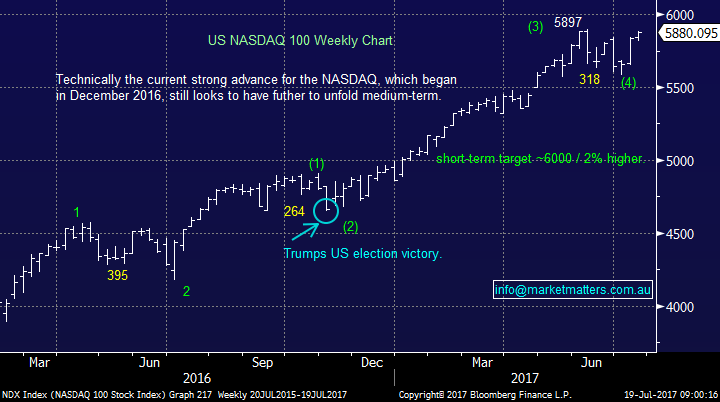
Last night US equities closed basically unchanged after shaking off early weakness courtesy of Donald Trump’s ongoing failure to repel Obamacare. The ability of the market to shake off any bad news illustrates its current underlying strength. There remains no change to our current view, we are targeting fresh all-time highs for the NASDAQ around 6000, now only ~ 2% higher, before a decent correction to test the early July lows.
US NASDAQ Weekly Chart
European Stocks
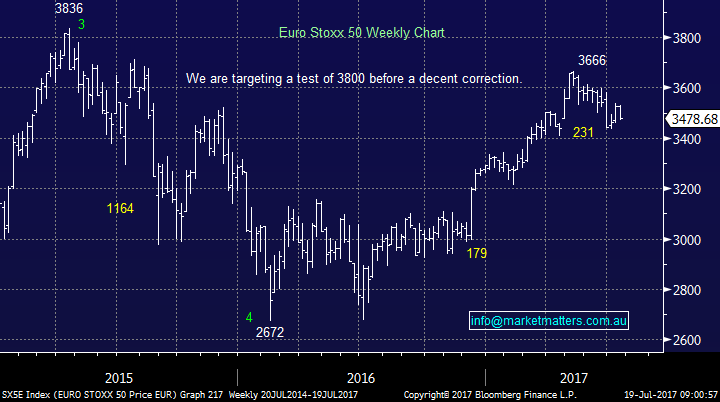
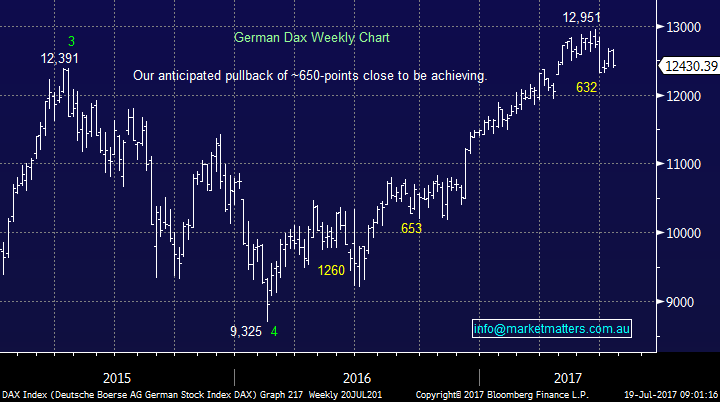
The Euro Stoxx 50 is very aligned with the NASDAQ ideally targeting a break over 3700 prior to a decent correction but conversely the German DAX is targeting further weakness before it hits our target area. The key question is “if” the US and European stocks can make these anticipated fresh 2017 highs will the local ASX200 finally manage to eke out some gains?
Euro Stoxx 50 Weekly Chart
German DAX Weekly Chart
The title of this morning’s report revolves around remaining open-minded, a mantra we have been preaching all of this year. Today we have briefly looked at 4 stocks / sectors to emphasize this point.
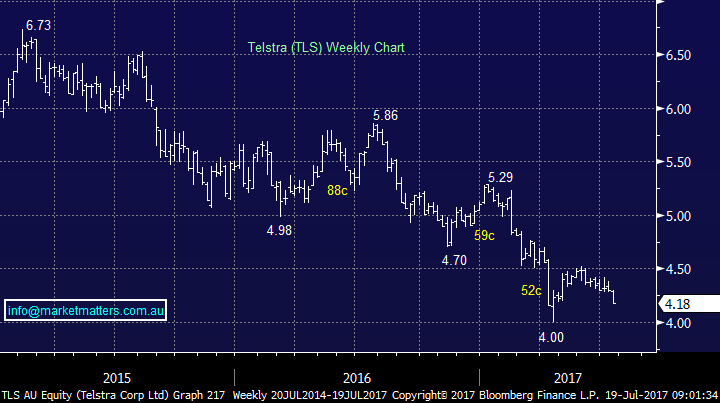
1 Telstra (TLS) $4.18
Telstra has unfortunately been a shocking investment for many people who thought that a high dividend yield meant you could not go too far wrong. Telstra has declined close to 40% over the last 2-years and our technical target for TLS is now ~$3.70, a further 11% decline – we actually believe TLS will be forced to cut its dividend in the not too distant future.
Telstra (TLS) Weekly Chart
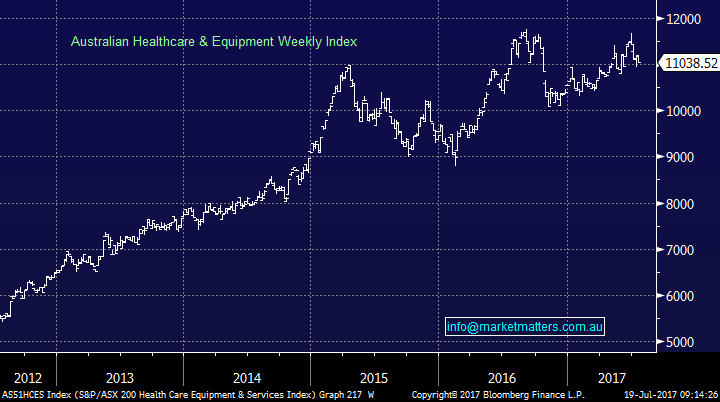
2 Healthcare stocks
Yesterday we discussed CSL but today have switched our attention to the broad Australian healthcare sector. The sector has undoubtedly been a great place to be invested since the GFC with gains of over 170% compared to the ASX200 rallying only 92% at its absolute best. However, in markets all good things usually come to an end, it’s just a matter of when.
We are targeting a 25% correction for the Australian healthcare sector over coming years, this coincides with our view of rising interest rates that often hinders the performance of high valuation stocks / sectors.
Australian Health Care Equipment & Services Index
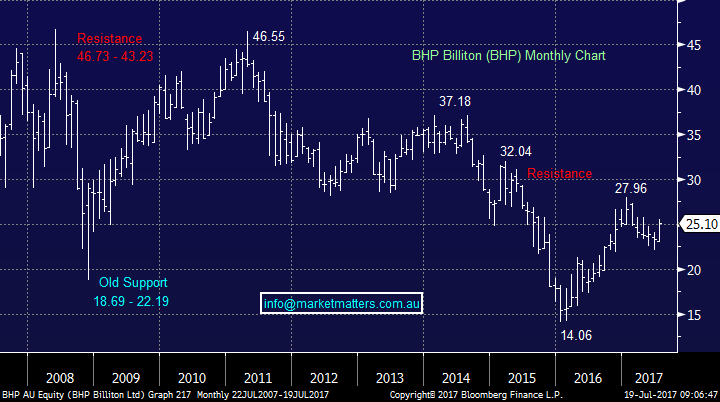
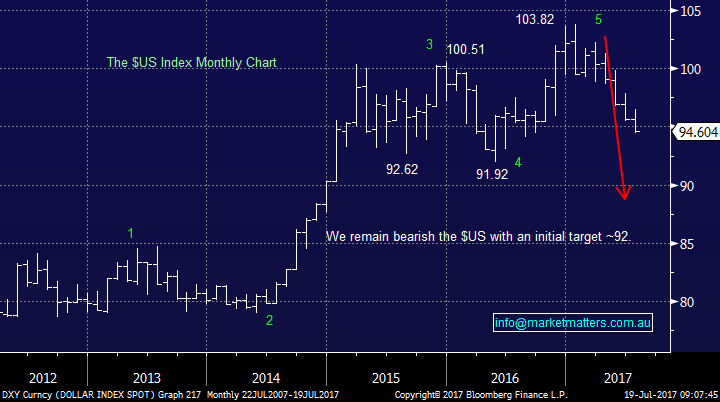
3 Resource stocks and the $US
Resource stocks were hammered between 2011 and 2016 with the “big Australian” BHP falling an incredible 70% at its worst. However, since early 2016 we have seen a great recovery in the sector with BHP almost doubling in price. We remain both bullish and long BHP targeting a test of $30, a further 20% advance.
One of our main calls at the start of 2017 was for weakness in the $US, a call very out of line with the market at the time as US interest rates were clearly on the rise. As the $US continues to fall we actually now feel there is good chance that a major high has been seen for the $US, if this unfolds expect ongoing outperformance from resource / gold stocks.
BHP Billiton (BHP) Monthly Chart
$US Index Monthly Chart
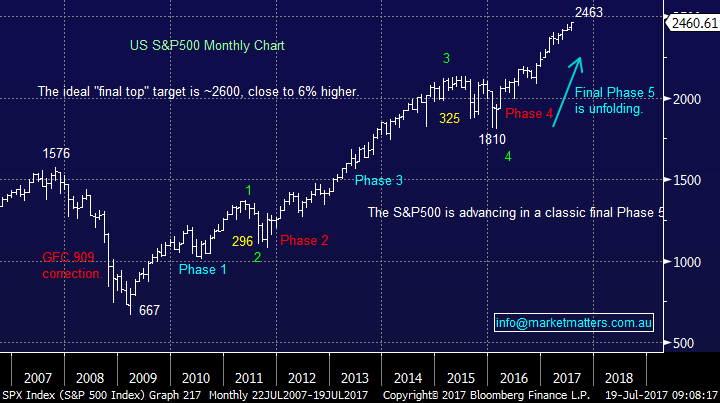
4 US stocks
No surprises here, remember we are targeting a +20% correction from US stocks over coming years, but from higher levels.
S&P500 Monthly Chart
Conclusion (s)
Remain open-minded the following few years will have numerous opportunities for the flexible investor who accepts the rate of change is increasing and sector rotation is needed for optimum returns.
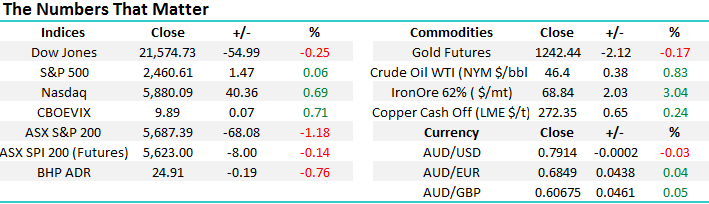
Overnight Market Matters Wrap
• A mixed close was experienced overnight in the US markets, with the tech heavy, NASDAQ the standout, up 0.69%.
• The Telcos led the weakness in the US overnight, with the financials also contributing after Goldman Sachs disappointed investors with their earnings which closed down 2.6%. Expect some weakness in Macquarie Group (MQG) today.
• BHP is expected to underperform the broader market today, after ending its US session down an equivalent of -0.75% overnight.
• A weak open is expected in the ASX 200, testing the 5680 level as indicated by the September SPI this morning.
Disclosure
Market Matters may hold stocks mentioned in this report. Subscribers can view a full list of holdings on the website by clicking here. Positions are updated each Friday.
Disclaimer
All figures contained from sources believed to be accurate. Market Matters does not make any representation of warranty as to the accuracy of the figures and disclaims any liability resulting from any inaccuracy. Prices as at 19/07/2017. 8.00AM.
Reports and other documents published on this website and email (‘Reports’) are authored by Market Matters and the reports represent the views of Market Matters. The MarketMatters Report is based on technical analysis of companies, commodities and the market in general. Technical analysis focuses on interpreting charts and other data to determine what the market sentiment about a particular financial product is, or will be. Unlike fundamental analysis, it does not involve a detailed review of the company’s financial position.
The Reports contain general, as opposed to personal, advice. That means they are prepared for multiple distributions without consideration of your investment objectives, financial situation and needs (‘Personal Circumstances’). Accordingly, any advice given is not a recommendation that a particular course of action is suitable for you and the advice is therefore not to be acted on as investment advice. You must assess whether or not any advice is appropriate for your Personal Circumstances before making any investment decisions. You can either make this assessment yourself, or if you require a personal recommendation, you can seek the assistance of a financial advisor. Market Matters or its author(s) accepts no responsibility for any losses or damages resulting from decisions made from or because of information within this publication. Investing and trading in financial products are always risky, so you should do your own research before buying or selling a financial product.
The Reports are published by Market Matters in good faith based on the facts known to it at the time of their preparation and do not purport to contain all relevant information with respect to the financial products to which they relate. Although the Reports are based on information obtained from sources believed to be reliable, Market Matters does not make any representation or warranty that they are accurate, complete or up to date and Market Matters accepts no obligation to correct or update the information or opinions in the Reports.
If you rely on a Report, you do so at your own risk. Any projections are estimates only and may not be realised in the future. Except to the extent that liability under any law cannot be excluded, Market Matters disclaims liability for all loss or damage arising as a result of any opinion, advice, recommendation, representation or information expressly or impliedly published in or in relation to this report notwithstanding any error or omission including negligence.
To unsubscribe. Click Here


