Real Estate Stocks get clobbered, just the start?
The ASX200 had a horrible day yesterday, as investors unfortunately embraced the negative combination of the Moody’s downgrade of our banks and the RBA’s growing concerns around Australia’s property market, which is leading to escalating household debt. History tells us at MM that major economic problems rarely evolve when they are continually flagged. While we believe Australian housing has probably peaked for the next few years, we feel a sideways drift is more likely than a crash. Although “off the plan” apartments are likely to feel the brunt of any price correction.
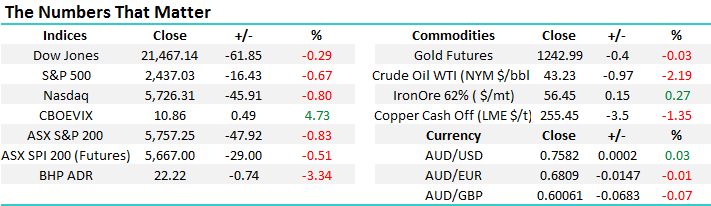
The sharp 48-point fall quickly ended our short-term positive bias for local stocks with an initial test of 5725 likely, but we cannot rule out a test of 5600 and potentially the 5500-area. Remember, we are still in the seasonally weak May-June period for local stocks and the average pullback since the GFC over this period is 6.9%, which targets 5545 i.e. 3.7% below Tuesday’s close. The ASX200 has fallen 3.3% since May 1st, while the Dow has rallied 2.7%, raising concerns as to how local stocks will perform if / when global equities eventually have a correction.
We remain comfortable holding 10% of the MM portfolio in cash and are considering taking profits on 2 further positions, to increase our cash position short-term.
ASX200 Daily Chart
US Stocks
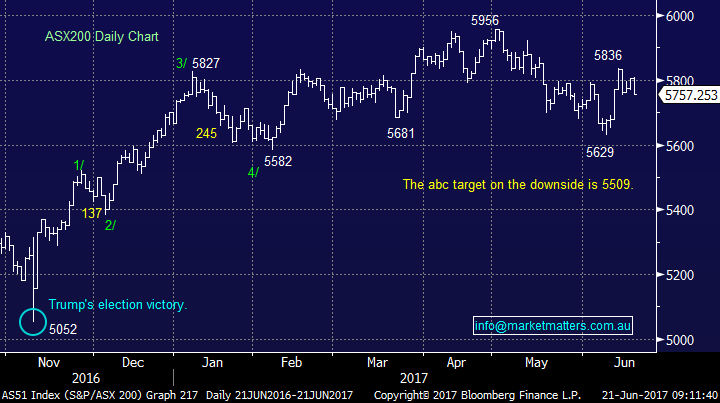
Last night, US equities fell the most in a month with energy and discretionary spending stocks bearing the brunt of the selling. Although no sell signals have been generated over recent weeks, our “gut feel” is the most likely direction for US stocks over coming weeks is now down, with our preferred scenario a 4-5% correction.
US S&P500 Weekly Chart
European Stocks
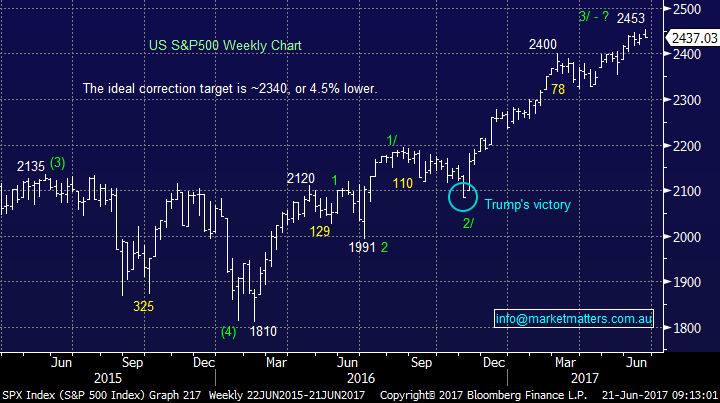
When we look closely at the German DAX the picture is very similar to that of US stocks. We are targeting a pullback of ~5% towards the 12,300 area, before a resumption of its strong bull market.
German DAX Weekly Chart
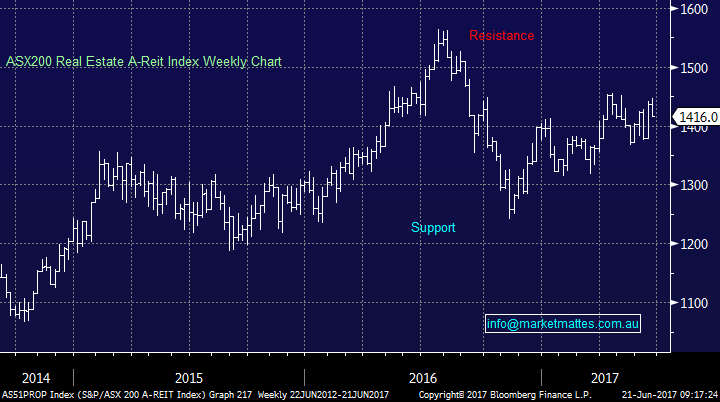
Real Estate Sector
Yesterday, the Australian real estate sector was clobbered almost 2%, with red spread across the whole sector. While the sector has garnished plenty of publicity over recent months, the overall index has traded in relatively tight neutral trading range since mid-2015 with the extremes around 20% apart.
Our feeling towards real estate may not be as bearish as many, but we acknowledge its likely to take many months / quarters before investors again become comfortable with exposure here hence, like retail, we believe it’s simply easiest to avoid these stocks in general for now. Today we are going to have a quick look at the best and worst stocks within the sector.
ASX200 Real Estate A-Reit Index Weekly Chart
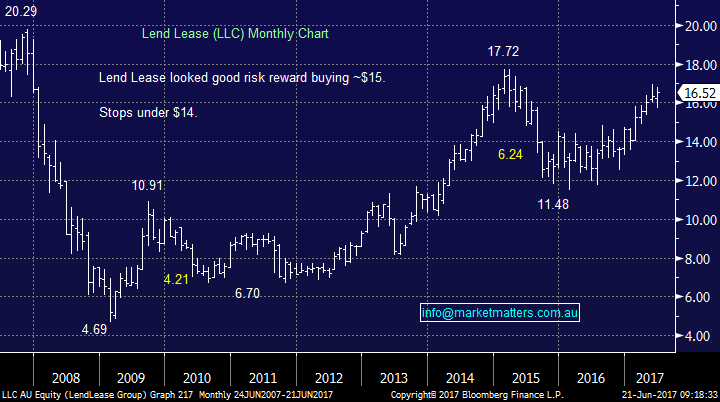
The best performing stock in the sector over the last year is Lend Lease (LLC) which is up over 23%. Medium term LLC remains bullish and we could comfortably be a buyer ~$15, with a likely exit plan if it fails and breaks under $14.
When sectors fall out of favour, often the quality gets dragged down with the chaff and this may occur with LLC, with our targeted buy area is 8-9% below its current price. Hence if / when we do make a foray into the real estate sector, LLC is our number one pick.
Lend Lease (LLC) Monthly Chart
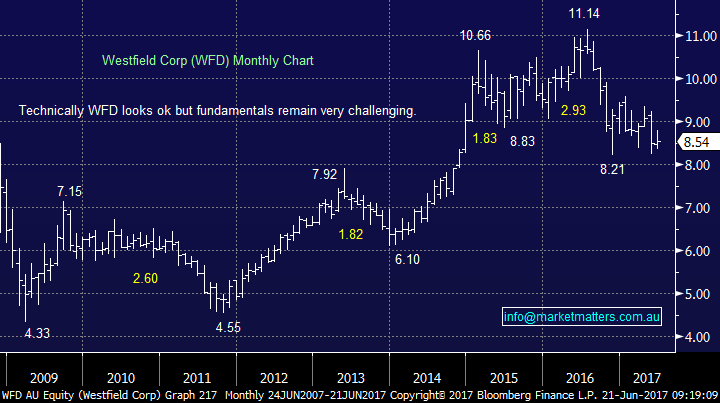
The worst performer in the sector over the last year is Westfield (WFD), which has fallen over 20% this financial year. Technically, WFD remains in support, but the fundamentals just feel way too challenging at present for the UK and US shopping centre operator. We are neutral WFD and feel its unlikely that view will change in 2017.
Westfield Corp (WFD) Monthly Chart
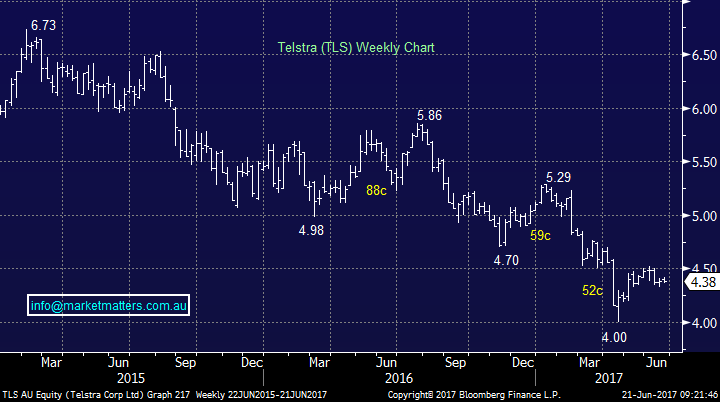
Telstra Corporation (TLS) $4.38
Yesterday, mobile services provider, Amaysim (AYS) shares were smacked ~10% on director selling. We pose the simple question – “Do we want to maintain exposure to this evolving competitive market if the directors do not?”
TLS are currently trying to sell its long term NBN lease for $1bn i.e. a 5% return. If they can achieve this, the shares are likely to pop higher, but we would view this as a selling opportunity. The question we are deliberating is – “Do we sell now, or back TLS to be successful with its sale and hence be patient?”
We are considering closing our TLS position in the coming days / weeks. We have been targeting $4.60 over recent weeks, but it’s now likely to need a successful sale to achieve this level.
*Watch for alerts.
Telstra (TLS) Weekly Chart
Conclusion(s)
We are now negative equities in the short-term, looking for a 4-5% correction by US / European stocks. On balance, we believe this will see a test below 5550 by the ASX200, which yet again appears to have led the correction by its global piers.
We are watching TLS very carefully as we look for an optimum exit level.
Overnight Market Matters Wrap
· Oil prices remained under considerable pressure, falling another 2% overnight to a 9 month low and dragging US energy stocks lower, on continuing concerns that rising US production will offset the OPEC production cuts which were reaffirmed only late last month.
· The benchmark Wti oil price has now fallen around 20% from its year highs ( $43.25 overnight) into bear market territory, while the Brent oil price has falling similarly to US$46/bbl. -see chart below.
· The weaker oil sector dragged US indices back from their all-time highs, with all 3 indices lower by between 0.3% and 0.8%. European indices were also under pressure as oil stocks sold off, with the UK market 0.7% weaker.
· Iron ore firmed to US$56.30 but commodities were generally easier with copper giving back its previous day’s gains. Both BHP and RIO had their weakest night for some time losing over 3% in US trading. The A$ was slightly weaker, back below US76c, while the ASX futures is pointing to a 0.5% decline in the local market.
· The June SPI Futures is indicating the ASX 200 to lose 30 points this morning, towards the 5725 level.
Disclosure
Market Matters may hold stocks mentioned in this report. Subscribers can view a full list of holdings on the website by clicking here. Positions are updated each Friday.
Disclaimer
All figures contained from sources believed to be accurate. Market Matters does not make any representation of warranty as to the accuracy of the figures and disclaims any liability resulting from any inaccuracy. Prices as at 21/06/2017. 8.00AM.
Reports and other documents published on this website and email (‘Reports’) are authored by Market Matters and the reports represent the views of Market Matters. The MarketMatters Report is based on technical analysis of companies, commodities and the market in general. Technical analysis focuses on interpreting charts and other data to determine what the market sentiment about a particular financial product is, or will be. Unlike fundamental analysis, it does not involve a detailed review of the company’s financial position.
The Reports contain general, as opposed to personal, advice. That means they are prepared for multiple distributions without consideration of your investment objectives, financial situation and needs (‘Personal Circumstances’). Accordingly, any advice given is not a recommendation that a particular course of action is suitable for you and the advice is therefore not to be acted on as investment advice. You must assess whether or not any advice is appropriate for your Personal Circumstances before making any investment decisions. You can either make this assessment yourself, or if you require a personal recommendation, you can seek the assistance of a financial advisor. Market Matters or its author(s) accepts no responsibility for any losses or damages resulting from decisions made from or because of information within this publication. Investing and trading in financial products are always risky, so you should do your own research before buying or selling a financial product.
The Reports are published by Market Matters in good faith based on the facts known to it at the time of their preparation and do not purport to contain all relevant information with respect to the financial products to which they relate. Although the Reports are based on information obtained from sources believed to be reliable, Market Matters does not make any representation or warranty that they are accurate, complete or up to date and Market Matters accepts no obligation to correct or update the information or opinions in the Reports.
If you rely on a Report, you do so at your own risk. Any projections are estimates only and may not be realised in the future. Except to the extent that liability under any law cannot be excluded, Market Matters disclaims liability for all loss or damage arising as a result of any opinion, advice, recommendation, representation or information expressly or impliedly published in or in relation to this report notwithstanding any error or omission including negligence.
To unsubscribe. Click Here


