Pilbara Minerals shows Lithium’s appeal (PLS, ORE, KDR)
The ASX200 had a poor day yesterday courtesy of a weaker Dow and Asian indices selling off aggressively e.g. H-listed Chinese shares fell -2.1%. Unfortunately local sentiment was also hampered by very disappointing results from Harvey Norman (HVN) -12.5% and Ramsay Healthcare (RHC) -5.8% - just to clarify we have no interest in either of these stocks at current levels. This morning the local market is set to open down another 40 points following the Dow’s -380-point fall plus BHP closed down a hefty 55c in the US. The Dow fell in the last 2-hours after being slightly positive at 6am AEST, undoubtedly investors are still rattled / nervous following the Fed’s hawkish comments yesterday i.e. interest rates may increase faster than many anticipated.
This morning is the 1st of March and summer is officially behind us, time certainly does fly! Let’s quickly remind ourselves of some major market seasonal statistics for this time of year, over the last decade:
1. The All Ords, has gained +1.4% in March and +1.58% in April for a total gain of +2.98%.
2. Commonwealth Bank has gained has gained +4.44% in March and +2.33% in April for a total gain of +6.77%.
3. BHP has fallen -0.97% in March and gained +3.9% in April for a total gain of +2.93% - note BHP goes ex-dividend in March US57c, or around 2.4% hence the regular negative return in April.
Importantly when we delve into the above numbers what caught my eye was the relatively mixed returns by the All Ords and BHP, but the excellent consistency from CBA with its almost +7% return over April / March – over the last 10-years it was down only once in a March and once in an April. The heavyweight banks usually perform excellently this time of year as juicy fully franked dividends loom in May for 3 of our “Big 4 banks”.
For the new subscribers I thought today was an opportunity to mention the DOT Theory that we often consider when statistics are playing an important role in our market analysis:
- “80% of the time the high, or low, of any timeframe is formed in the first 20% of that timeframe”.
Hence if March / April is again going to be strong for Australian stocks, we should see a low for March in the next few days before an advance commences. At MM we remain bullish global stocks into March / April targeting fresh 2018 highs, and all-time highs from many indices.
In today’s report we are going to update our views on lithium stocks following the positive announcement from Pilbara Minerals (PLS) yesterday.
Local Index
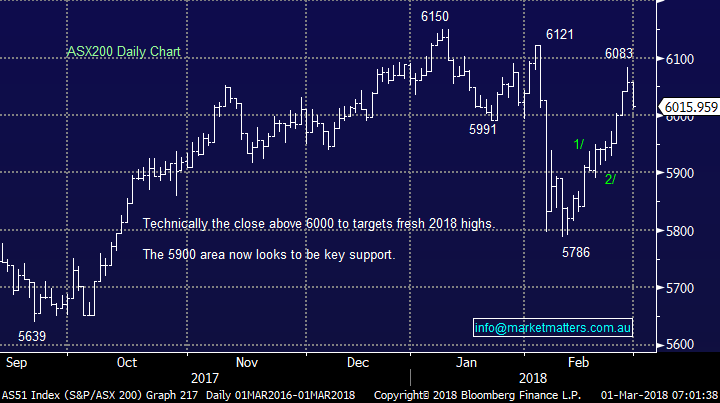
Yesterday the ASX200 closed down -0.7% yesterday following weakness across global equities. This morning the SPI futures are implying an open down another 40-points, ideally we are now looking for pivot low in the next few days – a buying opportunity for the aggressive traders amongst you.
We remain bullish targeting the 6250-6300 area, a break back under 5900 would now lead to us questioning our interpretation.
ASX200 Chart
Lithium Stocks
Pilbara Minerals (PLS) 92c
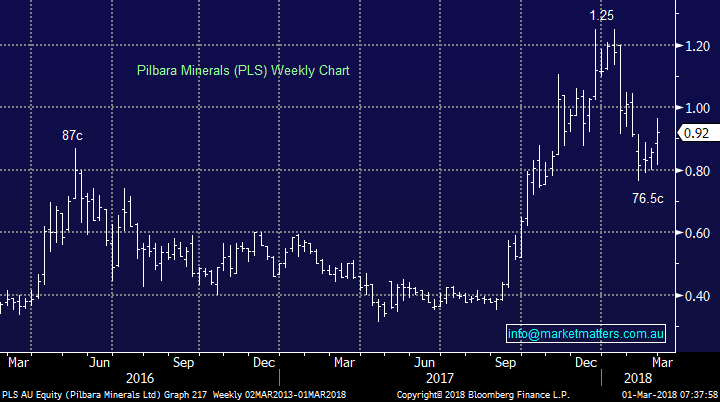
Yesterday Pilbara Minerals (PLS) secured an $80m deal / strategic partnership with South Korean conglomerate POSCO sending the stock surging almost +14%. The Koreans have secured a long-term supply of lithium in an attempt to increase its position in the battery market. POSCO has taken a 4.75% stake in PLS at 97c, over 20% below the years recent high. POSCO will also invest an additional $97.6m in PLS through a convertible note if a planned venture goes ahead.
The agreement between these two players is part of a noticeable trend of Asian manufacturers looking to secure supply of lithium from our Australian miners.
Yet interestingly only 24-hours ago Morgan Stanley forecasted a 45% fall in lithium prices by 2021 due to planned increased supply from Chile unless electric car sales can pick up to over 30% in the next 7-8 years – it takes 2 to make a market!
Following this deal we are neutral / positive PLS seeing more exciting opportunities elsewhere.
Pilbara Minerals (PLS) Chart
Orocobre (ORE) $6.54
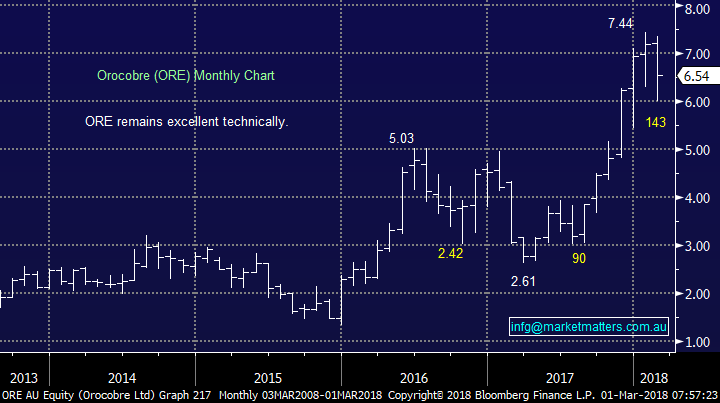
In January ORE raised capital for some exciting expansion with Toyota taking the bulk of the raising by spending almost $300m for 15% of ORE at $7.50 per share. Toyota are clearly looking at the huge potential increase in demand for lithium as cars follow Tesla and turn electric, similar POSCO.
We’ve enjoyed some nice profits from ORE over recent times and would again consider going long around $5.50 – we have to be very fussy on entry due to our holding in Kidman Resources (KDR).
We remain bullish ORE and can see a test of $8 moving forward.
Orocobre (ORE) Chart
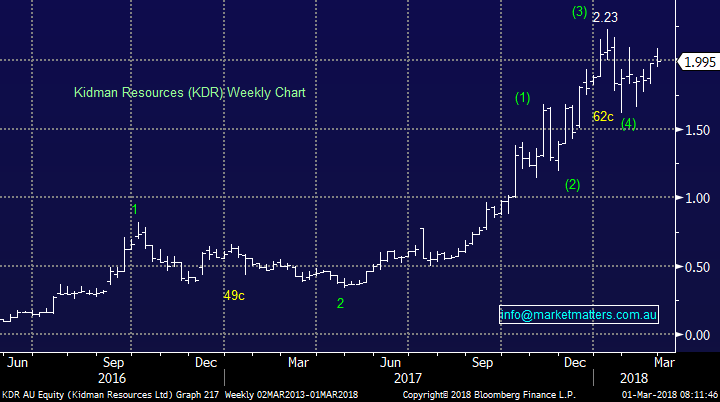
Kidman Resources (KDR) $1.995
KDR is our favourite stock in the lithium / car battery space, it looks likely to be the largest Australian lithium producer moving forward and its costs are at the low end of the sector. KDR also has an experienced major partner in Chilean producer SQM that should offer strong support if / when required.
KDR has enjoyed a strong 9-months along with most of the sector, we believe its not time to buy strength but the volatility the sector offers is likely to provide opportunities for the patient – we would consider increasing our position around $1.50.
We are long KDR from $1.87 and remain bullish with a +$2.25 target.
Kidman Resources (KDR) Chart
Conclusion
- We remain overall bullish lithium stocks from current levels but would only increase our exposure into weakness.
- Our preference in the sector is KDR followed by ORE.
- We are aware that a lot is now “baked” into the current share prices and see relatively limited upside until the pick-up in electric cars becomes evident.
Global markets
US Stocks
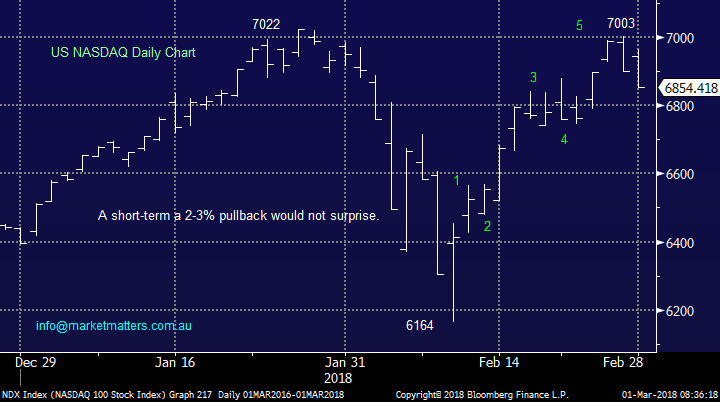
Before the Fed Chair’s hawkish statement last night the tech based NASDAQ was trading within 0.27% of its all-time high, strongly suggesting the bull market was still in control.
Yesterday we said “in the short-term we could easily see a further 2-3% correction following the almost 14% surge from the 9th but we remain bullish for now” – that pullback feels like it’s now unfolding.
US NASDAQ Chart
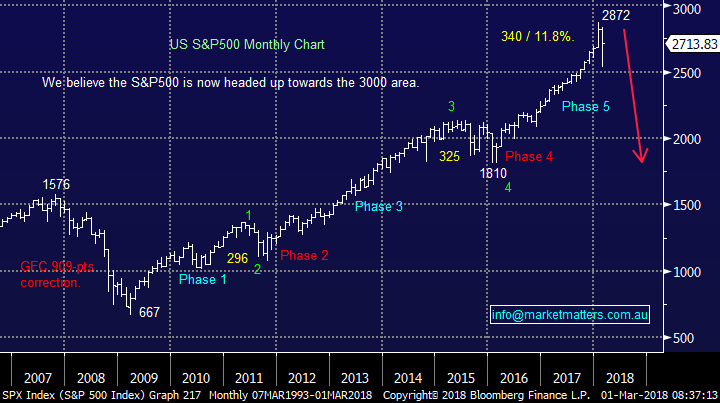
Subscribers must remember our longer-term view that stocks are getting ready for a meaningful +20% correction – a fantastic opportunity for the prepared!
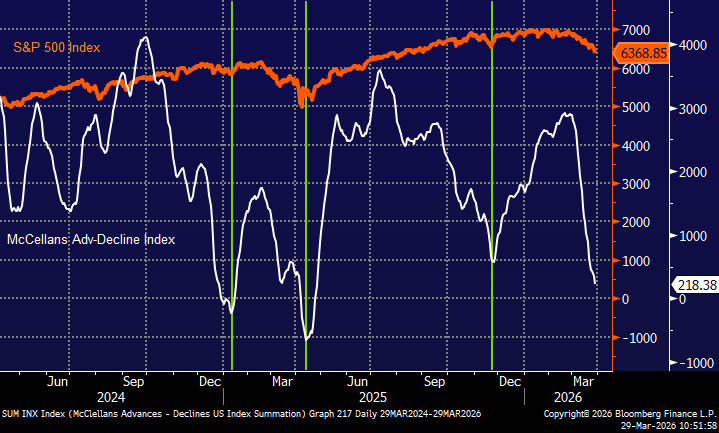
US S&P500 Chart
European Stocks
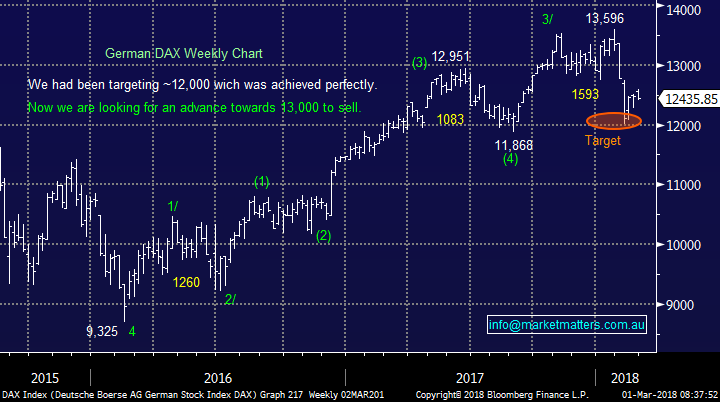
European stocks made fresh recent lows this week as expected, our preferred scenario is now a rally back over 13,000 by the German DAX to fresh all-time highs in 2018 for an excellent selling opportunity.
However, European indices are still struggling to regain any strength and currently feel the “Achilles heel” in our short-term bullish outlook.
German DAX Chart
Asian Stocks
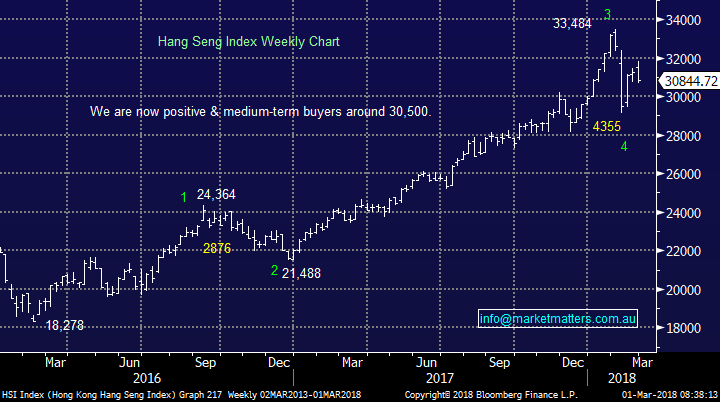
The Hang Seng Index is unfolding as expected and we would be trading buyers ~30,500.
Hang Seng Index Chart
Overnight Market Matters Wrap
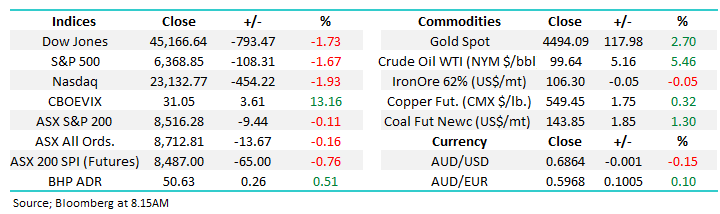
· The US markets have had a mixed day on the last trading day of February, with the all key indices losing ground in afternoon trading and closing in the red at their lows of the day. The S&P 500 is down about 2.5% for the month, in one of the most volatile months for some time, which saw markets recover more than half their early month losses.
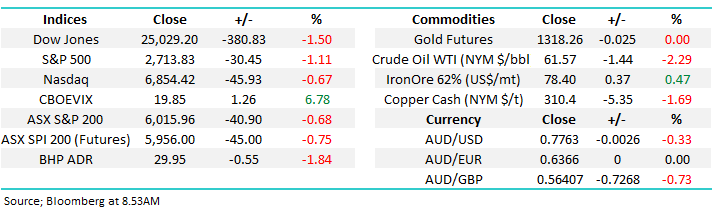
· Weaker commodity markets led lower by oil and copper, following yesterday’s worse than expected Chinese manufacturing data for February, will weigh on the ASX200 on the first trading day of March, with both BHP and RIO once again under pressure in offshore trading, both about 2.5% lower.
· The benchmark Brent oil price is another 1.5% weaker, in the wake of a jump in US inventories, as is the copper price following the Lunar year affected Chinese PMI data, which fell below expectations at 50.3, from 51.3 in January, which while still expansionary, is the lowest read in 18 months. Iron ore has drifted back below US$79/t, and the A$ below US78c.
· Market attention today will turn to the release of the Caixin manufacturing data for February, to provide a further read on the health of the underlying Chinese economy. Locally we will also get an update on the Australian manufacturing trends for February.
· The March SPI Futures is indicating the ASX 200 to open 44 points lower towards the 5970 level this morning.
Disclosure
Market Matters may hold stocks mentioned in this report. Subscribers can view a full list of holdings on the website by clicking here. Positions are updated each Friday, or after the session when positions are traded.
Disclaimer
All figures contained from sources believed to be accurate. Market Matters does not make any representation of warranty as to the accuracy of the figures and disclaims any liability resulting from any inaccuracy. Prices as at 01/03/2018. 8.13AM
Reports and other documents published on this website and email (‘Reports’) are authored by Market Matters and the reports represent the views of Market Matters. The MarketMatters Report is based on technical analysis of companies, commodities and the market in general. Technical analysis focuses on interpreting charts and other data to determine what the market sentiment about a particular financial product is, or will be. Unlike fundamental analysis, it does not involve a detailed review of the company’s financial position.
The Reports contain general, as opposed to personal, advice. That means they are prepared for multiple distributions without consideration of your investment objectives, financial situation and needs (‘Personal Circumstances’). Accordingly, any advice given is not a recommendation that a particular course of action is suitable for you and the advice is therefore not to be acted on as investment advice. You must assess whether or not any advice is appropriate for your Personal Circumstances before making any investment decisions. You can either make this assessment yourself, or if you require a personal recommendation, you can seek the assistance of a financial advisor. Market Matters or its author(s) accepts no responsibility for any losses or damages resulting from decisions made from or because of information within this publication. Investing and trading in financial products are always risky, so you should do your own research before buying or selling a financial product.
The Reports are published by Market Matters in good faith based on the facts known to it at the time of their preparation and do not purport to contain all relevant information with respect to the financial products to which they relate. Although the Reports are based on information obtained from sources believed to be reliable, Market Matters does not make any representation or warranty that they are accurate, complete or up to date and Market Matters accepts no obligation to correct or update the information or opinions in the Reports.
If you rely on a Report, you do so at your own risk. Any projections are estimates only and may not be realised in the future. Except to the extent that liability under any law cannot be excluded, Market Matters disclaims liability for all loss or damage arising as a result of any opinion, advice, recommendation, representation or information expressly or impliedly published in or in relation to this report notwithstanding any error or omission including negligence.
To unsubscribe. Click Here