Picking when bubbles are likely to burst is the hard part – Part 2
Yesterday afternoon the Australian Financial Review led with a story which dovetails perfectly with our discussion around bubbles - "Economist Robert Shiller gets dot com déjà-vu from Trump's plans". The essence of the story was that the Nobel Prize-winning economist Robert Shiller has not seen euphoria in stocks as we are experiencing today since the "Tech Wreck" of 2000. He compares the exuberance of the advent of the internet with Donald Trump's economic plans. Importantly for investors he accurately forecasted the bursting of both the dot.com bubble and the US housing crash which triggered the GFC, so he's no slouch. However we would disagree slightly with Mr Shiller around investors sentiment, while they are becoming more comfortable with stocks the GFC is still in people's minds and the investors / punters clubs of the 1980's and late 1990's have almost totally vanished, as have huge margin loan positions plus lastly taxi drivers never talk about stocks anymore which is clearly a shame – although that said I was up around Fraser Island fishing over the weekend and the boat captain was discussing a few specs!
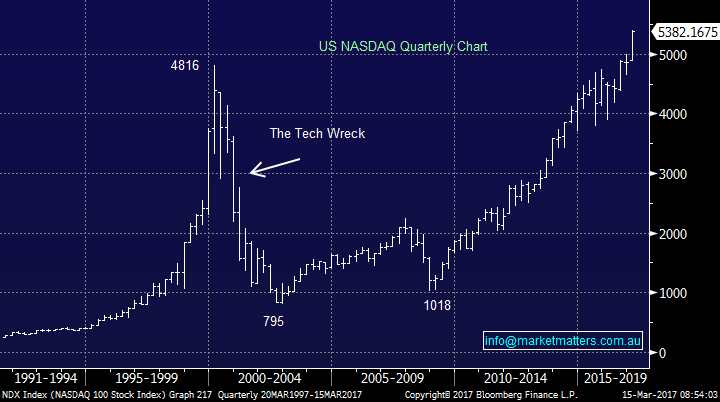
As you know from yesterday’s note, we believe equity markets are approaching a significant correction but NOT a bubble bursting, there is a big difference. Either way the obvious tricky part remains deciding when to cash in the chips and to sit on the sidelines, or actually buy some bearish stock market ETF's. Our opinion at MM is picking the exact time to sell is luck but acknowledging the danger signs and reducing market exposure is not. Just consider the NASDAQ back at the end of 1999, it would have been easy to take profit around the 2200 level after the index had doubled in just a year but amazingly it then more than doubled again in the next 6-months. Unfortunately it's easy to imagine investors being sucked into this last 6-months explosion in prices but very quickly losing over half their money. Subsequently, it would have taken 15 patient years to get it all back.
US NASDAQ Quarterly Chart
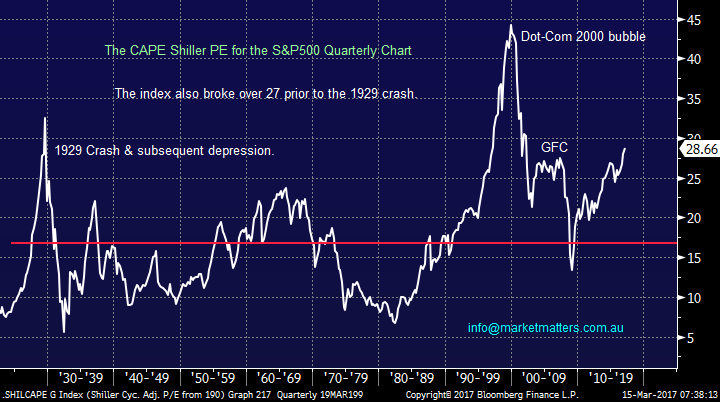
Two charts are currently doing the rounds with many traders, the first is the Shiller cyclically adjusted P/E from 1900 with illustrates the long term valuation of the US stock market. This is a chart we have used previously and it shows a concern that the Shiller P/E is trading ~77% higher than its historical mean of 16.7. What's grabbing the headlines using the Shiller P/E are valuations have now exceeded pre-GFC levels and are rallying towards 1929 levels, only the dot.com craziness makes stocks feel cheap today. Our take on this at MM is the upside momentum is likely to struggle soon until Mr Trump starts delivering on his promises.
Shiller Cyc. Adj. P/E Quarterly Chart
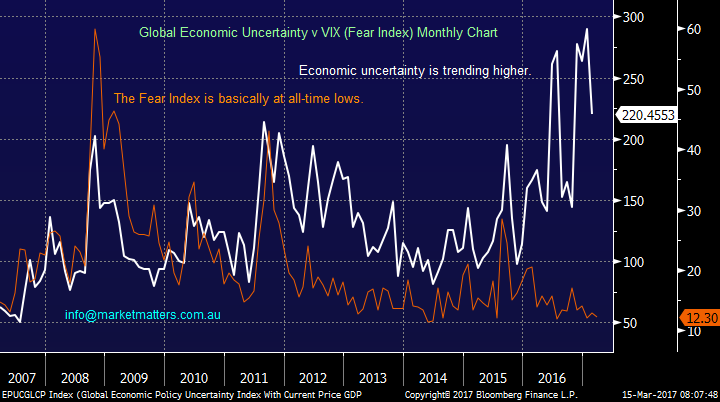
The second chart is a fascinating one which shows the divergence between the Global Economic Uncertainty and the VIX (Fear Index) - they are trending in completely opposite directions for the first time in over 10-years. In this case we totally agree with Robert Shiller, the fact that investors are not buying puts which would push up the VIX illustrates perfectly how complacent professional investors are at present. Perhaps this phenomenon could be explained by the theory we have been touting over the last 6 months, simply that Fund Managers have been caught underweight equities and hence there is no need for downside protection when they actually want the market lower so they can buy stocks!
We have two thoughts on this intriguing break of previously strong correlation:
1. Watch for when the VIX does start to edge higher it will imply Fund Managers are fully weighted to stocks and need some protection.
2. The VIX will almost definitely experience 1/2 major spikes higher in the next year.
Global Economic Uncertainty v the VIX (Fear Index) Monthly Chart
Moving onto the MM view around this subject and importantly our portfolio where we are essentially fully committed to stocks after recently plunging into the gold / resources sectors for the first time in many months. We have been predicting this current blow off in stocks since early 2016 and its currently following our script very closely, lets simply stand back and look at our view over the next 1-2 years hence ignoring any short-term noise.
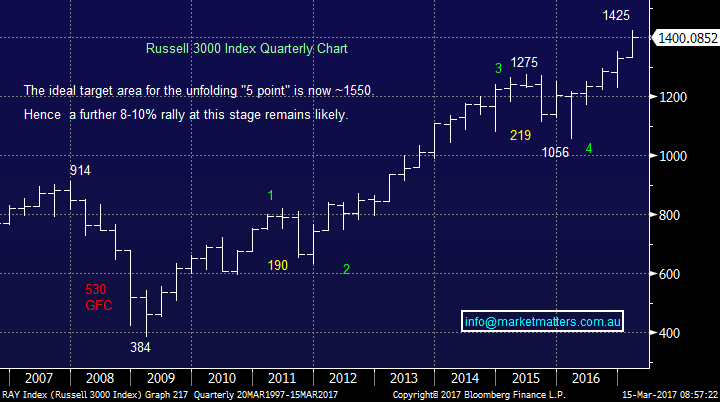
1. Our ideal target for the broad Russell 3000 is ~1550, around 10% above today's level, but it has recently traded within 2% of our minimum 1450 target.
2. We remain very comfortable with our view that the Russell 3000 will again test the 1050 major support area in 2017/8 i.e. almost 25% below this morning's market close.
At MM we have now dusted off our "sellers hat" and will ideally look to slowly increase our cash position into strength. 3 stocks we are watching closely at present are Macquarie Bank (MQG), Altium (ALU) and our trading position in TPG Telecom (TPM).
NB The Russell 3000 is an index of the leading 3000 US stocks hence its far better reflection on the US stock market than the Dow which is just comprised of 30 stocks.
Russell 3000 Index Quarterly Chart
Conclusion
1. We are wearing our "sellers hat" ideally looking to reduce market exposure into the seasonally strong April period.
2. We believe that stocks are headed for a decent correction of ~25% but we are not expecting a bubble bursting.
Overnight Market Matters Wrap
- The major overnight US indices all edged lower, again ahead of the anticipated rate rise tomorrow when the US Fed meets this week. Janet Yellen is then due to give a press conference and traders will be looking for hints as to how many more rate rises we will get this year.
- Oil traded lower as the Saudi’s announced an increase in production in February.
- Iron ore slipped, base metals on the LME were mostly up while iron ore slipped. Gold is trading just below USD1200/oz.
- The March SPI Futures is indicating the ASX 200 to open marginally lower, around the 5,750 area this morning.
Disclosure
Market Matters may hold stocks mentioned in this report. Subscribers can view a full list of holdings on the website by clicking here. Positions are updated each Friday.
Disclaimer
All figures contained from sources believed to be accurate. Market Matters does not make any representation of warranty as to the accuracy of the figures and disclaims any liability resulting from any inaccuracy. Prices as at 15/03/2017. 9.00AM.
Reports and other documents published on this website and email (‘Reports’) are authored by Market Matters and the reports represent the views of Market Matters. The MarketMatters Report is based on technical analysis of companies, commodities and the market in general. Technical analysis focuses on interpreting charts and other data to determine what the market sentiment about a particular financial product is, or will be. Unlike fundamental analysis, it does not involve a detailed review of the company’s financial position.
The Reports contain general, as opposed to personal, advice. That means they are prepared for multiple distributions without consideration of your investment objectives, financial situation and needs (‘Personal Circumstances’). Accordingly, any advice given is not a recommendation that a particular course of action is suitable for you and the advice is therefore not to be acted on as investment advice. You must assess whether or not any advice is appropriate for your Personal Circumstances before making any investment decisions. You can either make this assessment yourself, or if you require a personal recommendation, you can seek the assistance of a financial advisor. Market Matters or its author(s) accepts no responsibility for any losses or damages resulting from decisions made from or because of information within this publication. Investing and trading in financial products are always risky, so you should do your own research before buying or selling a financial product.
The Reports are published by Market Matters in good faith based on the facts known to it at the time of their preparation and do not purport to contain all relevant information with respect to the financial products to which they relate. Although the Reports are based on information obtained from sources believed to be reliable, Market Matters does not make any representation or warranty that they are accurate, complete or up to date and Market Matters accepts no obligation to correct or update the information or opinions in the Reports.
If you rely on a Report, you do so at your own risk. Any projections are estimates only and may not be realised in the future. Except to the extent that liability under any law cannot be excluded, Market Matters disclaims liability for all loss or damage arising as a result of any opinion, advice, recommendation, representation or information expressly or impliedly published in or in relation to this report notwithstanding any error or omission including negligence.
To unsubscribe. Click Here


