Our banks are definitely dancing the bond yield jig.
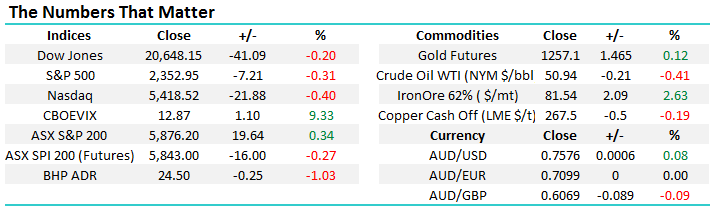
Yesterday’s price action in the local share market gave us a few clues as to what may evolve over the next few weeks, and months. While there were no apparent buyers all morning, allowing the market to fall 0.75% from its positive opening, the weakness was reversed in the afternoon and the market closed only 25-points below its high for 2017, BHP alone accounted for over half of the day's 19-points advance. Basically it feels like Fund Managers remain cashed up to a certain degree but with school holidays / Easter holidays looming next week they would prefer to do nothing unless some market weakness tempts them to press the "buy" button.
Let’s glance back to the last report in March when we looked closely at how the ASX200 usually trades in April, the seasonally strongest month of the year. We formed two conclusions:
1. As 75% of the time the market formed a meaningful top around mid-April we plan to have implemented at least 50% of our planned selling around this period, market allowing of course.
2. If we see a pullback in early April don't panic, historically it's a good buying opportunity.
For at least one day our positive call for the resources in Tuesdays morning report looks smack on but we won't take a bow just yet! The resources rallied hard all day with heavyweights BHP and RIO both closing up well over 3%, our minimum targets for these two stocks are now $25.25 and $63.50 respectively i.e. another 2-3% higher. However our preferred scenario is they both rally towards their 2017 highs i.e. a huge 12% higher.
After two explosive days our trading position in OZL is already showing a 7.5% paper profit, we will take a 10% profit, around $8.55 in OZL, if the opportunity arises in the next few days.
NB We would probably give this trading position more room if we were not already long the highly correlated BHP and RIO.
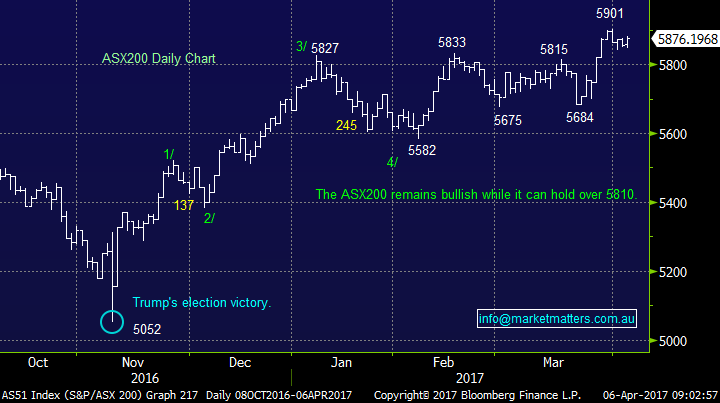
ASX200 Daily Chart
The US market fell away late last night, after rallying strongly for most of the day, following the Fed's minutes which held a note of caution for financial markets. Some officials saw equity prices as "quite high" and bond yields fell as the Fed felt the risks from inflation were muted plus officials are thinking it's appropriate to commence shrinking the balance sheet this year, which came as a bit of a surprise to markets. While the Dow only closed down 41-points, near the sessions lows, it was up almost 200-points prior to the minutes following a very strong employment print earlier in the day! Basically there is clearly a fair bit of good news baked into US stocks at current levels, especially in the financial sector who want interest rates higher, hence any caution from the Fed is a definite negative.
Our preferred scenario remains that the S&P500 makes fresh highs for 2017 over coming weeks prior to a reasonable correction but we would have been stopped out of any bullish trading position during last night's reversal. The direction of US stocks in the short-term looks destined to be dictated by this Fridays Non-Farm Payrolls Data i.e. US employment statistics which is a great gauge to the health of the economy and hence an indication of the speed that the Fed will raise interest rates during 2017/8.
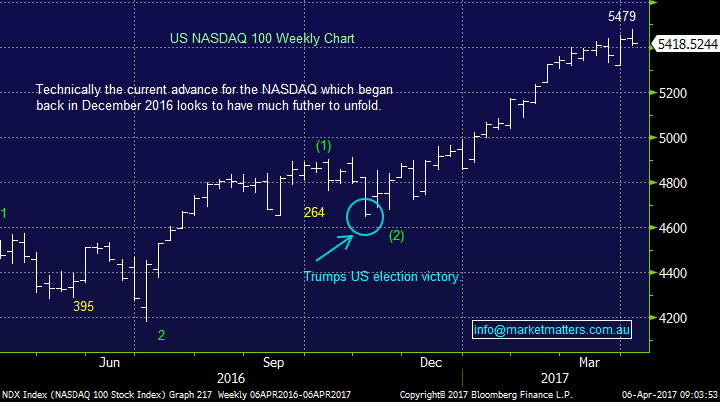
The NASDAQ reversed strongly after again making fresh all-time highs and the technical picture is now calling for a further ~2% pullback. We do however remain very bullish longer term this Tech. index, probably through the majority of 2017 and into 2018.
US NASDAQ Weekly Chart
Banks & Bond yields
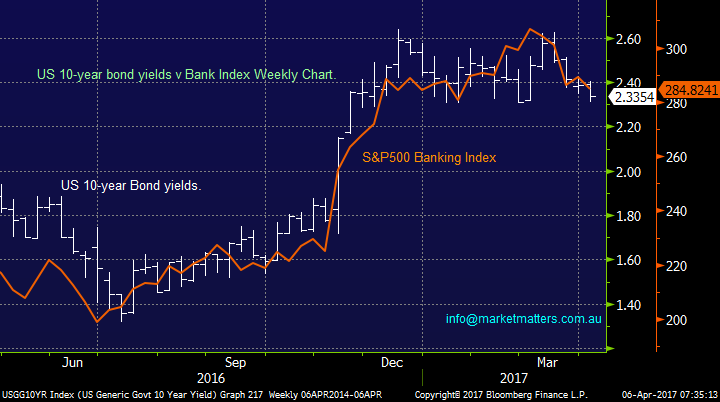
For the ASX200 to challenge the psychological 6000 area this month we need to see the banking sector regain its "Mojo" after slipping 1.3% over the last few days. Last night's price action in the US definitely will not help the cause as the week slowly comes to an end. The following chart illustrates perfectly how closely aligned US bank shares are to the yield on the their 10-year bonds, clearly as US bond yields rise bank shares advance - banks make more money in higher interest rate environments as their margins expand, unless defaults creep into the equation – which is generally towards the end of the cycle, not the beginning. Hence to know where banks are going we simply have to follow bond yields, obviously much easier said than done!
US Banks v 10-year Bond yields
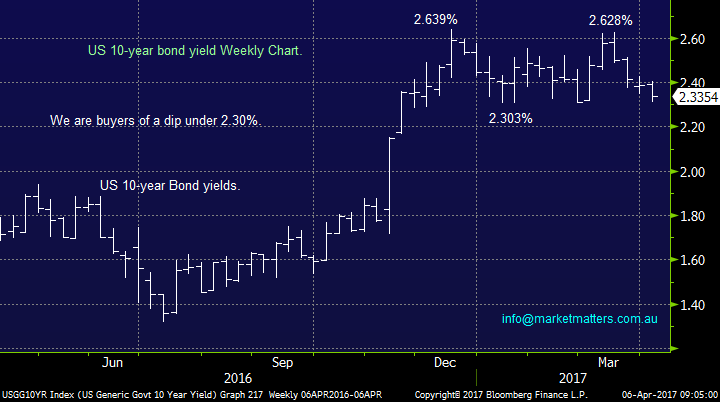
The yield on US 10-year bonds have pulled back in a very corrective manner and ideally we would be buyers on any spike under 2.30% - this is a very similar pattern to that which led to our entry into OZ Minerals this week.
Hence at this point in time, using bond yields as a guide, we would be buyers of US banks into any weakness over coming days - Australian banks are very correlated to US banks.
US 10-year Bond yield weekly chart
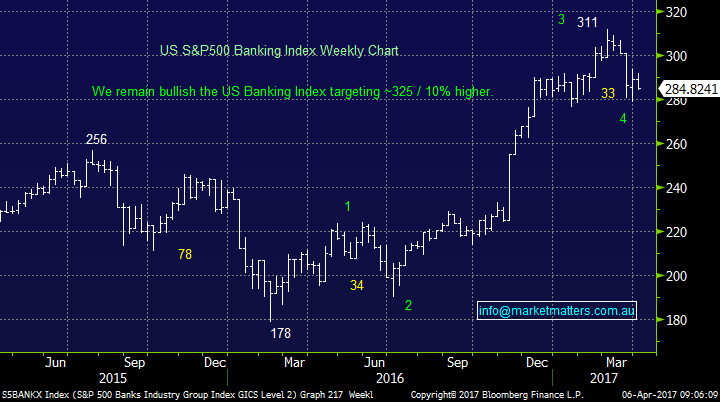
When we look at the US Banking Index it remains bullish targeting a further ~10% advance however an initial retest of Januarys lows would not surprise i.e. 2-3% lower. This correlates perfectly with our short-term view on US bond yields.
US Banking Index weekly chart
So overall today's report may be slightly short but it carries a very important message with regard to the direction of banking stocks, which in turn usually dictates the path of the ASX200.
We still believe that the banks can rally 2-3% in April, from current levels and MM can take a nice ~28% profit on our CBA position, but a little patience may be required.
Conclusion
We remain short-term bullish equities in April, unless the ASX200 breaks back under 5810 level.
However we are now wearing our medium term "sellers hat" ideally with the intention of increasing cash levels in the 5950-6000 region.
We remain bullish the resources and gold sectors from today's levels but gold stocks may reverse quickly when / if US bond yields turn back up.
Hence with our view that US bond yields are approaching a point of inflection we are seriously considering taking a profit on one of our gold holdings (EVN and RRL) - remember we regard gold positions as more short-term.
Overnight Market Matters Wrap
-Markets were strong early with the Dow Jones up ~200pts following strong employment data however they were sold off heavily towards the close
-ADP private payrolls data showed 263,000 workers added in March, raising expectations for a stronger non-farm payrolls report Friday
-However, Fed talk around shrinking its $4.5 trillion balance sheet later this year clearly caught the market off guard. It was expected that this would happen once interest rates were back at more normal levels
-U.S. crude inventories surprisingly jumped 1.57 million barrels last week to set another record. Oil finish up +0.3%, Iron Ore was up +2.6% and Copper added +2%. Gold was largely flat
-SPI Futures are pricing a drop of -16pts this morning
Disclosure
Market Matters may hold stocks mentioned in this report. Subscribers can view a full list of holdings on the website by clicking here. Positions are updated each Friday.
Disclaimer
All figures contained from sources believed to be accurate. Market Matters does not make any representation of warranty as to the accuracy of the figures and disclaims any liability resulting from any inaccuracy. Prices as at 06/04/2017. 9.00AM.
Reports and other documents published on this website and email (‘Reports’) are authored by Market Matters and the reports represent the views of Market Matters. The MarketMatters Report is based on technical analysis of companies, commodities and the market in general. Technical analysis focuses on interpreting charts and other data to determine what the market sentiment about a particular financial product is, or will be. Unlike fundamental analysis, it does not involve a detailed review of the company’s financial position.
The Reports contain general, as opposed to personal, advice. That means they are prepared for multiple distributions without consideration of your investment objectives, financial situation and needs (‘Personal Circumstances’). Accordingly, any advice given is not a recommendation that a particular course of action is suitable for you and the advice is therefore not to be acted on as investment advice. You must assess whether or not any advice is appropriate for your Personal Circumstances before making any investment decisions. You can either make this assessment yourself, or if you require a personal recommendation, you can seek the assistance of a financial advisor. Market Matters or its author(s) accepts no responsibility for any losses or damages resulting from decisions made from or because of information within this publication. Investing and trading in financial products are always risky, so you should do your own research before buying or selling a financial product.
The Reports are published by Market Matters in good faith based on the facts known to it at the time of their preparation and do not purport to contain all relevant information with respect to the financial products to which they relate. Although the Reports are based on information obtained from sources believed to be reliable, Market Matters does not make any representation or warranty that they are accurate, complete or up to date and Market Matters accepts no obligation to correct or update the information or opinions in the Reports.
If you rely on a Report, you do so at your own risk. Any projections are estimates only and may not be realised in the future. Except to the extent that liability under any law cannot be excluded, Market Matters disclaims liability for all loss or damage arising as a result of any opinion, advice, recommendation, representation or information expressly or impliedly published in or in relation to this report notwithstanding any error or omission including negligence.
To unsubscribe. Click Here


