Market sentiment is a very fickle beast!
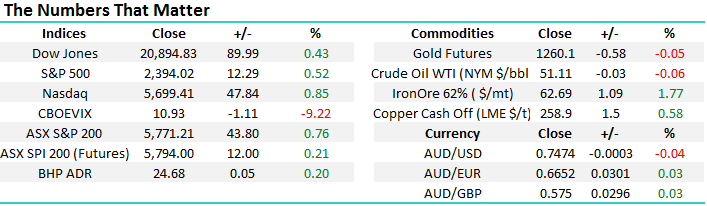
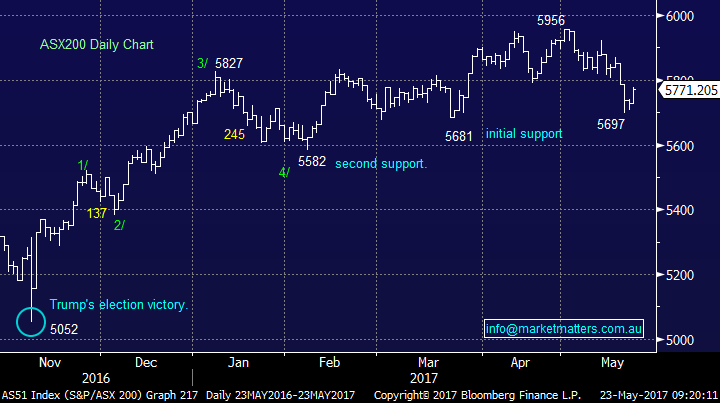
The market bounced strongly yesterday gaining an impressive 0.76%, reducing May’s damage to only 2.6% with 7-trading days still remaining. The sector rotation which kicked into gear last week continued with the Materials Index rallying 1.6% while the Banking Index edged down -0.2%. On an index level we continue to believe the market is suffering its “sell in May and go away” correction with a close over 5830 required by the ASX200 to switch us back to a neutral stance i.e. 1% higher.
Remember the two simple statistics we are watching to put May’s recent weakness into perspective:
1. The average decline for the ASX200 over May / June since the GFC is 6.9%, this eventually targets the 5550 area i.e. 3.8% below yesterdays close.
2. The average pullback for CBA during May / June since the GFC is over 10% which targets the $79 area – so far CBA has hit $79.53.
We still believe any weakness over this May-June period is an opportunity to buy, not panic sell.
ASX200 Daily Chart
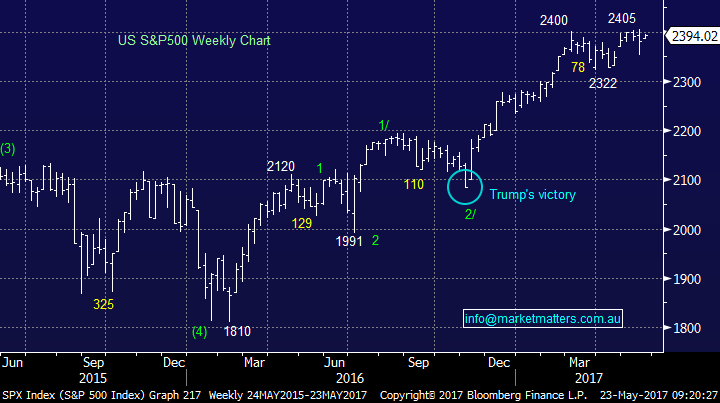
US markets bounced again last night with the S&P500 closing up 0.5%, suddenly we’re back within 0.46% of its all-time high. We remain short-term bearish but very aware of the strength of this underlying bull market, the path of least resistance clearly remains up.
We remain buyers of weakness but do not believe a break to fresh highs will follow through with any meaningful momentum.
US S&P500 Weekly Chart
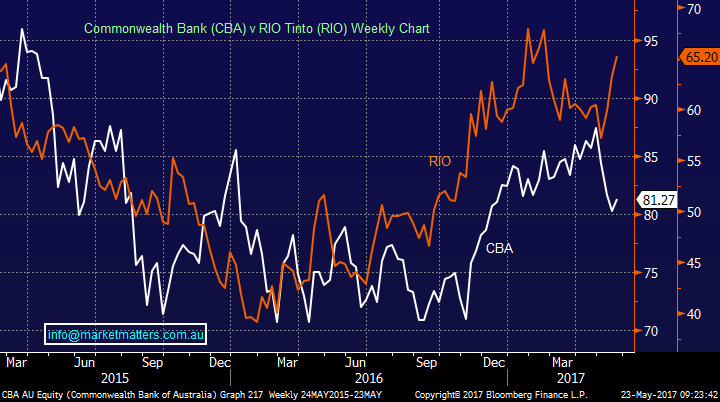
The sentiment change we were specifically referring to in today’s title has been the aggressive switch from banks to resources over the last few weeks, a transition we are positioned for and have been targeting since late April, although we came to the party about a week early!
From mid-March to late April CBA rallied almost $5 (9.4%) while RIO declined ~$3 (5%), this relative performance has switched aggressively over recent weeks and we believe there’s definitely more to play out although seasonally June is usually a tough time for resource stocks – so selling strength will be our preferred approach.
Commonwealth Bank (CBA) v RIO Tinto (RIO) Weekly Chart
Resources
We currently hold a +20% portfolio exposure to resources via BHP, NCM, OZL and RIO, significantly higher than our usual weighting. During 2017 we have witnessed a noticeable divergence between the emerging markets index and our resources sector, markets that are usually very highly correlated. We continue to believe that the Australian resources sector will play catch up as opposed to the emerging markets giving up their gains. However, we are mindful that June is seasonally the weakest month of the year for the Materials Index hence we are not considering increasing our exposure at this point in time.
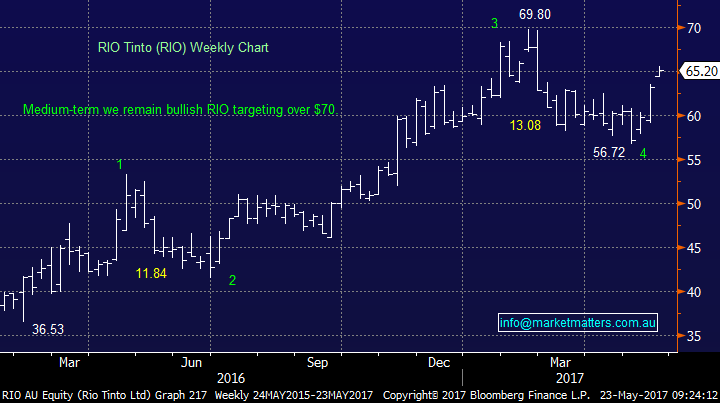
We remain bullish resources with our initial target for RIO over $70, less than $5 above yesterdays close after its recent impulsive $8.50 bounce.
Importantly we will be selling RIO if / when it breaks over $70 and potentially BHP and OZL at the same time. NCM being in the gold sector usually has its own characteristic and may remain in the MM portfolio.
RIO Tinto (RIO) Weekly Chart
Let’s quickly look at 4 other great examples of how quickly our share market changes its mind. Investors need to be mindful that market moves can be significant when everybody is positioned in the same direction i.e. nobody is left to buy, or sell.
We often say that share prices are looking 6-months ahead and the current bounce in resources feels like that at present, they are rallying while their underlying commodity prices have simply stopped falling.
1 The “yield play”
Back in August 2016 investors were scrambling for any solid business / asset that was generating a decent yield as global interest rates collapsed with many international bonds amazingly paying a negative yield.
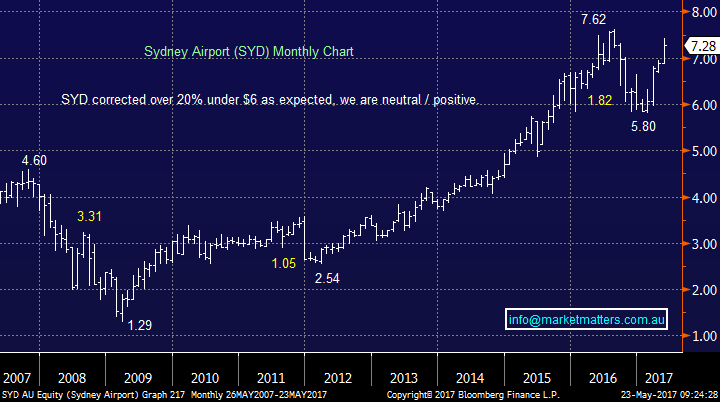
Suddenly the music stopped playing as interest rates starting ticking higher and quality stocks like Sydney Airports were thumped well over 20% in just a few weeks. There was nothing particularly wrong with the company its share price had simply been driven too high.
Sydney Airports (SYD) Monthly Chart
2 The Telco’s
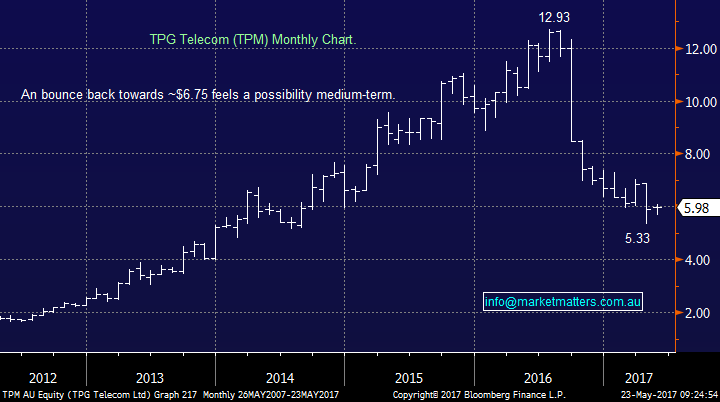
For around 5-years the telco stocks, with the exception of Telstra were one the best places to be invested with TPM rallying over ten-fold. Then in late 2016 we had the NBN changes and investors found it nearly impossible to value the sector. The stocks were being priced for decent future growth, not contraction plus importantly many investors were sitting complacently long.
TPM crashed over 50%, Telstra fell ~40% and we all know the story at Vocus was far worse.
TPG Telecom (TPM) Monthly Chart
3 Banks
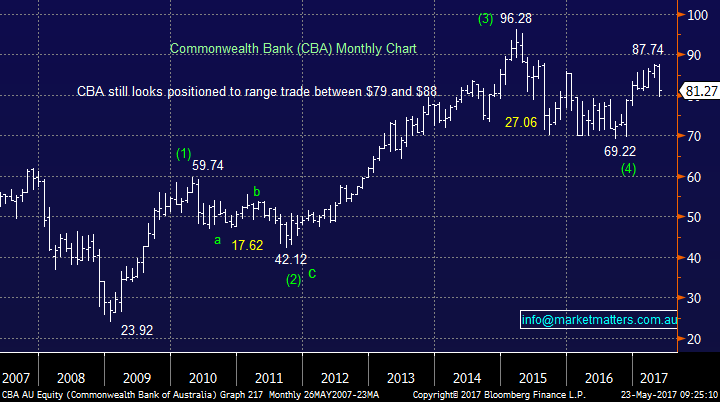
Back in early 2015 investors were scrambling to buy our banks who had rallied strongly since late 2011. It was amazing how often we heard investors say “you cannot go wrong buying the banks”. When we sold out of CBA well over $90 it was clearly a very unpopular move amongst our subscribers but we felt the warning signs were clearly on the wall. We had some similar rumblings when we sold CBA around $87 recently!
Rapidly over the next 12-months it all changed for the banks and CBA fell almost 30% in value, investors should simply never say never!
Commonwealth Bank (CBA) Monthly Chart
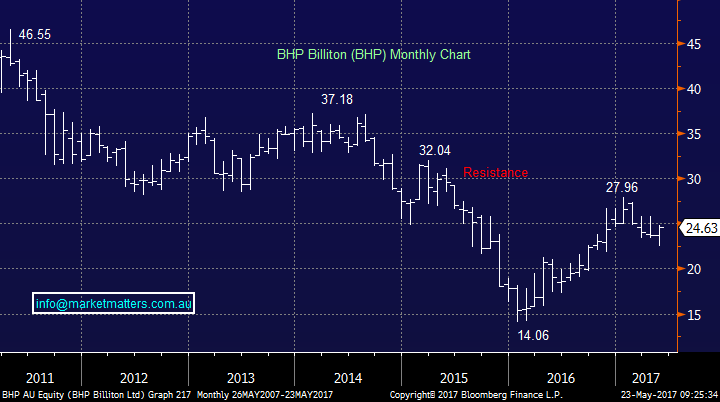
4 Resources
From our inception we had been negative BHP targeting a 30% decline to the $20 area, another unpopular call we have made. We actually started buying BHP ~$20 and got stopped out initially before finally getting set and making some great returns from the huge rally in stocks like BHP, FMG and RIO.
By the time we saw stocks like BHP hitting panic lows in early 2016 almost no investors had any interest in buying the sector but as we all now know it was the exact time to be brave. Going with the crowd is ok until the music stops and then it can be very dangerous from the perspective of both losses and missed opportunities. Remember the below amusing saying:
“Only when the tide goes out do you discover who's been swimming naked.” – Warren Buffett.
BHP Billiton (BHP) Monthly Chart
Conclusion(s)
A simple one today, remain open minded to stock / sector and index potential moves at all times.
Overnight Market Matters Wrap
· The US equity markets commenced its week in black, extending its gains from last Friday widely led by the IT and Utilities sector.
· Commodities remain to be positive, however a small consolidation is expected now in this sector after its recent winning streak.
· Europe however was in negative territory as the bailout for Greece has yet come to an agreement. The EuroStoxx closed 0.29% lower overnight.
· The June SPI Futures is indicating the ASX 200 to open 19 points higher, towards the 5,790 area this morning.
Disclosure
Market Matters may hold stocks mentioned in this report. Subscribers can view a full list of holdings on the website by clicking here. Positions are updated each Friday.
Disclaimer
All figures contained from sources believed to be accurate. Market Matters does not make any representation of warranty as to the accuracy of the figures and disclaims any liability resulting from any inaccuracy. Prices as at 23/05/2017. 8.00AM.
Reports and other documents published on this website and email (‘Reports’) are authored by Market Matters and the reports represent the views of Market Matters. The MarketMatters Report is based on technical analysis of companies, commodities and the market in general. Technical analysis focuses on interpreting charts and other data to determine what the market sentiment about a particular financial product is, or will be. Unlike fundamental analysis, it does not involve a detailed review of the company’s financial position.
The Reports contain general, as opposed to personal, advice. That means they are prepared for multiple distributions without consideration of your investment objectives, financial situation and needs (‘Personal Circumstances’). Accordingly, any advice given is not a recommendation that a particular course of action is suitable for you and the advice is therefore not to be acted on as investment advice. You must assess whether or not any advice is appropriate for your Personal Circumstances before making any investment decisions. You can either make this assessment yourself, or if you require a personal recommendation, you can seek the assistance of a financial advisor. Market Matters or its author(s) accepts no responsibility for any losses or damages resulting from decisions made from or because of information within this publication. Investing and trading in financial products are always risky, so you should do your own research before buying or selling a financial product.
The Reports are published by Market Matters in good faith based on the facts known to it at the time of their preparation and do not purport to contain all relevant information with respect to the financial products to which they relate. Although the Reports are based on information obtained from sources believed to be reliable, Market Matters does not make any representation or warranty that they are accurate, complete or up to date and Market Matters accepts no obligation to correct or update the information or opinions in the Reports.
If you rely on a Report, you do so at your own risk. Any projections are estimates only and may not be realised in the future. Except to the extent that liability under any law cannot be excluded, Market Matters disclaims liability for all loss or damage arising as a result of any opinion, advice, recommendation, representation or information expressly or impliedly published in or in relation to this report notwithstanding any error or omission including negligence.
To unsubscribe. Click Here


