Market Matters Morning Report Monday 19th September 2016
Subscribers questions for today
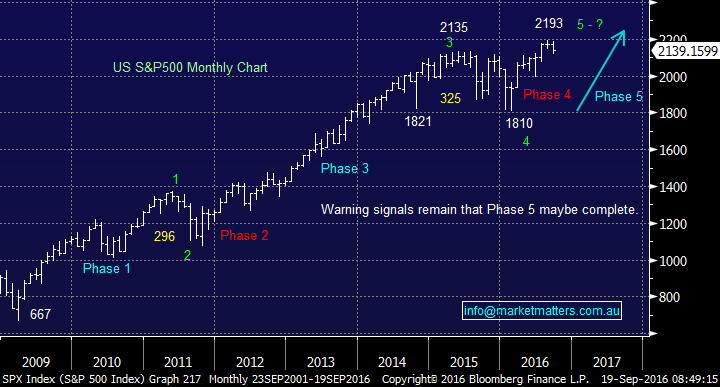
As global stock markets successfully navigate the 8th anniversary of the Lehman's collapse, just, investors remain very wary and nervous around what comes next - this has always been an unloved bull market. Impressively US stocks have rallied well over 200% since the panic GFC days but the recognition of higher interest rates in the future is proving the main source of negativity. Considering that the increase in asset prices around the world has largely been fuelled by the almost "free money" this is hardly surprising .e.g. shares and property.
We remain of the opinion that US stocks will correct over 20% over the next few of years but whether the market has completed its classic "phase 5" advance remains inconclusive.
Today's questions reflect investor concerns as to the overall health of our market, plus some of our positions, which is no surprise considering the ASX200 has endured 5 consecutive weekly declines. We are hopeful that today's report will again clarify our current thinking.
US S&P500 Monthly Chart
Question 1
After the Weekend Report, we had a number of queries around making such bold call like $3 for Origin - what the world would look like if ORG was there? Do we make calls like that to get attention or more importantly - why would we still have ORG in the portfolio if we think it could go to $3 given we combine technical and fundamental views?
A tough question to commence but one that obviously requires clarification. Firstly, we certainly don’t make bold calls for publicity - over the last few years we called BHP, Newcrest, and Woolworths to fall significantly. All turned out to be accurate calls but importantly, that’s only around one "bold" call per year. Interestingly, those 3 calls were extremely unpopular at the time they were made and we had a lot of confrontational feedback to prove it!
Firstly, if we look bigger picture, our preferred scenario remains that US stocks will correct 20% over the next few years but statistically, that is a very common phenomenon.
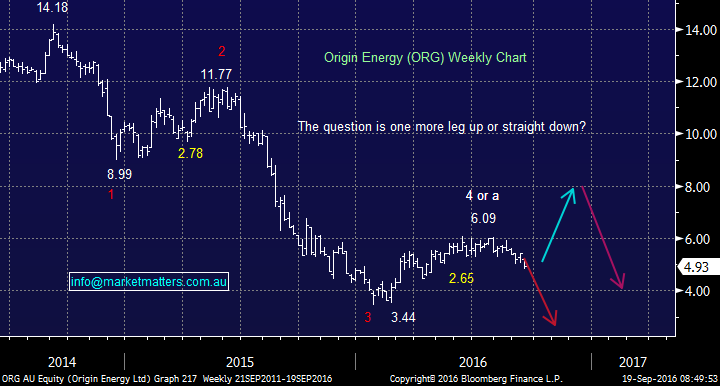
We have illustrated ORG on our charts as likely to correct towards $6.25-6.50, prior to falling under its $3.44 January low - this is not a significant call if US stocks do correct 20%. Our primary concern with our ORG position is we have now lost confidence in our forecast of oil reaching ~$US60/barrel - primarily due to the strengthening $US.
The US Federal Reserve make a decision on interest rates Tuesday night. The market is not pricing in a September hike which in itself probably means the Fed will stay on the sidelines for now. The Fed do not typically act outside of prevailing market expectations – however, they are likely to guide towards a December hike. If the language used here is enough to prompt a firming of market expectations for December, the $US should rally which is going to be a near-term headwind for commodity prices. This was one of the reasons we reduced our energy exposure on Friday by selling out of Woodside (WPL).
Origin Energy (ORG) Weekly Chart
Question 2
A number of subscribers have asked us why we look at specific levels to turn bullish /bearish or neutral and hence what do the levels mean.
Simply these are technical levels that statistically can be used to measure a stock / markets strength. This is a huge subject that would take many reports to cover, any specific questions moving forward would be welcomed.
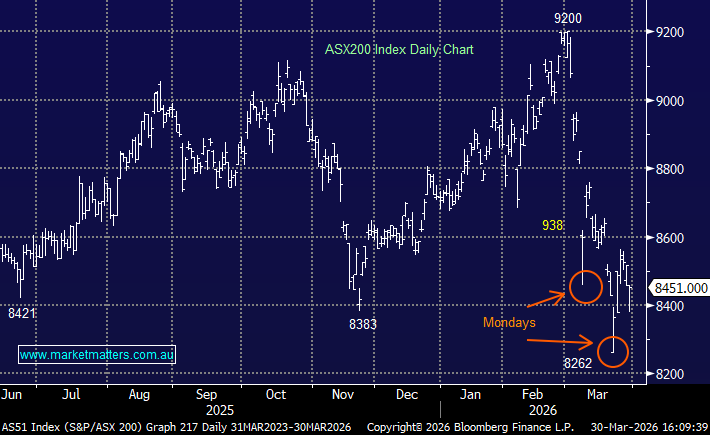
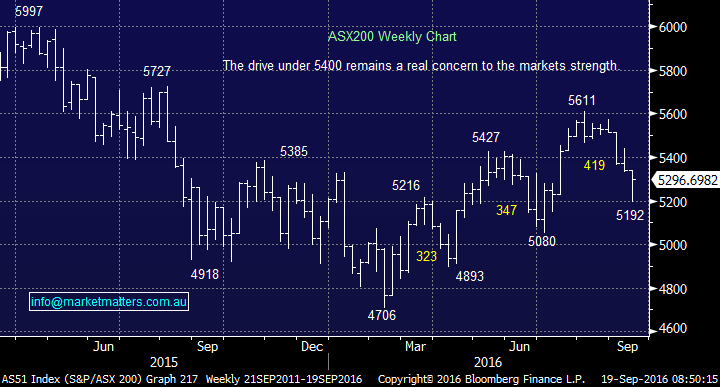
The most relevant recent level was 5400 in the ASX200. Having been an area that the market could not break over since last August this area should then become support. Hence we lost our bullish short-term stance on the break of this level – however, we were surprised by how quickly the index fell to 5200 while global markets remained firm.
ASX200 Weekly Chart
Question 3
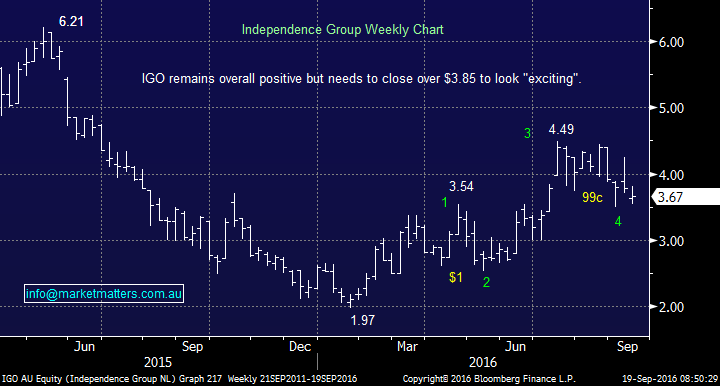
"What technical signals are showing the upside for IGO in the short term? Some are showing oversold but a majority point to Sell irrespective of improved fundamentals. Notably, the stock price has lost all of its recent gains which gives me concern that it can't hold that level over 3.90 yet." - Thanks Peter.
Hi Peter, we have tinkered with your question slightly as the levels were out of date by the time today arrived. IGO has been a very frustrating position for us having gotten within 15c of our target area only to retreat aggressively. It's simply make / break time, the stock needs to hold over $3.50 to look ok and to close over $3.85 to look good our concern will be if the $US rallies this week resource stocks are likely to again retreat.
Independence Group (IGO) Weekly Chart
Question 4
"I was wondering how you establish a STOP level. They seem to vary in a % sense. Is there some guideline/rule to follow? Thanks for the Monday answers. Very helpful." - Regards Brian.
Morning Brian, a relatively simple but very important question to answer, thanks!
Investors / traders enter a stock for a number of reasons, therefore a "STOP" should be identified when these reasons no longer exist – or in other words, a "STOP" should be determined by where you are wrong and then the position size etc should be determined by what the % potential loss of capital. Obviously, sometimes this leads to a position not being taken because the risk / reward is not very attractive.
When setting a specific stop level, some traders / investors determine their level by looking at the historical volatility of a position – a common way to do this is to use a multiple of the average true range of that position over a certain time period. For instance, 2 x ATR over the last 20 trading days. Other investors simply apply a percentage basis – for instance – a 10% stop level.
For us, we use both technical and fundamental filters to select a position and as a result we should be using the same principles to exit that position – therefore our stop levels do vary in a % sense – however the key principle remains, the STOP level is determined by where we think we are wrong.
Overnight Market Matters Wrap
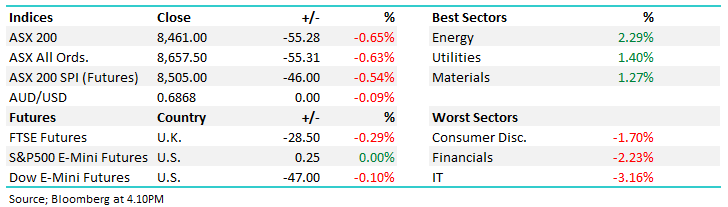
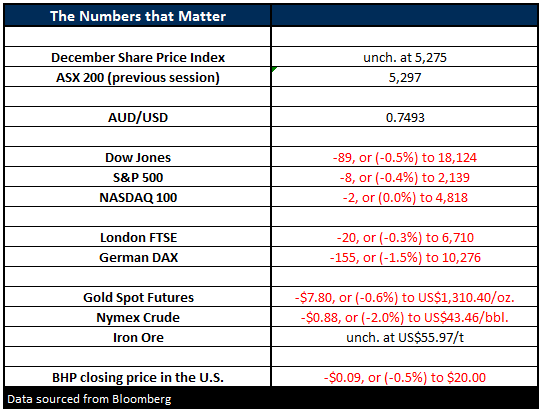
- The US markets finished the week down on Friday, but managed to be up for the week. The Dow closed down on Friday, by 89 points (-0.5%), but up 38 points (+0.2%) for the week to 18,123.80. The broader S&P500 was 8 points lower on Friday, but closed up 13 points (+0.5%) for the week, at 2,139.
- Oil slipped further on news that Iran was exporting record levels adding to the global glut. Crude finished down 88c (-2.0%) to US$43.03/bbl. This morning, however, it is currently trading 1% higher from Friday’s settlement.
- Gold traded weaker after the CPI figure was released in the US on Friday. The report showed that inflation was growing, albeit slowly. Gold fell US$7.80 (-0.6%) $1,306.20/oz as the US$ improved after the news.
- The ASX 200 is expected to open flat this morning, around the 5294 level, as indicated by the December SPI Futures this morning. However, a negative sentiment remains as global interest rates are back on investors’ minds.
All figures contained from sources believed to be accurate. Market Matters does not make any representation of warranty as to the accuracy of the figures and disclaims any liability resulting from any inaccuracy. Prices as at 19/09/2016. 9:00AM.
Reports and other documents published on this website and email (‘Reports’) are authored by Market Matters and the reports represent the views of Market Matters. The Market Matters Report is based on technical analysis of companies, commodities and the market in general. Technical analysis focuses on interpreting charts and other data to determine what the market sentiment about a particular financial product is, or will be. Unlike fundamental analysis, it does not involve a detailed review of the company’s financial position.
The Reports contain general, as opposed to personal, advice. That means they are prepared for multiple distributions without consideration of your investment objectives, financial situation and needs (‘Personal Circumstances’). Accordingly, any advice given is not a recommendation that a particular course of action is suitable for you and the advice is therefore not to be acted on as investment advice. You must assess whether or not any advice is appropriate for your Personal Circumstances before making any investment decisions. You can either make this assessment yourself or if you require a personal recommendation, you can seek the assistance of a financial adviser. Market Matters or its author(s) accepts no responsibility for any losses or damages resulting from decisions made from or because of information within this publication. Investing and trading in financial products are always risky, so you should do your own research before buying or selling a financial product.
The Reports are published by Market Matters in good faith based on the facts known to it at the time of their preparation and do not purport to contain all relevant information with respect to the financial products to which they relate. Although the Reports are based on information obtained from sources believed to be reliable, Market Matters does not make any representation or warranty that they are accurate, complete or up to date and Market Matters accepts no obligation to correct or update the information or opinions in the Reports.
If you rely on a Report, you do so at your own risk. Any projections are estimates only and may not be realised in the future. Except to the extent that liability under any law cannot be excluded, Market Matters disclaims liability for all loss or damage arising as a result of any opinion, advice, recommendation, representation or information expressly or impliedly published in or in relation to this report not with standing any error or omission including negligence.
To unsubscribe.Click Here