Market looks great but not worth chasing now
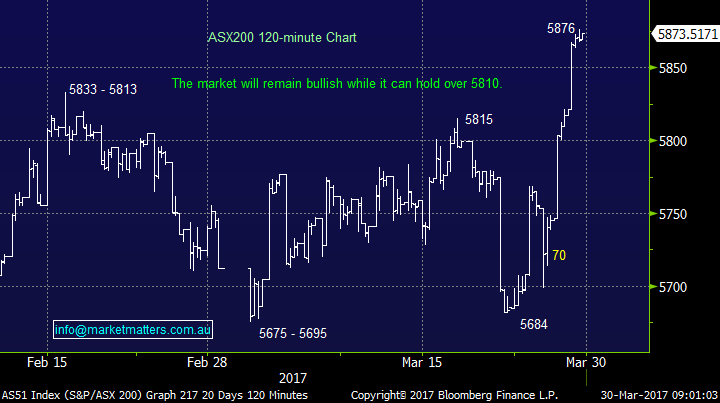
The ASX200 soared another 52-points yesterday to make fresh highs for 2017, we are now only 27-points away from our initial 5900 target. The market has jumped over 200-points in a few days and while we believe there will be plenty of buying into any pullbacks, we think the "easy money" for the break over the 5800 resistance area has gone. There is likely to have been some decent short-covering during the last 48 hours as the "sellers" of the 5800 area were forced to throw in the towel, but it's hard to imagine much more remaining. For now we will remain bullish stocks, unless the ASX200 closes under 5810 - this gives some excellent risk / reward for the aggressive subscribers. However for most of us, it's all about gauging how far stocks can rally in the coming weeks, before we start increasing our cash levels. Let's again look at some simple statistics for April, the seasonally strongest month for Australian equities. We are only interested in the markets characteristics, since the current bull market commenced in March 2009.
1. The average return for April over the last 8-years is 1.6%, with the market closing positive 62% of the time - this targets 5970 from current levels.
2. To match the average return following the January sell off, over the last 8-years, targets the 5960 area.
Hence, the numbers are telling us to be sellers from an index perspective in the 5950-6000 region. This again reminds us of the quote we used in our Weekend Report on the 12th of March.
"I never buy at the bottom and I always sell too soon". - Baron Rothschild 1840-1915.
Note at MM, we are now wearing our seller’s hat with the intention of becoming active over coming weeks.
We are likely to be dribble sellers into the anticipated April strength, as individual stocks achieve target levels. The only stocks we may consider buying in coming weeks are likely to be "situation stocks" with good risk / reward.
ASX200 120-mins Chart
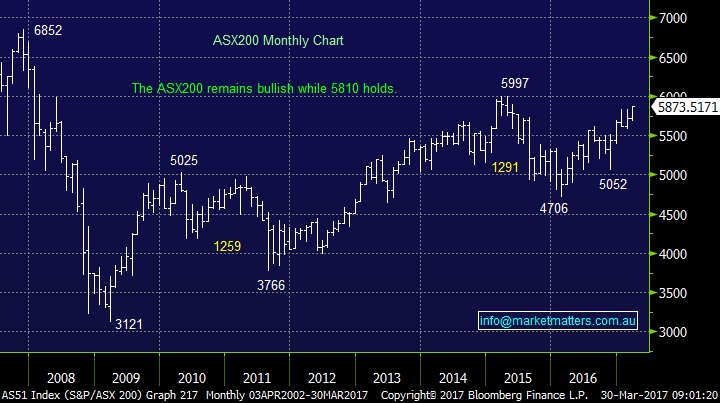
Now moving onto the very important fundamentals and where the AX200 is trading on a valuation perspective. Currently the local market is trading on just over 16x forward earnings, compared to the long term average closer to 15x. However, this is well below the extended 17x reached twice in recent years. Hence the market can easily push towards the psychological 6000 area, the ASX200's high since the GFC, before valuations are likely to bench many of today's buyers.
ASX200 Monthly Chart
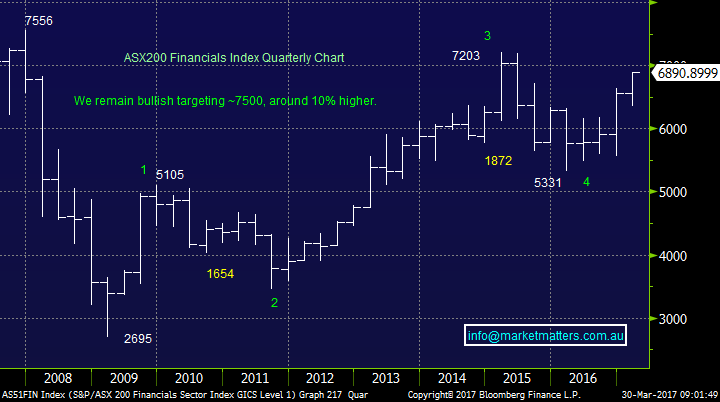
The "Big Four" local banks have been the driving force behind the ASX200's recent surge to fresh multi-month highs. In the last 5-days alone we have seen ANZ, NAB and Westpac all gain around 5% while CBA, which doesn't go ex-dividend in May, lagging slightly up 4.1%. In the medium term we remain very bullish the financials Index targeting a test of the pre-GFC all-time high i.e. another 8-9% higher.
When we take a quick glance at the "Big Four" we can see how much they have come back into vogue after the "yield play" was dumped back in April 2015 - interestingly that was another decent "top" in an April as we are targeting next month:
1. ANZ Bank (ANZ) $32.30 - ANZ fell 41.3% in 2015-6 but is now only 13.3% below its all-time high.
2. Commonwealth Bank (CBA) $86.14 - CBA fell 28.1% in 2015-6 but is now only 11.8% below its all-time high.
3. National Australia Bank (NAB) $35.14 - NAB fell 37.2% in 2015-6 but is now only 12.3% below its 2015 high.
4. Westpac (WBC) $35.14 - WBC fell 30.8% in 2015-6 but is now only 11.8% below its all-time high.
The first obvious take away from the Australian Banks over the last few years, is our current mantle of "remain open minded". If our major banks can tumble an average of 34.4% in under 18-months a overall market correction of ~25% is hardly an aggressive call, especially considering the magnitude of the global stock market rally since the GFC. Secondly, the price action of our banks has been a great example that fading the crowd can often produce the best results - most investors thought the banks were the go to for performance in 2015 and they couldn't fall, conversely they were hated around Christmas of 2016 - both human emotions were 100% wrong!
We are considering taking profit on our CBA holding into any April strength, while maintaining our holdings in ANZ and NAB for their May dividends - the goal would be to buy back into CBA 5-10% lower before its dividend in August.
ASX200 Financials Index Quarterly Chart
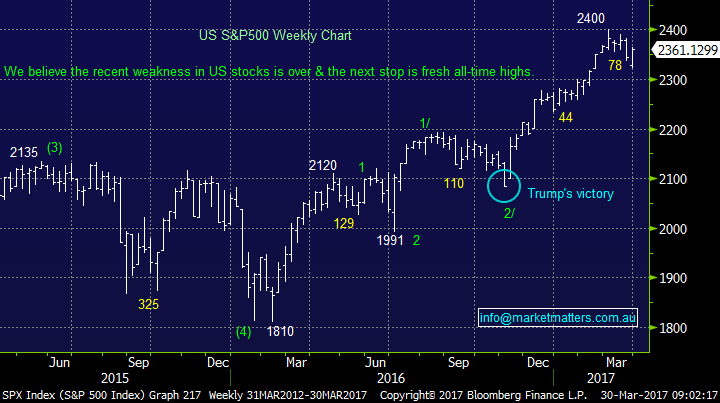
US stocks held the previous day’s strong gains overnight, with the Oil Sector doing most of the heavy lifting. We maintain our target in the 2430 area for the S&P500, around 3% higher, before a reasonable correction as we move into the bearish May-June period. If we are correct and US stocks gain 3%from here, then a rally locally to the 5950-6000 region is very realistic.
Our current favourite market index, the NASDAQ again closed positive last night and is only 0.16% below its all-time high. We remain bullish the NASDAQ which looks set to again make fresh all-time highs over the coming weeks.
US S&P500 Weekly Chart
Conclusion
We remain short-term bullish equities into April, unless the ASX200 breaks back under 5810 level.
However, we are now wearing our "seller’s hat" ideally with the intention of increasing cash levels in the 5950-6000 region.
Overnight Market Matters Wrap
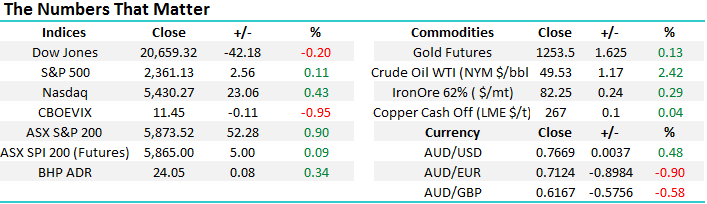
- Little change was experienced in the US share markets overnight, with the Dow down 0.2%, while the S&P 500 up 0.11%.
- Commodities were under the spotlight, particularly the energy market being the flavour of the day, after less than expected barrels of oil being reported in its inventories. Oil rallied 2.42% higher on the back of this.
- The June SPI Futures is indicating the ASX 200 to open 8 points higher, above the 5,880 level this morning. Note it is March Equity Options Expiry this afternoon.
Disclosure
Market Matters may hold stocks mentioned in this report. Subscribers can view a full list of holdings on the website by clicking here. Positions are updated each Friday.
Disclaimer
All figures contained from sources believed to be accurate. Market Matters does not make any representation of warranty as to the accuracy of the figures and disclaims any liability resulting from any inaccuracy. Prices as at 30/03/2017. 9.00AM.
Reports and other documents published on this website and email (‘Reports’) are authored by Market Matters and the reports represent the views of Market Matters. The MarketMatters Report is based on technical analysis of companies, commodities and the market in general. Technical analysis focuses on interpreting charts and other data to determine what the market sentiment about a particular financial product is, or will be. Unlike fundamental analysis, it does not involve a detailed review of the company’s financial position.
The Reports contain general, as opposed to personal, advice. That means they are prepared for multiple distributions without consideration of your investment objectives, financial situation and needs (‘Personal Circumstances’). Accordingly, any advice given is not a recommendation that a particular course of action is suitable for you and the advice is therefore not to be acted on as investment advice. You must assess whether or not any advice is appropriate for your Personal Circumstances before making any investment decisions. You can either make this assessment yourself, or if you require a personal recommendation, you can seek the assistance of a financial advisor. Market Matters or its author(s) accepts no responsibility for any losses or damages resulting from decisions made from or because of information within this publication. Investing and trading in financial products are always risky, so you should do your own research before buying or selling a financial product.
The Reports are published by Market Matters in good faith based on the facts known to it at the time of their preparation and do not purport to contain all relevant information with respect to the financial products to which they relate. Although the Reports are based on information obtained from sources believed to be reliable, Market Matters does not make any representation or warranty that they are accurate, complete or up to date and Market Matters accepts no obligation to correct or update the information or opinions in the Reports.
If you rely on a Report, you do so at your own risk. Any projections are estimates only and may not be realised in the future. Except to the extent that liability under any law cannot be excluded, Market Matters disclaims liability for all loss or damage arising as a result of any opinion, advice, recommendation, representation or information expressly or impliedly published in or in relation to this report notwithstanding any error or omission including negligence.
To unsubscribe. Click Here


