Looking to the FANG stocks for guidance (AAPL, GOOG, AMZN, FB, MSFT, NFLX)
The ASX200 closed up 17-points yesterday but noticeably again very close to the day’s high as it rallied from midday following some minor early morning weakness. There was unfortunately again little of interest on an index level although a few stocks had decent moves with the MM Growth Portfolio having a foot in both camps - a2 Milk (A2M) rallied +5.5% following an upbeat AGM while Nanosonics (NAN) slipped -2.1% after a downgrade from Bells.
The local market is currently proving very adept at picking the overnight swings in global markets e.g. rallying yesterday afternoon and this morning we switch on our Bloomberg’s to see the US S&P500 up ~0.65% testing the psychological 2600 area we tipped in yesterday’s Global Markets section. Thanksgiving is looming in the US on Thursday hence we expect to see their market quieten down from here.
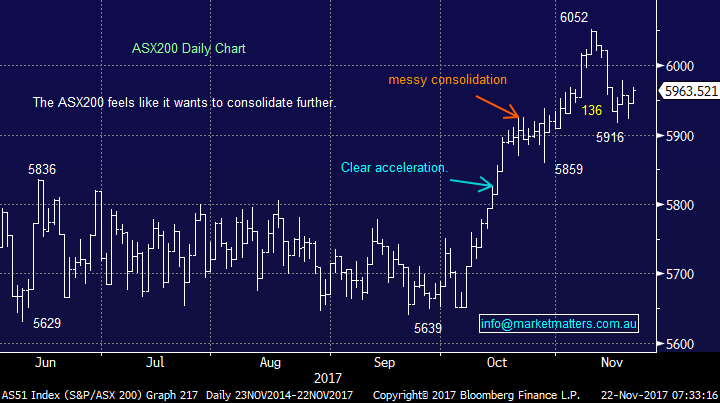
Technically the ideal picture for the ASX200 would be a rally up towards 5985 followed by another leg down towards the major support ~5850. While markets rarely give us the perfect scenario, especially over just a few weeks, it’s always best to have them clear just in case. For now we remain mildly short-term bearish local stocks having already corrected around half of the usual ~5% pullback in November. Conversely over the medium-term we remain bullish the ASX200 following its +7% advance since early October.
Today we are going to focus on the American FANG stocks who have led this 8 ½ year bull market since the GFC looking for any clues / indication of what lies ahead in 2018/9.
ASX200 Daily Chart
The American FANG stocks - plus 2.
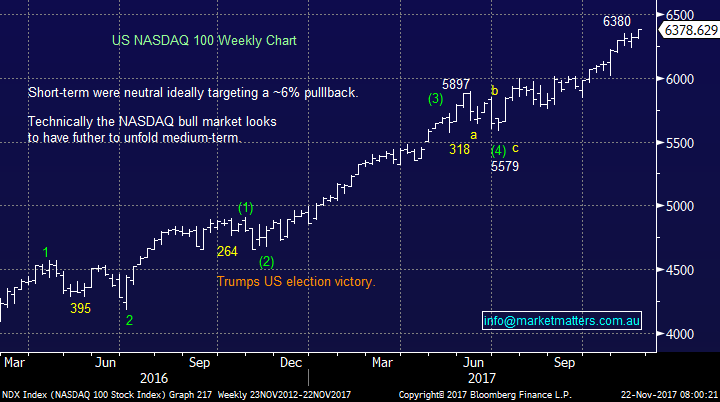
Last night the Tech heavy NASDAQ index rallied another +1.1% to make fresh 2017 highs, an extremely impressive +37% advance since Donald Trump’s election victory last November. The tech index has rallied well over double the broad based S&P500 and its clearly been the place to be overweight within the US market. The tech stocks influence on the overall US stock market is perfectly illustrated by just 5 stocks making up almost 15% of the S&P500 i.e. APPLE, Amazon, Facebook, Google and Microsoft.
While the often referred to FANG stocks are actually Facebook, Amazon, Netflix and Google its seems daft to ignore the hugely influential APPLE and Microsoft when looking at this current group of hot stocks.
At MM we often refer to the NASDAQ as the leading index and as such we monitor the index very closely. Ideally we will see a 4-500 point / 7% retracement for a buying opportunity but clearly there are no sell signals at present. However from a simple risk / reward perspective we must sit on the fence with a neutral view on this outperforming index. Hence today we have looked at the 6 hugely influential stocks within the index from a technical perspective for any clues moving forward to the next meaningful move / trend for equities.
US NASDAQ Weekly Chart
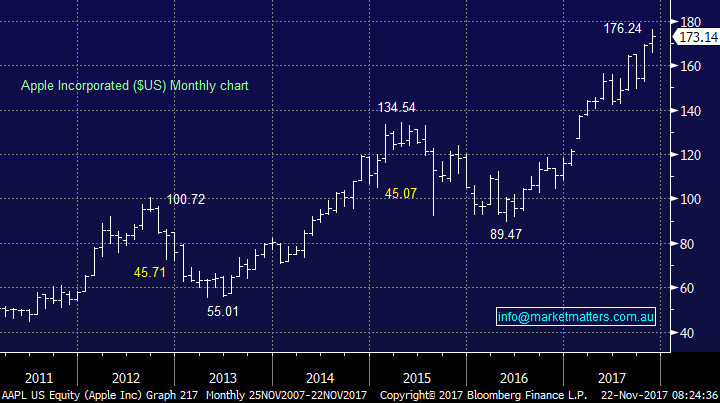
1 APPLE seems to go from strength to strength as the worlds hunger for the next iPhone continues to grow – funny I remember my first Nokia phone lasting years and having no desire to upgrade, that’s marketing for you!
Technically APPLE remains strong although the upside momentum has reduced over 2017.
APPLE Inc Monthly Chart
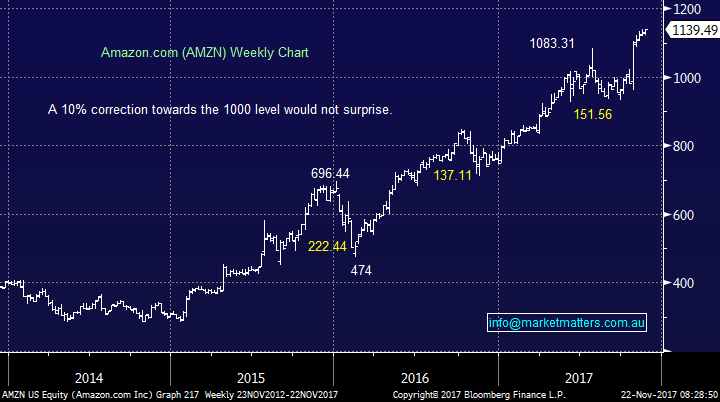
2 Amazon is very interesting technically and while there are no sell signals at present our “Gut Feel” is we will see decent ~10% correction in the not too distant future.
Amazon Weekly Chart
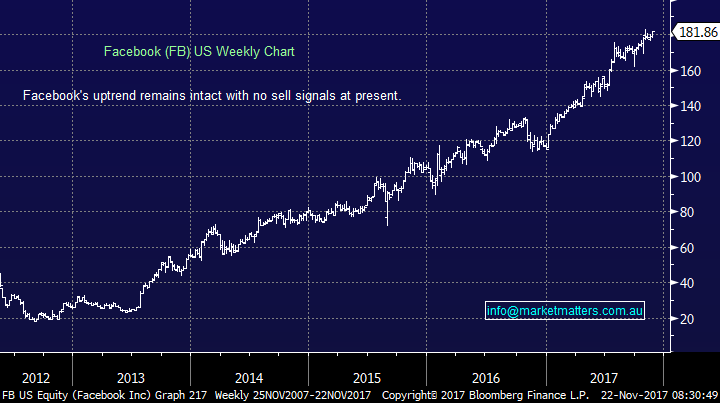
3 Facebook has a more limited technical picture to evaluate having only been listed for ~5-years but any decent correction looks like a buying opportunity for now.
Facebook Weekly Chart
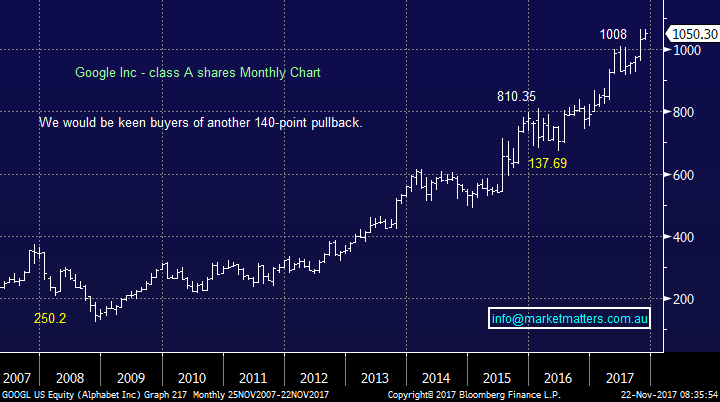
4 Google looks bullish but our preferred scenario would be a pullback towards 925 / over 10% for a buying opportunity.
Google Alphabet Monthly Chart
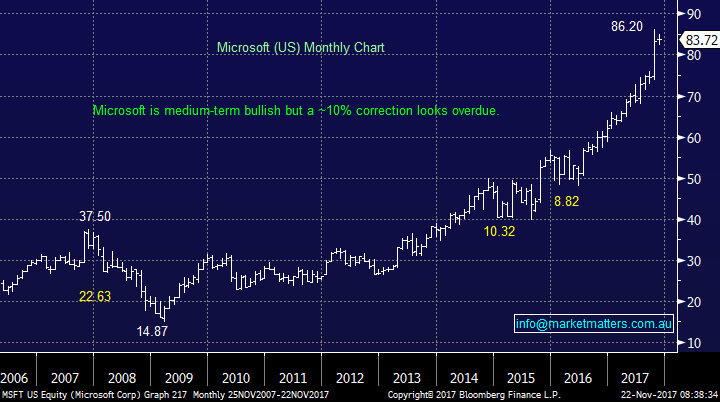
5 Microsoft looks fantastic at present and were keen buyers of any $8-10 correction.
Microsoft Monthly Chart
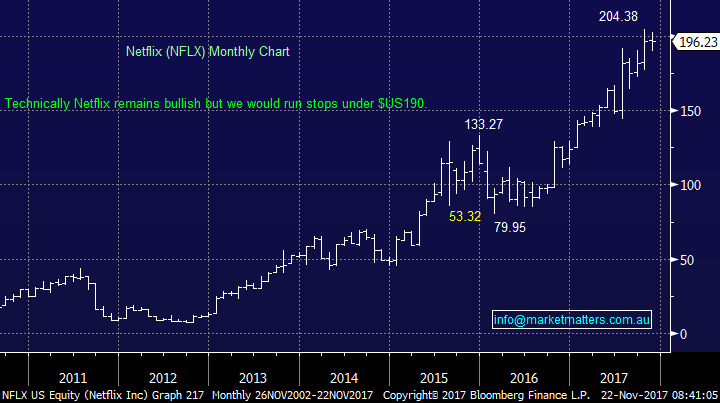
6 Netflix continues to look strong but its huge P/E of 156x est. earnings moving forward concerns us. We have to be neutral at present.
Netflix Monthly Chart
Global markets
US Stocks
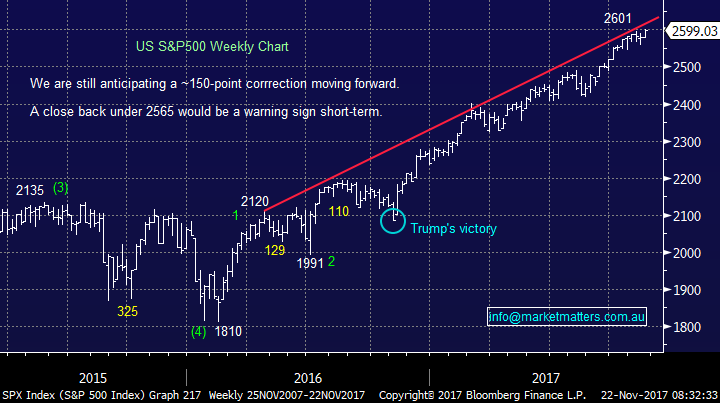
The US continues to oscillate around all-time highs and although we still need a ~5% correction to provide a decent risk / reward buying opportunity, no sell signals have been generated to-date. The S&P500 hit our target of 2600 last night and we now expect things to slow down into this week’s Thanksgiving holiday on Thursday.
US S&P500 Weekly Chart
European Stocks
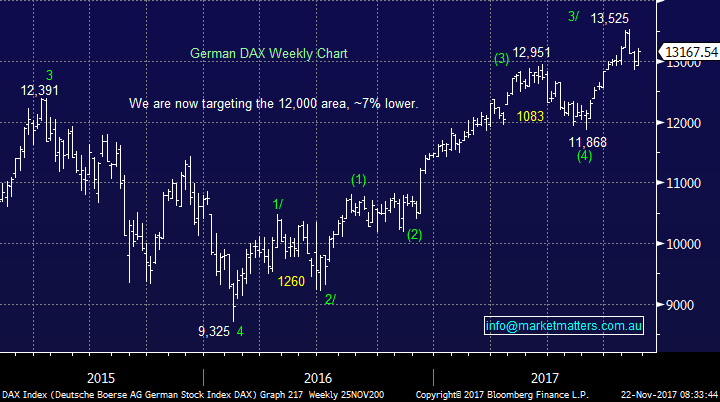
European stocks look to be failing after their recent break out to fresh 2017 highs, we are now neutral / negative Europe over the next few weeks.
German DAX Weekly Chart
Conclusion (s)
Not surprisingly when you look at 6 stocks in on index there are similarities but we can see some clear differences also:
- Microsoft is our preferred stock and we would buy any $8-10 correction.
- Amazon and Google both look strong but a 8-10% correction is our preferred scenario.
- Facebook and APPLE remain strong but we are neutral following recent strength.
- Netflix is our least favourite stock but no sell signals are apparent.
On balance our thoughts on Google and Amazon have us neutral the NASDAQ expecting a pullback to buy but no sell signals have been generated.
Overnight Market Matters Wrap
· All major US equity indices rallied and reached touched new highs overnight, from an upbeat of corporate earnings ahead of thanksgiving holiday tomorrow.
· The European region had a breather from the downside and generally closed higher with global growth as the catalyst
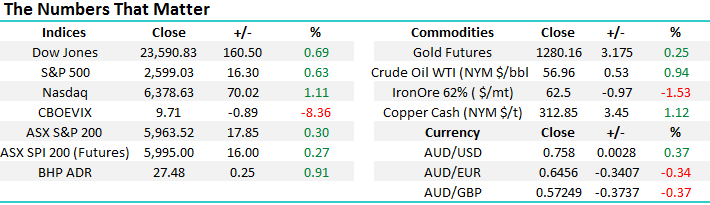
· Iron Ore closed 1.53% lower overnight, however BHP is expected to outperform the broader market after ending its US session up an equivalent of 0.91% from Australia’s previous close, helped by the strength from oil.
· The December SPI Futures is indicating the ASX 200 to open 11 points higher towards the 5695 area this morning.
Disclosure
Market Matters may hold stocks mentioned in this report. Subscribers can view a full list of holdings on the website by clicking here. Positions are updated each Friday, or after the session when positions are traded.
Disclaimer
All figures contained from sources believed to be accurate. Market Matters does not make any representation of warranty as to the accuracy of the figures and disclaims any liability resulting from any inaccuracy. Prices as at 22/11/2017. 8.00 AM.
Reports and other documents published on this website and email (‘Reports’) are authored by Market Matters and the reports represent the views of Market Matters. The MarketMatters Report is based on technical analysis of companies, commodities and the market in general. Technical analysis focuses on interpreting charts and other data to determine what the market sentiment about a particular financial product is, or will be. Unlike fundamental analysis, it does not involve a detailed review of the company’s financial position.
The Reports contain general, as opposed to personal, advice. That means they are prepared for multiple distributions without consideration of your investment objectives, financial situation and needs (‘Personal Circumstances’). Accordingly, any advice given is not a recommendation that a particular course of action is suitable for you and the advice is therefore not to be acted on as investment advice. You must assess whether or not any advice is appropriate for your Personal Circumstances before making any investment decisions. You can either make this assessment yourself, or if you require a personal recommendation, you can seek the assistance of a financial advisor. Market Matters or its author(s) accepts no responsibility for any losses or damages resulting from decisions made from or because of information within this publication. Investing and trading in financial products are always risky, so you should do your own research before buying or selling a financial product.
The Reports are published by Market Matters in good faith based on the facts known to it at the time of their preparation and do not purport to contain all relevant information with respect to the financial products to which they relate. Although the Reports are based on information obtained from sources believed to be reliable, Market Matters does not make any representation or warranty that they are accurate, complete or up to date and Market Matters accepts no obligation to correct or update the information or opinions in the Reports.
If you rely on a Report, you do so at your own risk. Any projections are estimates only and may not be realised in the future. Except to the extent that liability under any law cannot be excluded, Market Matters disclaims liability for all loss or damage arising as a result of any opinion, advice, recommendation, representation or information expressly or impliedly published in or in relation to this report notwithstanding any error or omission including negligence.
To unsubscribe. Click Here


