Looking for opportunities into the current weakness before July
Our timing with yesterday’s bullish themed report was far from perfect with the ASX200 getting smacked 70-points / 1.2% for no obvious reason. We were looking for a few days consolidation prior to further gains but now if there’s follow through with the savage nature of yesterday’s selling we will be forced to very quickly reassess our short-term opinion for local stocks. Within 24-hours the first 2 statistics that we quoted yesterday are already looking smack on the money:
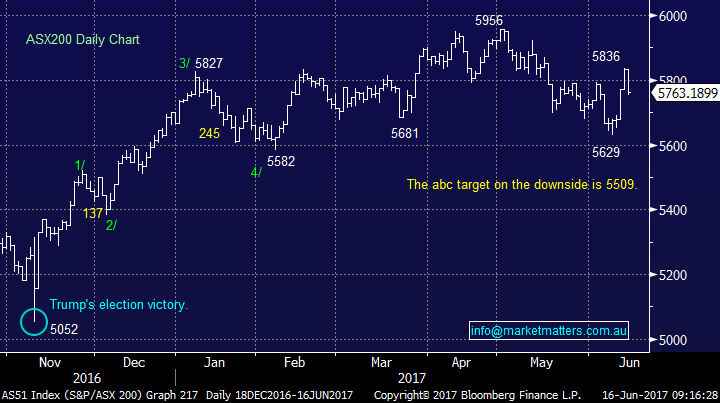
1. The ASX200 has already rallied 207-points from its June low making it unlikely to trade significantly higher over the coming 2-weeks.
2. The ASX200 has already rallied 159-points this week making it unlikely to trade much higher over the coming few days.
3. The ASX200’s average gain in July since the GFC is an impressive +4.3%, its been up 7 out of 8-years closing near its high on every one of these occasions.
While it remains statistically logical to be exposed to local stocks through July, when a 250-point rally appears a strong possibility, the obvious question is from what area. The next few days are likely to clear the muddy waters, we see 2 likely but very different scenarios unfolding over the next fortnight.
1. Yesterday’s aggressive selling was mainly due to the June option expiry, hence the ASX200 will hold above 5730 and then rally into July for the reasons outlined in the previous morning report.
2. Alternatively the local market has pre-empted an overdue~5% correction by US stocks. If this proves correct the ASX200 is likely to be headed towards the 5500 area.
After yesterday’s fall we remain comfortable with our 10% cash holding but today we are going to look at 3 stocks we are considering purchasing over the next fortnight, maintaining one eye on of financial year selling. Interestingly some of the best performing stocks yesterday have endured an awful 12-months implying that EOFY selling may largely be complete.
ASX200 Daily Chart
US Stocks
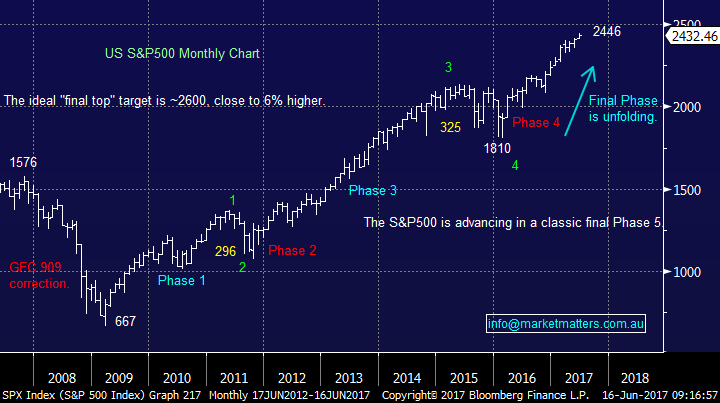
US stocks closed marginally lower last night after staging an impressive rally from their intra-day lows e.g. the Dow closed almost 100-points above its low and only a few points below its all-time high. There is no change to our technical picture that a 5% correction is looming on the horizon but no sell signals will be generated in the broad S&P500 until we see a close under 2400, or 1.3% lower.
US S&P500 Monthly Chart
With the MM portfolio already pretty full of the traditional sectors like banks and resources we’ve been scanning the market for situation style opportunities that will potentially have limited day to day correlation to the stocks we are currently holding.
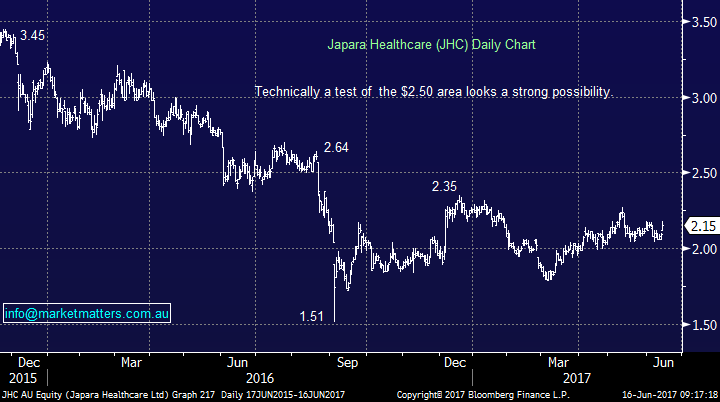
Japara Health (JHC) $2.15
The aged care and retirement living provider JHC enjoyed its best day of 2017 yesterday rallying an impressive 3.3% in a very weak market – the move also came on very large volume. The stock is now down ~11% for the past 12-months but is still trading on 19x estimated earnings for next year. Australia obviously has an ageing population and demand for aged care is a clear tailwind for JHC earnings, however the near term outlook and recent trends in terms of earnings is far from compelling. From a technical standpoint, we can buy around the $2.15 area targeting ~$2.50 but we would likely exit the stock if it fell back under $2.04. This creates a solid 3-1 risk reward trading opportunity.
Japara Health (JHC) Daily Chart
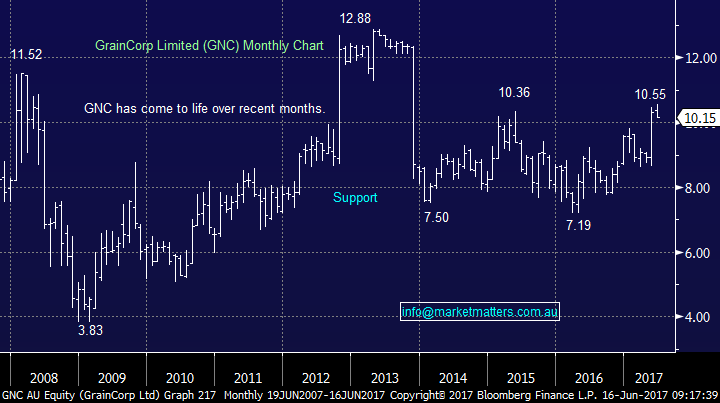
GrainCorp (GNC) $10.15
GNC provides grain industry related services in Australia and is currently trading on 14.9x estimated 2017 earnings – which is reasonable high for the very lumpy (and often unpredictable) earnings stream of this agricultural company. The stock has enjoyed an excellent 2017 making fresh 3-year highs in the last 2-weeks following a bumper east coast crop which led to a big beat in terms of earnings for the 1H.
The stock looks good technically closer to $10 on a further correction however stops would need to be run under $9.50. A small bonus is GNC also trades ex-dividend 15c fully franked on 30/6.
GrainCorp (GNC) Monthly Chart
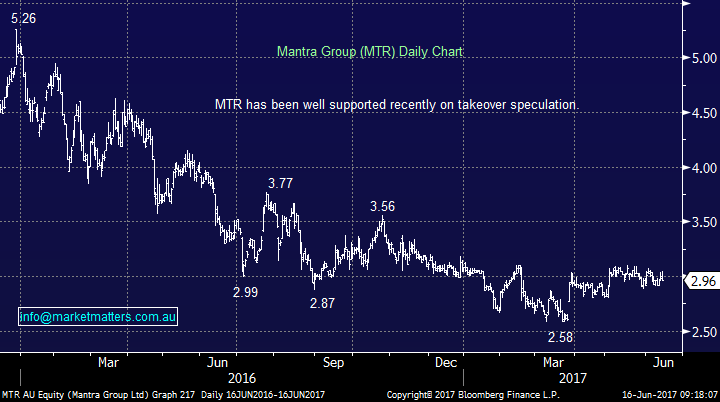
Mantra (MTR) $2.96
We originally sold out of MTR ~$3 in mid-January which felt the correct decision as the stock then tumbled towards $2.50. However it has now recovered over the last 3-months as ongoing takeover speculation has hit the newswires. We believe a takeover of MTR would make sense for a large overseas player for 2 standout reasons:
1. Australia remains an excellent growth area for global tourism with China only a relatively small distance away.
2. MTR is cheap relative to global peers
The stock is currently down over 15% for this financial year so it’s likely to be hit with some tax loss selling. The stock is trading on an est. P/E of 17.1 for 2017 and yields a 3.55% fully franked yield. We like the stock ~$2.90 technically.
Mantra (MTR) Daily Chart
Furthermore we still like MYR as a trade towards the 80c area as a higher risk contrarian play while we are considering taking a small profit on Telstra given our view that the “yield play” style stocks are close to a decent correction.
Conclusion(s)
We remain bullish the ASX200 over coming months still targeting a decent break over 6000 in 2017/8 but short-term yesterday’s aggressive sell-off has made the picture trickier.
We like JHC, GNC and MTR for some portfolio diversification or shorter term positional trades
Traders could look at MYR towards 80c as a trade while are considering taking a small profit on TLS.
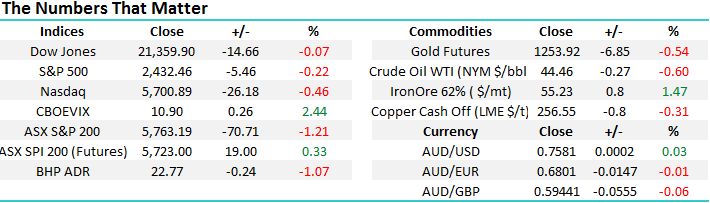
Overnight Market Matters Wrap
· The US indices continued its slight descent lower, with the NASDAQ 100 underperforming most.
· European stocks fell near a two month low as investors sold riskier assets in response to soft US economic data yesterday.
· The Bank of England voted 5-3 against raising interest rates for the first time in 10 years. Most pundits had expected a vote of 7-1 so the closeness of the vote surprised the market.
· Oil and gold were weaker while iron ore added 1.5%.
· The June SPI Futures is indicating the ASX 200 to open 18 points higher, towards the 5780 level this morning.
Disclosure
Market Matters may hold stocks mentioned in this report. Subscribers can view a full list of holdings on the website by clicking here. Positions are updated each Friday.
Disclaimer
All figures contained from sources believed to be accurate. Market Matters does not make any representation of warranty as to the accuracy of the figures and disclaims any liability resulting from any inaccuracy. Prices as at 16/06/2017. 8.00AM.
Reports and other documents published on this website and email (‘Reports’) are authored by Market Matters and the reports represent the views of Market Matters. The MarketMatters Report is based on technical analysis of companies, commodities and the market in general. Technical analysis focuses on interpreting charts and other data to determine what the market sentiment about a particular financial product is, or will be. Unlike fundamental analysis, it does not involve a detailed review of the company’s financial position.
The Reports contain general, as opposed to personal, advice. That means they are prepared for multiple distributions without consideration of your investment objectives, financial situation and needs (‘Personal Circumstances’). Accordingly, any advice given is not a recommendation that a particular course of action is suitable for you and the advice is therefore not to be acted on as investment advice. You must assess whether or not any advice is appropriate for your Personal Circumstances before making any investment decisions. You can either make this assessment yourself, or if you require a personal recommendation, you can seek the assistance of a financial advisor. Market Matters or its author(s) accepts no responsibility for any losses or damages resulting from decisions made from or because of information within this publication. Investing and trading in financial products are always risky, so you should do your own research before buying or selling a financial product.
The Reports are published by Market Matters in good faith based on the facts known to it at the time of their preparation and do not purport to contain all relevant information with respect to the financial products to which they relate. Although the Reports are based on information obtained from sources believed to be reliable, Market Matters does not make any representation or warranty that they are accurate, complete or up to date and Market Matters accepts no obligation to correct or update the information or opinions in the Reports.
If you rely on a Report, you do so at your own risk. Any projections are estimates only and may not be realised in the future. Except to the extent that liability under any law cannot be excluded, Market Matters disclaims liability for all loss or damage arising as a result of any opinion, advice, recommendation, representation or information expressly or impliedly published in or in relation to this report notwithstanding any error or omission including negligence.
To unsubscribe. Click Here


