Looking at 5 major movers yesterday (CBA, FXL, BTT, A2M, AAD)
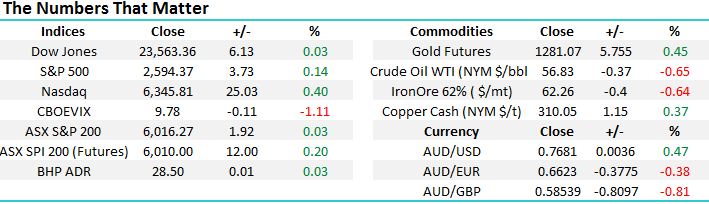
The local market remains strong as we enter its seasonally vulnerable mid-November period, as we’ve identified previously the average pullback since the GFC around this time of year is over 5% for the ASX200 and over 6% for market heavyweight CBA. While there are no sell signals being generated at present just a sniff can create a self-fulfilling move as investors become wary of history – just like in October when we surged with no obvious catalyst.
A few factors we are mulling over on the 1-year anniversary of Donald Trump’s amazing win for the White House – namely the clear lack of volatility coupled with the unabated grind higher by US equities:
- The US S&P500 has rallied almost 25% from the low on the day when Trump stunned the world.
- Ratings say he’s the most unpopular President ever but stocks don’t care as the US economy remains sound – evidence of this is in the labour market where almost 2 million new jobs have been created in the last 12-months.
- In the US fund manager cash levels are at 4.8%, actually a bullish indicator being above the last 10-years average of 4.5%.
- Since Trumps victory and the epic share market rally we’ve only experienced 2 noticeable corrections of around 3%.
Following Octobers 4% surge we remain bullish the local market for now and would be keen to allocate our 11.5% cash position into stock / sector or market weakness that was created if / when we get a ~5% pullback by US equities.
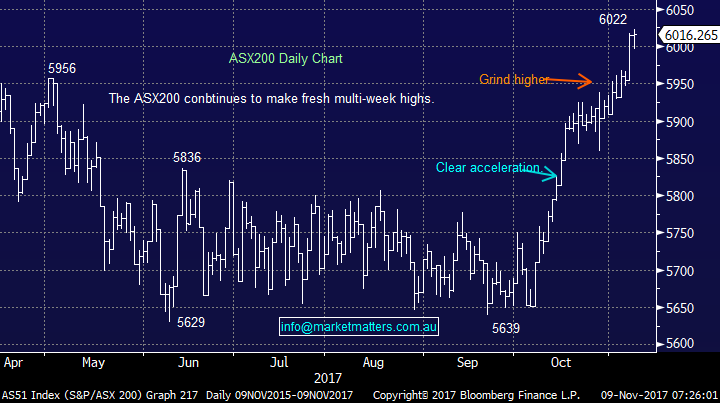
- We remain bullish the ASX200 into 2018 targeting a solid break over this 6000 area.
- We would need a break back under 5825 to lose this short-term bullish outlook.
ASX200 Daily Chart
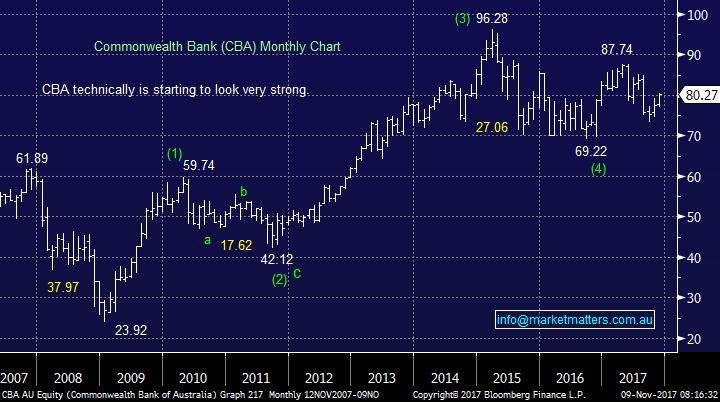
1 Commonwealth Bank (CBA) +2.65%.
CBA had a great day yesterday rallying over $2 following a healthy quarterly update from the bank. Analysts continue to underestimate CBA leading to upside “pops” like we saw yesterday, it’s now by far the best performer out of the “Big 4” over the last month although NAB is the leader over the last 12-months. The papers are now talking upgrades but yesterday’s rally is likely to have built some of this optimism into the price.
We followed our plan yesterday reducing our Growth Portfolio holding in CBA to 3% as we enter its historically weak mid-November period. Please note we still have a 28% exposure to Australian banks in that portfolio, plus a 12% holding in the highly correlated Suncorp (SUN). Basically we believe this is an optimum time to take our banking exposure back to slightly overweight after being heavily overweight for October i.e. prior to our profit taking in CYB and CBA.
- NAB starts the November dividend bonanza today with ANZ and Westpac to follow both next Monday on the 13th.
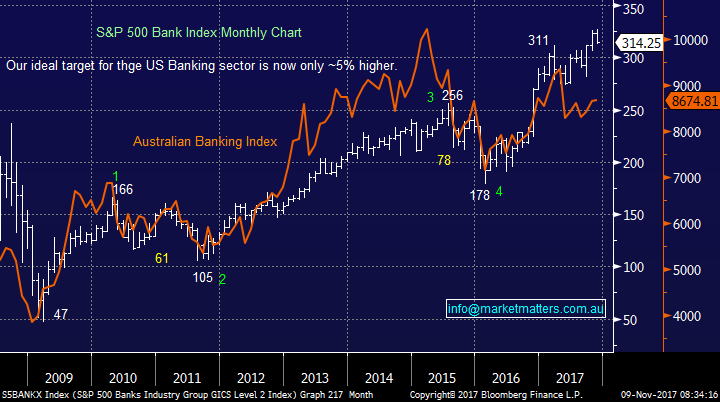
US banks have now fallen for the last 9-days without a rest as the yield curve moves against them. Historically the correlation between our banks and those in the US is solid, especially in the long-term, but we failed to rally to fresh all-time highs like they did over recent months hence it’s no surprise that we’ve ignored the latest small pullback to-date.
Ideally, local banks experience some seasonal weakness and which time we may consider again increasing our holdings.
Commonwealth Bank (CBA) Monthly Chart
US S&P500 Banking Index v Australian Banking Index Monthly Chart
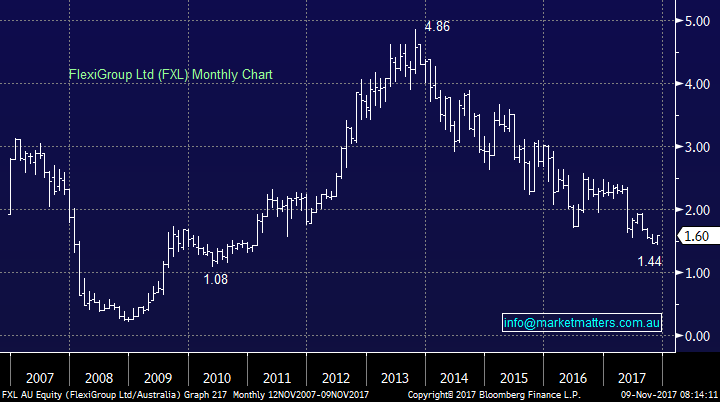
2 Flexi Group (FXL) +5.3%
FXL enjoyed a bounce yesterday but it’s been an awful few year for FXL who made fresh 6-year lows this month. This is a sector under increasing competitive pressures from smarter and more nimble tech players and simply FXL management have failed to convince the market about their ‘growth plans’. The 4.8% fully franked yield we think is a trap. FXL undoubtedly will have more great bounces for the aggressive trader and a ~20% rally from this $1.50 area feels a strong possibility but this is more trading stuff, not quality investing.
FlexiGroup (FXL) Monthly Chart
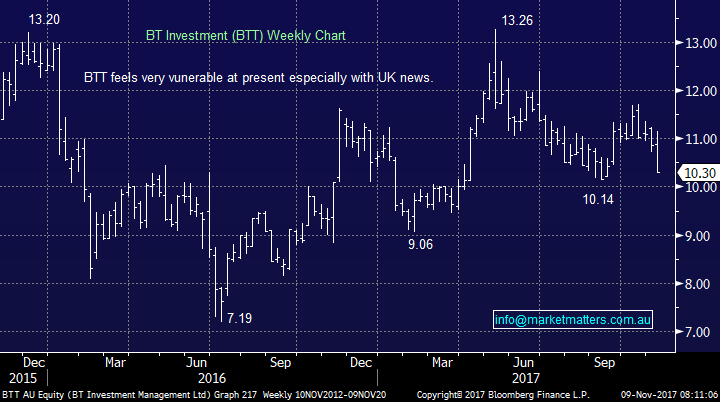
3 BT Investment (BTT) -5.8%.
BTT shares fell almost 6% yesterday following the release of its full-year results highlighting a 51% fall in performance fees. We see no reason to buy BTT at present preferring Macquarie (MQG) into any weakness, however do note that often good funds that have a poor short term record will likely bounce back and buying into the ‘performance doom’ can often be a good strategy.
BT Investment (BTT) Weekly Chart
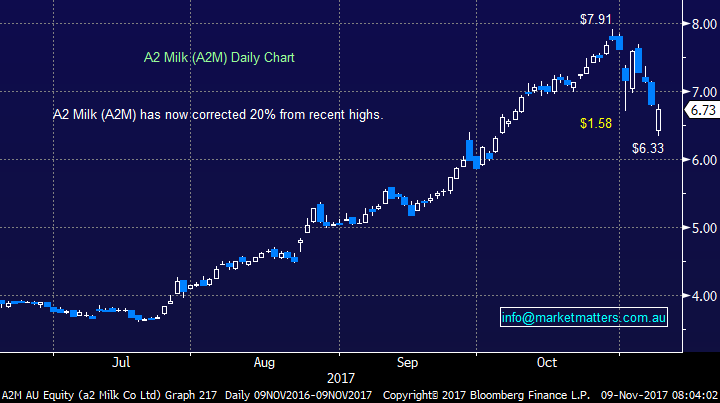
4 A2 Milk (A2M) - 1%.
The final drop of 1% does not tell the whole story with A2M trading down almost 7% in the morning enabling us to get long under $6.50 and actually show a nice +4.2% paper profit by the days end. Following the recent 20% correction we believe it’s now time to sit back and wait for the next AGM / update from management but interestingly we have seen some great recovery stories in 2017 following 20% corrections by a few stocks.
A2 Milk (A2M) Daily Chart
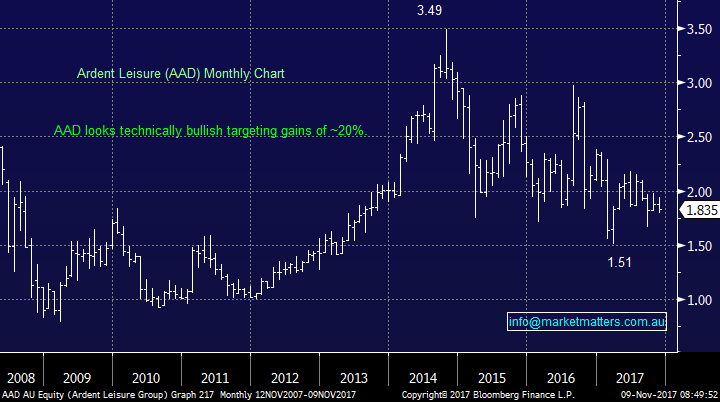
5 Ardent Leisure Group (AAD) -2.7%.
AAD shares fell close to 4% at one stage before bouncing slightly following the shock resignation of its CEO after less than 6-months – hard to interpret this positively. Strangely the business is now performing well and should meet its annual guidance. Technically the stock looks positive and this may actually be providing a buying opportunity for the brave / aggressive investor.
Ardent Leisure Group (AAD) Monthly Chart
Global markets
US Stocks
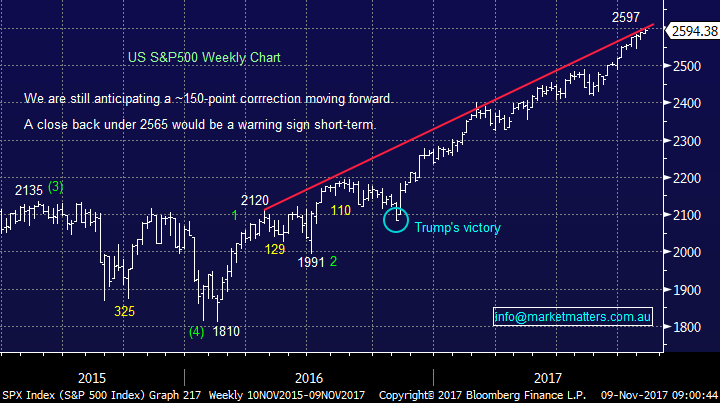
The US continues to oscillate around all-time highs and although we need a ~5% correction to provide a decent risk / reward buying opportunity, no sell signals have been generated to-date.
US S&P500 Index Weekly Chart
European Stocks
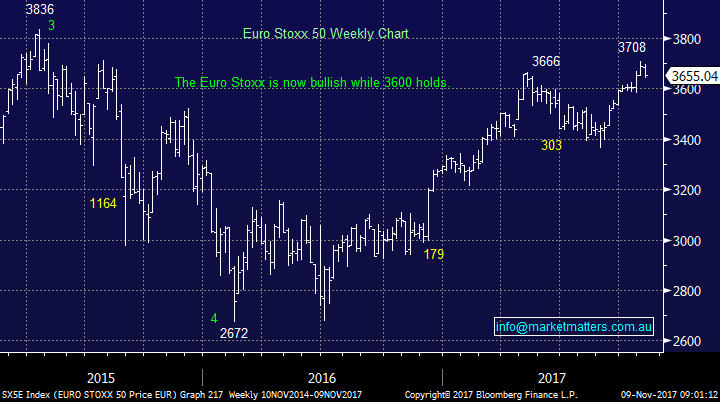
European stocks have broken out to fresh 2017 highs and are now bullish technically while the 3600 area holds i.e. ~2.7% lower.
Euro Stoxx 50 Weekly Chart
Conclusion (s)
Of the 5 stocks looked at today we unfortunately see no standout opportunities following our action yesterday.
Overnight Market Matters Wrap
· The US equity markets continue to climb marginally higher, led by the technology sector, whilst its financials were the laggard as investors remain wary on the tax reform to come to fruition.
· Commodities were mixed. Oil prices retreated from recent highs, copper and gold prices firmed, while iron ore settled slightly weaker.
· The December SPI Futures is indicating the ASX 200 to open 5 points higher, above the 6020 level this morning.
Disclosure
Market Matters may hold stocks mentioned in this report. Subscribers can view a full list of holdings on the website by clicking here. Positions are updated each Friday, or after the session where positions are traded.
Disclaimer
All figures contained from sources believed to be accurate. Market Matters does not make any representation of warranty as to the accuracy of the figures and disclaims any liability resulting from any inaccuracy. Prices as at 9/11/2017. 8.00 AM.
Reports and other documents published on this website and email (‘Reports’) are authored by Market Matters and the reports represent the views of Market Matters. The MarketMatters Report is based on technical analysis of companies, commodities and the market in general. Technical analysis focuses on interpreting charts and other data to determine what the market sentiment about a particular financial product is, or will be. Unlike fundamental analysis, it does not involve a detailed review of the company’s financial position.
The Reports contain general, as opposed to personal, advice. That means they are prepared for multiple distributions without consideration of your investment objectives, financial situation and needs (‘Personal Circumstances’). Accordingly, any advice given is not a recommendation that a particular course of action is suitable for you and the advice is therefore not to be acted on as investment advice. You must assess whether or not any advice is appropriate for your Personal Circumstances before making any investment decisions. You can either make this assessment yourself, or if you require a personal recommendation, you can seek the assistance of a financial advisor. Market Matters or its author(s) accepts no responsibility for any losses or damages resulting from decisions made from or because of information within this publication. Investing and trading in financial products are always risky, so you should do your own research before buying or selling a financial product.
The Reports are published by Market Matters in good faith based on the facts known to it at the time of their preparation and do not purport to contain all relevant information with respect to the financial products to which they relate. Although the Reports are based on information obtained from sources believed to be reliable, Market Matters does not make any representation or warranty that they are accurate, complete or up to date and Market Matters accepts no obligation to correct or update the information or opinions in the Reports.
If you rely on a Report, you do so at your own risk. Any projections are estimates only and may not be realised in the future. Except to the extent that liability under any law cannot be excluded, Market Matters disclaims liability for all loss or damage arising as a result of any opinion, advice, recommendation, representation or information expressly or impliedly published in or in relation to this report notwithstanding any error or omission including negligence.
To unsubscribe. Click Here


