Looking at 3 Australian Lithium Stocks (OZL, NAN, MIN, AJM, PLS)
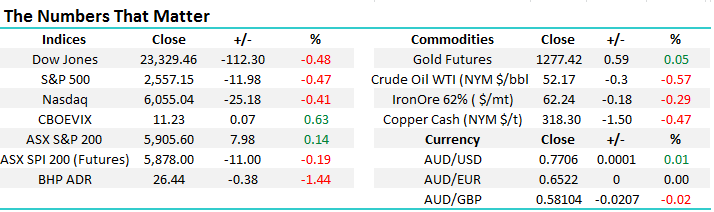
Yesterday, the ASX200 only managed to close up 8 points / 0.15%, ignoring reasonable overseas leads. It will be interesting to see if we embrace the more negative markets we have woken up to this morning i.e. US stocks down around 0.5%, plus commodities and their respective stocks lower.
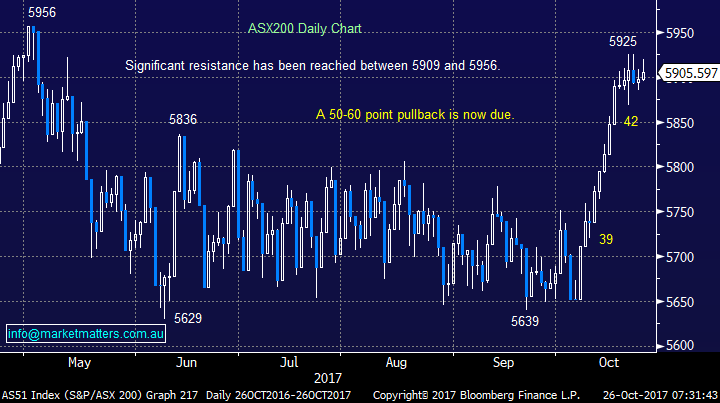
We remain short-term negative our market targeting a minimum 50-point / 1% pullback, with the below levels firmly in our mind:
- Initial support comes in at 5870 and which expect to see this area reached this week.
- Our optimum buying level is between 5825 and 5850.
- Importantly, our bullish view into early 2018 will be negated by a break back under 5800.
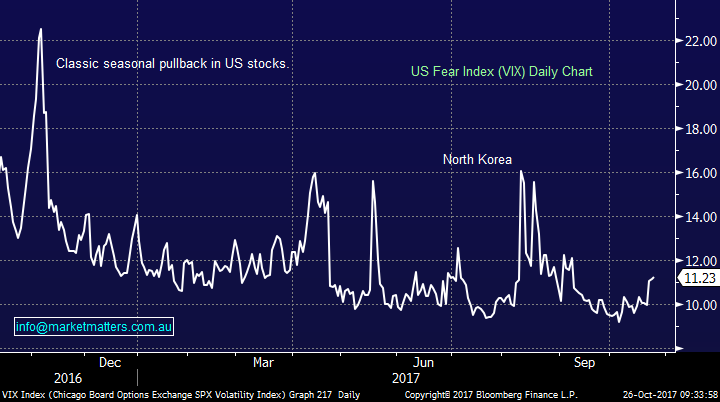
Sector / stock rotation continues to be the main “game” in town with our banking / financial sectors remaining firm, while retailers in particular have been under pressure e.g. Wesfarmers (WES) fell almost 3% yesterday. Interestingly US markets are playing a similar tune, while the VIX has recently showed slightly increasing nervousness with investors towards the overall market, the volatility of individual stocks has been huge as reporting season gets underway i.e. well over 50 companies have gyrated by over 4% after reporting, the largest swings in 5-years.
The MM Growth Portfolio is now holding a 15% cash position following our purchase of Nanosonics (NAN) yesterday. Volatility is slowly on the rise as we approach the seasonally choppy November, hence we remain confident of finding some good buying opportunities in the days / weeks ahead – we are still in the market looking to allocate 3% of the portfolios into Oz Minerals (OZL) under $8.25 which feels a strong possibility this week.
*Watch for further alerts.
ASX200 Daily Chart
US Fear Index (VIX) Daily Chart
The Lithium Story
Lithium is the new buzz commodity in town as many investors get excited about huge potential growth in lithium usage for storage batteries for the likes of cars – the Tesla success story has certainly helped here. The big question is how far down the euphoria curve have we already travelled e.g. AVZ Minerals has already surged over 1000% this year alone, on hope! With stocks rallying similar to the DOT Com. Boom, prior to the “Tech Wreck”, the initial simple conclusion is this is currently a high risk sector.
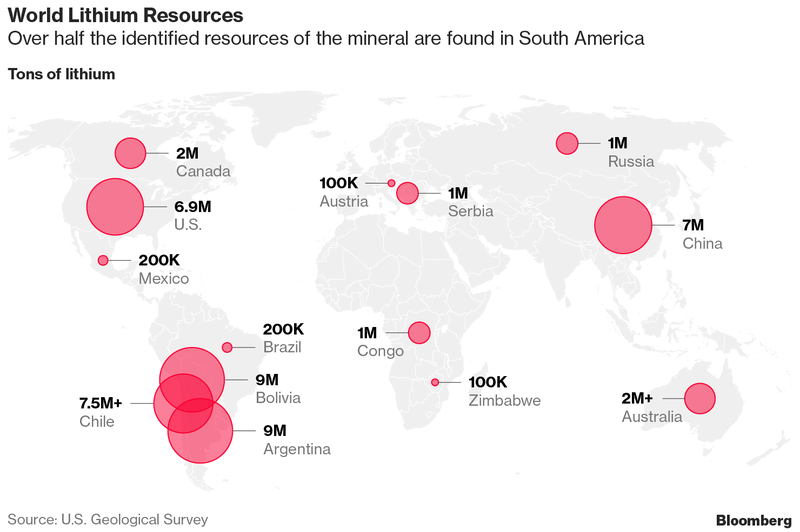
Australia is reasonably well positioned when it comes lithium but are far from the dominant player from a total reserves perspective but we are leading over the next 5-10 years.
The lithium price has doubled in the last 2-years, but surely this is not enough to send stocks up over 1000% without any runs on the board.
Lithium ($US/ton) Monthly Chart
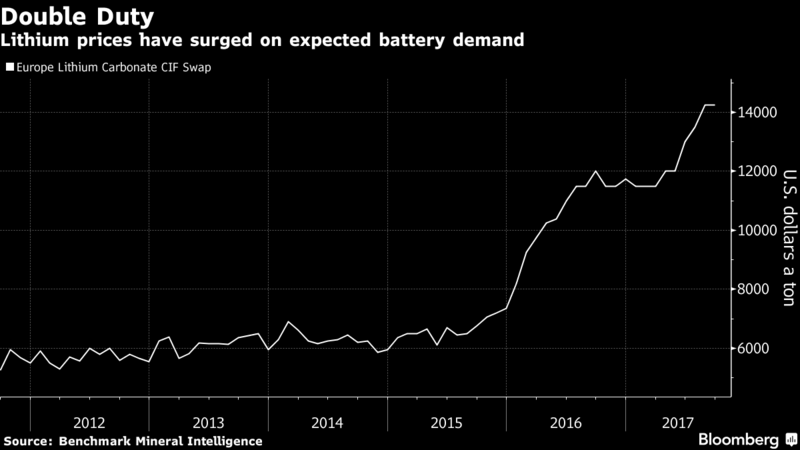
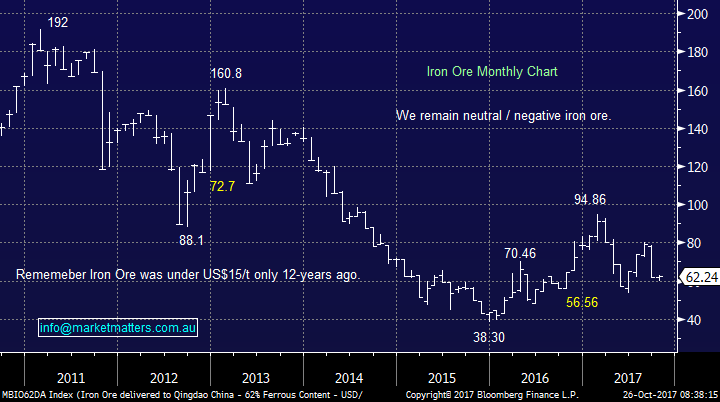
Investors must remain conscious about simple and fundamental supply and demand which ultimately dictates the direction of all asset prices. Global lithium production increased by over 10% last year, with batteries accounting for fewer than 40% of the consumption – clearly the growth area. Without wanting to bang a pessimistic drum, remember what happened to iron ore? It collapsed once supply exceeded demand and supply will increase with lithium. The 2 questions:
1 Can supply match increasing demand for batteries?
2 Which companies will be successful from expansion in lithium production? - Not everyone, just think of Atlas Iron.
Iron Ore Monthly Chart
Considering 3 Local Stocks
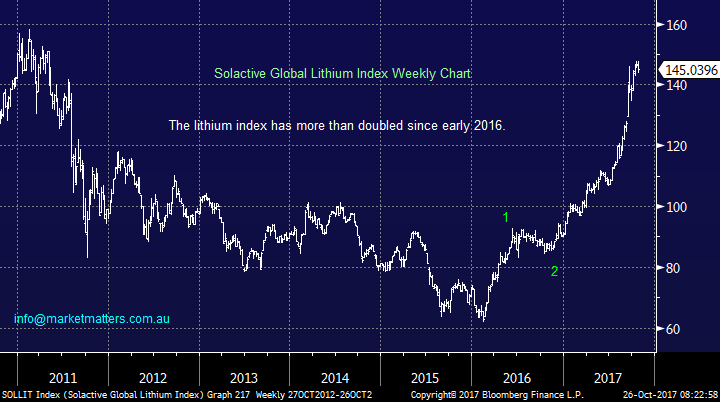
We already have a lithium stock ETF in the US which reflects the “Solactive Global Lithium index”, technically we like the index, but from a risk / reward perspective would only be buyers of a ~6% correction – one things for sure is the lithium space will continue to be volatile and opportunities will present themselves.
The exciting number is well over 50% of planned supply additions are focused in Australia – happily we can play this theme with local stocks.
Solactive Global Lithium Index Weekly Chart
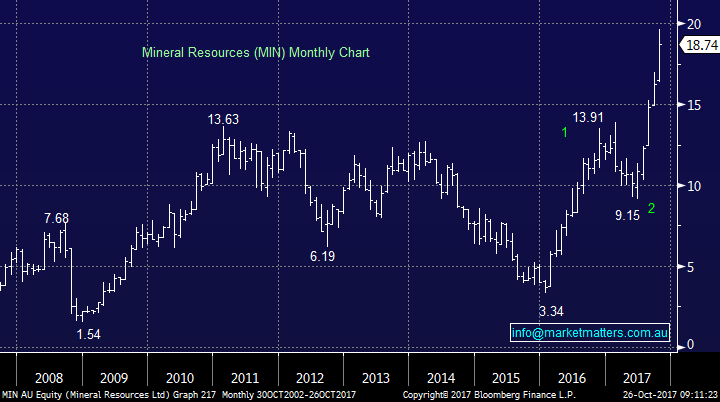
1 Mineral Resources Ltd (MIN) $18.74
MIN is the big player within the sector with a market cap. of $3.5bn, the stock already makes a profit and pays a 3.3% fully franked dividend from its crushing services to the mining industry. MIN has the largest known hard rock deposit, Wodgina mine, which is a clear feather in their cap.
We like this quality operator at current levels / into any weakness, but the risk / reward is not too exciting.
Mineral Resources (MIN) Monthly Chart
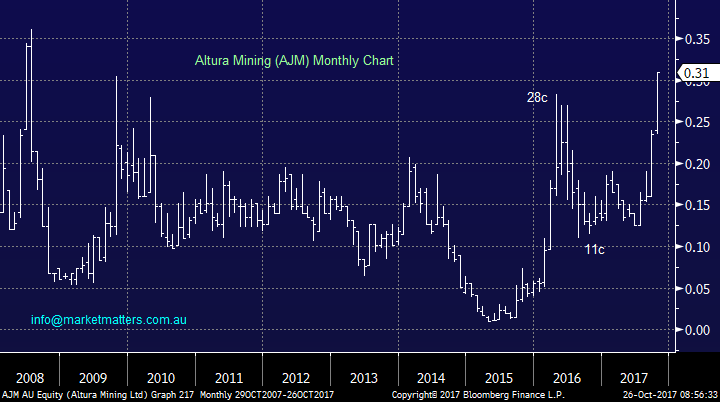
2 Altura Mining (AJM) 31c
AJM is expected to commence operations in Q1 of 2018, only a few months away. While the company is looking at rapid expansion investors must be aware of the companies relatively small $543m market Cap. MIN looks better value.
Altura Mining (AJM) Monthly Chart
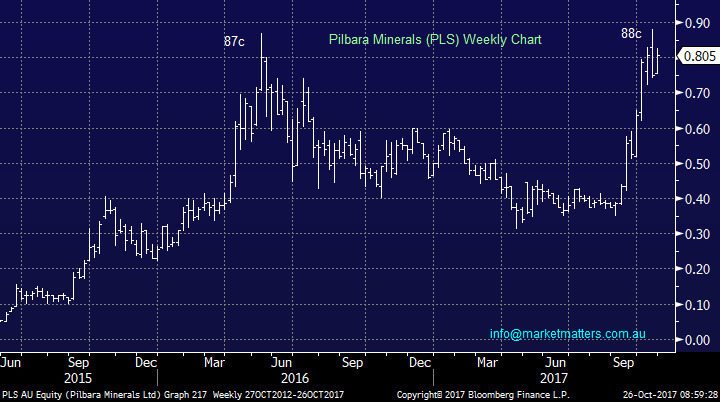
3 Pilbara Minerals Ltd (PLS) 80.5c
PLS owns a site with the capacity to become the world’s second-largest hard rock lithium mine, but again a $1.22bn market cap. feels rich compared to MIN.
Pilbara Minerals (PLS) Weekly Chart
Recent / Potential activity for the MM Growth Portfolio
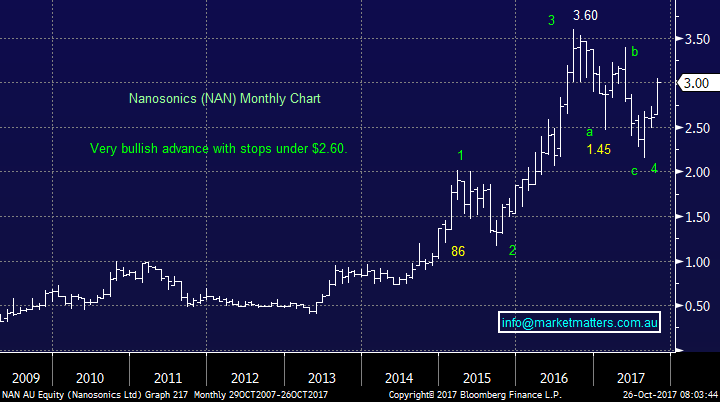
1 Nanosonics (NAN) $3.00
Yesterday we bought NAN at $2.89, we were very lucky on entry as the stock shot up fairly early in the morning – for subscribers who missed out we would remain comfortable buying under $3.
NAN is a life science company with a market cap. of just under $900m. We are bullish targeting fresh 2016-7 highs up towards the $4 area.
Nanosonics (NAN) Monthly Chart
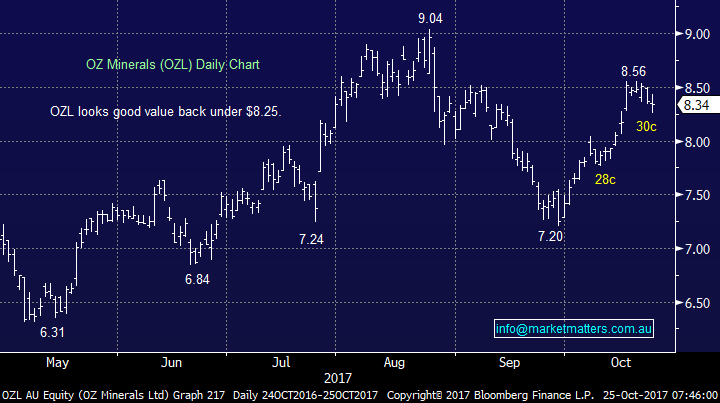
2 Oz Minerals (OZL) $8.34
We remain in the market looking to commence accumulating OZL below $8.25, last night’s weakness in stocks and copper will hopefully assist our buying today.
Oz Minerals (OZL) Daily Chart
Global Markets today
US Stocks
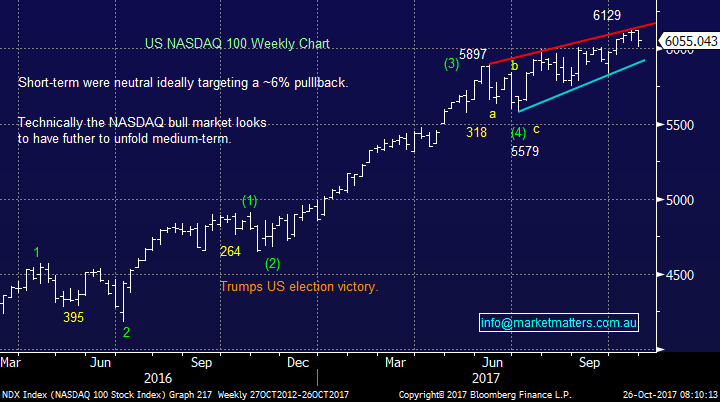
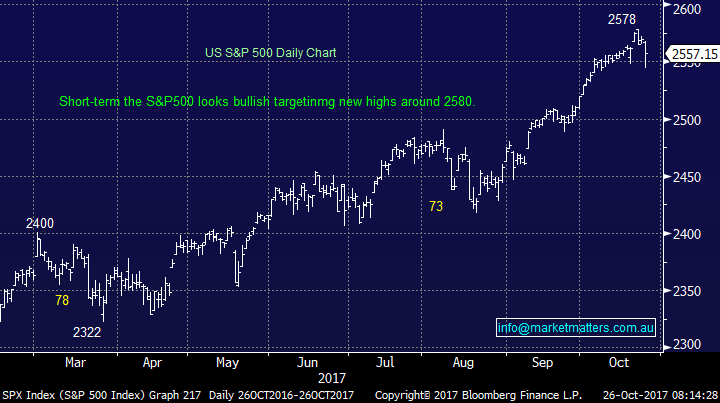
Last night the broad based S&P500 closed down 0.5% after bouncing healthily from an aggressive sell-off during the day, we can see another all-time high short-term but we believe this market is looking for a top of sorts.
There remains no change to our short-term outlook for US stocks, ideally we are targeting / need a ~5% correction before the risk / reward will again favour buying this market.
US NASDAQ Weekly Chart
US S&P500 Daily Chart
European Stocks
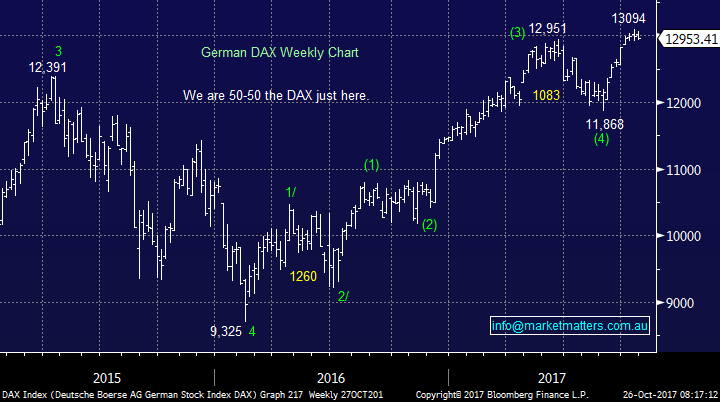
Yet again no change, European stocks have now made the fresh highs we anticipated, but MM would not be surprised to see this rally fail and another pullback towards 12,000 unfold for the German DAX.
German DAX Weekly Chart
Conclusion (s)
Stocks look close to a reasonable correction, but this remains likely to be another good buying opportunity, although perhaps the last one for a while.
We like the lithium space for now although we anticipate increased volatility moving forward – MIN is our preferred choice in the sector.
Overnight Market Matters Wrap
· Mixed earnings numbers overnight led to the relentless bull markets on Wall St losing ground, with the each of the 3 key indices falling close to 0.5% - the biggest pullback in 7 weeks.
· The mix of disappointing earnings, which in particular saw AT&T and Boeing slumping around 4%, combined with internal Republican criticism of President Trump, causing concerns over the timing of the proposed tax cut bill.
· Commodity currencies such as the A$ and C$ weakened while US Treasuries sold off further on expectations of a US rate hike before year's end. This saw the A$ below US77c for the first time since mid-July and US ten year bonds weaker, trading as high as 2.47% during the day, their highest level in 6 months.
· Commodities were mixed with gold slightly firmer, oils slightly weaker and little change in industrial metals. Both however BHP and RIO suffered 2% declines in US trading. The futures are pointing to a slightly weaker opening on the local exchange
· The December SPI Futures is indicating the ASX 200 to test the 5900 level this morning.
Disclosure
Market Matters may hold stocks mentioned in this report. Subscribers can view a full list of holdings on the website by clicking here. Positions are updated each Friday, or after the session when positions are traded.
Disclaimer
All figures contained from sources believed to be accurate. Market Matters does not make any representation of warranty as to the accuracy of the figures and disclaims any liability resulting from any inaccuracy. Prices as at 26/10/2017. 8.00AM.
Reports and other documents published on this website and email (‘Reports’) are authored by Market Matters and the reports represent the views of Market Matters. The MarketMatters Report is based on technical analysis of companies, commodities and the market in general. Technical analysis focuses on interpreting charts and other data to determine what the market sentiment about a particular financial product is, or will be. Unlike fundamental analysis, it does not involve a detailed review of the company’s financial position.
The Reports contain general, as opposed to personal, advice. That means they are prepared for multiple distributions without consideration of your investment objectives, financial situation and needs (‘Personal Circumstances’). Accordingly, any advice given is not a recommendation that a particular course of action is suitable for you and the advice is therefore not to be acted on as investment advice. You must assess whether or not any advice is appropriate for your Personal Circumstances before making any investment decisions. You can either make this assessment yourself, or if you require a personal recommendation, you can seek the assistance of a financial advisor. Market Matters or its author(s) accepts no responsibility for any losses or damages resulting from decisions made from or because of information within this publication. Investing and trading in financial products are always risky, so you should do your own research before buying or selling a financial product.
The Reports are published by Market Matters in good faith based on the facts known to it at the time of their preparation and do not purport to contain all relevant information with respect to the financial products to which they relate. Although the Reports are based on information obtained from sources believed to be reliable, Market Matters does not make any representation or warranty that they are accurate, complete or up to date and Market Matters accepts no obligation to correct or update the information or opinions in the Reports.
If you rely on a Report, you do so at your own risk. Any projections are estimates only and may not be realised in the future. Except to the extent that liability under any law cannot be excluded, Market Matters disclaims liability for all loss or damage arising as a result of any opinion, advice, recommendation, representation or information expressly or impliedly published in or in relation to this report notwithstanding any error or omission including negligence.
To unsubscribe. Click Here


