Keeping our finger on the pulse of this rampant bull market.
Geopolitical risks may be rising with North Korea now the focus, taking the baton from Syria, but investors should remember that politics create bumps in the road while economics determine the overall direction of markets. Our view is the reaction of global markets to these events illustrates perfectly the current underlying strength of equities with the Australian stocks ignoring the issues and rallying and US stocks continuing to tread water - at one stage last night the Dow was down almost 150-points but it again recovered to close basically unchanged. Three noticeable market movements due to these geopolitical uncertainties are gold, the VIX Index and the safe haven Japanese Yen all hitting multi-month highs. The VIX Index is often referred to as the "Fear Index" and its recent strength shows us investors are not prepared to sell their equities but they are keen to buy some protection just in case mass conflict breaks out.
At MM we continue to believe the market is enjoying the last phase of the major bull market since 2009. An important point for investors to remember today, even while the newspapers continue to try and make you uncomfortable, is the end of a bull market is often the best as euphoria kicks in.....we are still targeting ~8-10% further gains for equities over the next 12-months, with Australia leading the way! Hence while we are happy to sell when stocks give us the opportunity we are buyers of pullbacks until further notice. We believe the stock market remains a train investors should continue to ride for now but as you know we do believe a 25% correction is slowly looming on the horizon - at this stage just make sure you know where your bags are, no need to get them down from the rack just yet.
The local market continued on its merry way yesterday hitting our initial target of 5950 in the late morning and it looks set to test this area again today. The question we ask ourselves now is when / if we should start selling into this strength as we have been planning for the last few months. Today we are going to connect the dots as we see them currently unfolding, to outline our plan over coming weeks, and importantly the reasoning behind it - this is basically the day-day analysis that we perform to evolve our investment plan. We are going to primarily focus on the ASX200 as its clearly enjoying a period of outperformance on the global stage. Firstly let's consider the bigger picture for 2017 /8.
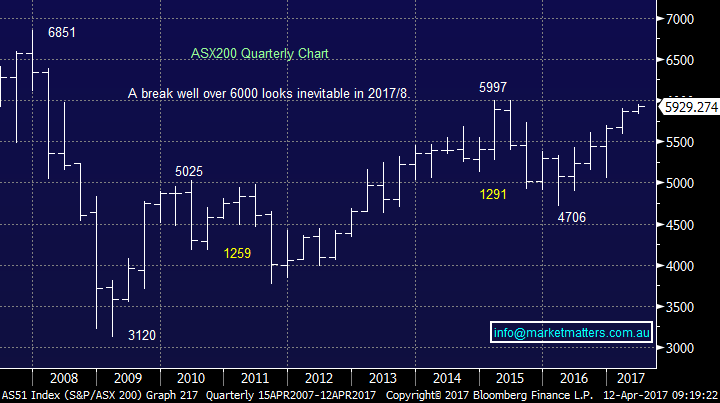
1. We remain bullish the ASX200 targeting a clear break over the psychological 6000 resistance area. An ultimate target of ~6300-6500 would not surprise.
2. Hence while we are comfortable taking profits into strength, increasing our cash position, the MM view is the next ~8% remains up, while a 2% fall would negate this view i.e. good risk / reward to remain core long at this point in time.
3. If the ASX200 breaks over 6000 in coming weeks the likelihood from both a monthly and quarterly range perspective, plus FOMO (fear of missing out) as the market surges towards its 2007 all-time high, is we see a sharp rally towards 6100.
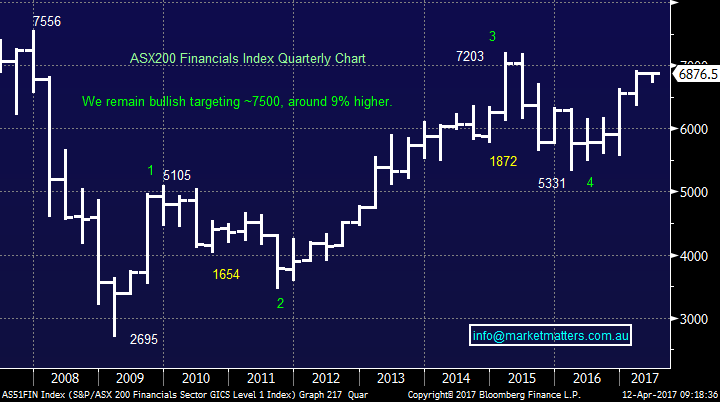
4. Our favourite long-term chart is the ASX200 Financials Index which remains very bullish targeting a ~9% further advance.
Long-term conclusion is to stay core long currently targeting ~8% further upside.
ASX200 Quarterly Chart
The Financials make up over 45% of the ASX200 hence the commonly used phrase "it can't rally without the banks". However the Financial Sector is broader then just the "Big Four" banks including both finance companies insurance stocks. If we are correct and the Financials are going to gain ~9% an ultimate target of +6300 for the ASX200 is easy to comprehend.
ASX200 Financials Index Quarterly Chart
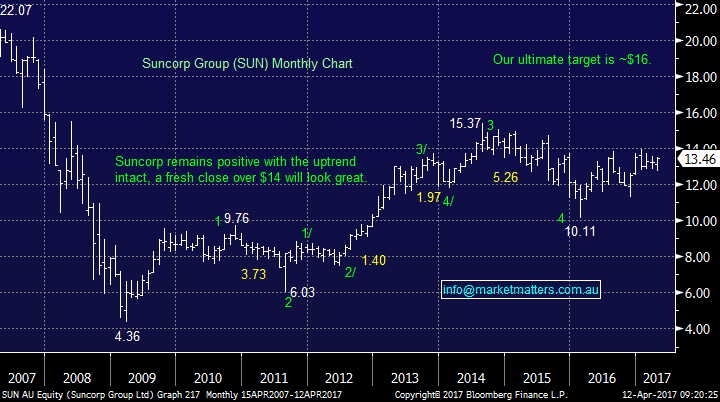
Both our largest and longest holding in the MM portfolio is Suncorp (SUN), not surprisingly from the Financial Sector, where we have a 12% allocation. Our target for SUN is a challenge of the $16 area i.e. a whopping 18% higher! The stock actually looks poised to rally well over $14 resistance in coming months.
Suncorp (SUN) Monthly Chart
When we look at the market in the medium term its position has evolved over recent weeks and it's looking more bullish by the day. The local market will open today less than one percent below its 2015 high and a break over this area is likely to force many fund managers sitting on cash to press the buy button. Our technical take on the market in the medium term is:
1. There looks a better than 50% chance that stocks will surge through the 6000 this month with 6050-6100 the initial target.
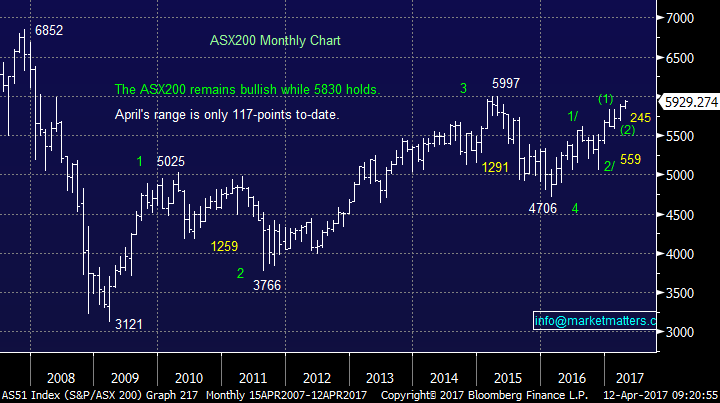
2. While the market can hold over 5830 the next correction is likely to be ~4% but it's hard to envisage this until we have tested well over 6000.
Medium-term conclusion is to remain core long unless the market the market falls under 5830.
ASX200 Monthly Chart
Lastly looking at the market in the short-term the picture is evolving nicely:
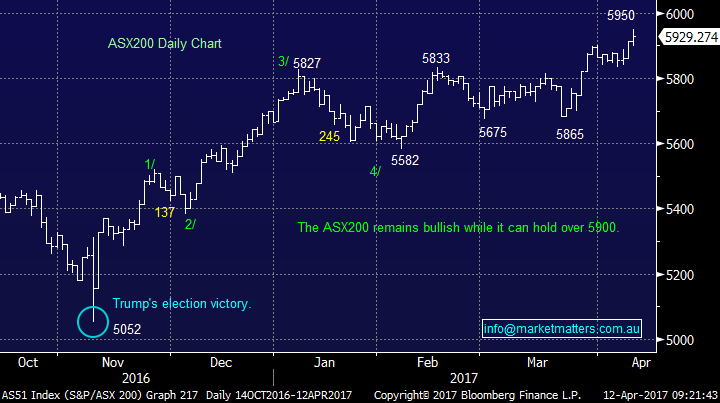
1. The ASX200 is now bullish while it can hold over 5900, around 50-points below where we will open this morning.
2. The market is in the "eye of the storm" of the seasonally strongest month of the year (April) and simple monthly ranges targets 6050-6100 in the next few weeks.
3. May / June is usually a period of weakness for local stocks and potentially could see some simple consolidation if the market does surge towards 6100 this month.
Short-term conclusion is to stay long local stocks while they can hold over 5900. Ideally we will be locking in some profits in a few weeks time when the market is ~3% higher.
ASX200 Daily Chart
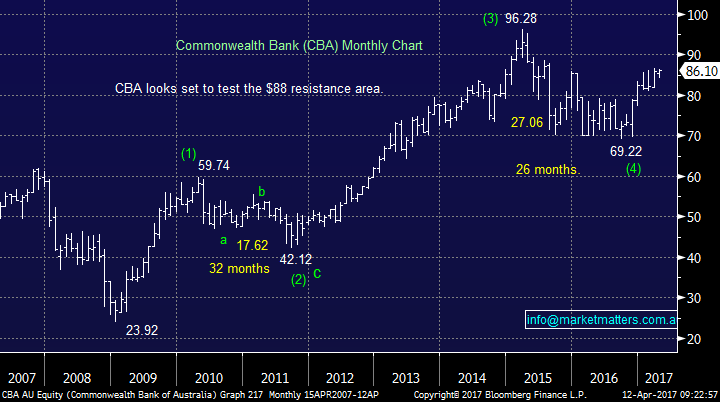
Now looking specifically at CBA, a holding we are considering taking profit on later this month. Firstly let's look at the statistics since the bull market commenced in 2009:
1. CBA has rallied 75% of the time in April with an average gain during these positive periods of $2.10 with best performance within months being up ~$3 at one stage.
2. In the last 3-months CBA has managed to rally close to $5 from its lows, even while the market remained range bound.
3. This month's low to-date is $84.09 which from a simple extrapolation targets $87-$89 this month.
4. May has seen CBA sold hard 62% of the time while gaining 25% of the time and being unchanged 13% of the time. When CBA was sold off it fell hard with an average decline of $4.60.
We remain comfortable taking profit on our CBA ~$88 later this month.
Commonwealth Bank (CBA) Monthly Chart
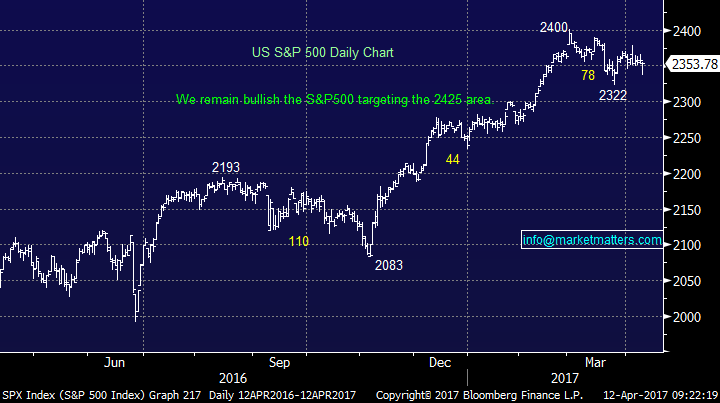
Finally, last night's strong reversal from US stocks in the face of adversity has generated a very bullish signal to us and we continue to target the 2425 area for the S&P500 i.e. 3% higher. Our market has ignored recent negative influences from US stocks but the likelihood, especially considering our bullish outlook, is they will embrace a rally to fresh all-time highs by US equities.
We remain bullish US stocks short-term targeting a further 3% upside from current levels.
US S&P500 Daily Chart
Conclusions
Surprises are normally with the trend which is clearly bullish for the local market at present. Our preferred scenario is the ASX200 enjoys a sharp rally towards 6100 in the next few weeks hence there is no hurry to increase cash levels in general. We are still planning to take profits on our CBA position in the $88 region.
We now remain short-term bullish local equities in April, unless the ASX200 breaks back under the 5900 level.
Overnight Market Matters Wrap
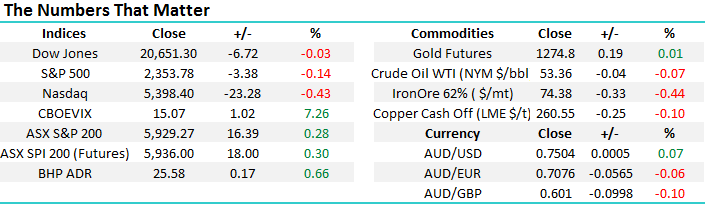
·The SPI is up 18 points as all three US markets pared early losses to close only slightly in the red.
·Investors have turned their attention from economics to geopolitical events in Syria as the US Secretary of State travels to Russia to meet President Putin. North Korea has warned that they will launch a nuclear attack if provoked by US aggression.
·Traditional havens such as gold, the yen and US Treasuries all rallied.
·Metals on the LME mostly finished lower while iron ore continues to drift.
Disclosure
Market Matters may hold stocks mentioned in this report. Subscribers can view a full list of holdings on the website by clicking here. Positions are updated each Friday.
Disclaimer
All figures contained from sources believed to be accurate. Market Matters does not make any representation of warranty as to the accuracy of the figures and disclaims any liability resulting from any inaccuracy. Prices as at 12/04/2017. 8.30AM.
Reports and other documents published on this website and email (‘Reports’) are authored by Market Matters and the reports represent the views of Market Matters. The MarketMatters Report is based on technical analysis of companies, commodities and the market in general. Technical analysis focuses on interpreting charts and other data to determine what the market sentiment about a particular financial product is, or will be. Unlike fundamental analysis, it does not involve a detailed review of the company’s financial position.
The Reports contain general, as opposed to personal, advice. That means they are prepared for multiple distributions without consideration of your investment objectives, financial situation and needs (‘Personal Circumstances’). Accordingly, any advice given is not a recommendation that a particular course of action is suitable for you and the advice is therefore not to be acted on as investment advice. You must assess whether or not any advice is appropriate for your Personal Circumstances before making any investment decisions. You can either make this assessment yourself, or if you require a personal recommendation, you can seek the assistance of a financial advisor. Market Matters or its author(s) accepts no responsibility for any losses or damages resulting from decisions made from or because of information within this publication. Investing and trading in financial products are always risky, so you should do your own research before buying or selling a financial product.
The Reports are published by Market Matters in good faith based on the facts known to it at the time of their preparation and do not purport to contain all relevant information with respect to the financial products to which they relate. Although the Reports are based on information obtained from sources believed to be reliable, Market Matters does not make any representation or warranty that they are accurate, complete or up to date and Market Matters accepts no obligation to correct or update the information or opinions in the Reports.
If you rely on a Report, you do so at your own risk. Any projections are estimates only and may not be realised in the future. Except to the extent that liability under any law cannot be excluded, Market Matters disclaims liability for all loss or damage arising as a result of any opinion, advice, recommendation, representation or information expressly or impliedly published in or in relation to this report notwithstanding any error or omission including negligence.
To unsubscribe. Click Here


