Keeping our finger on the pulse as markets heat up
Overnight the news was dominated by the tragic news of a terror attack in London, our thoughts and prayers are with everybody in the UK, especially the friends and families of those affected by last night's events.
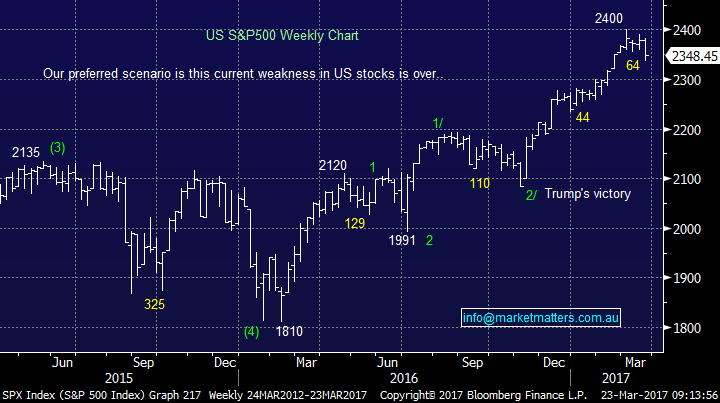
Returning back to the markets which were relatively quiet overnight following the previous night’s plunge with broad S&P500 closing up 0.2%, led by gains in the technology stocks which closed up 0.67%. Putting things in perspective, Tuesday nights tumble by US equities was the first time in 109-days they closed down over 1%, the most bullish run since 1995. Markets are nervous that Donald Trump will fail this week to get the votes in Congress to repeal "Obamacare", the first sign of whether he will be able to implement his stock market positive policies moving forward (such as big tax reform) - a successful vote could see a strong relief rally by stocks. We currently remain bullish US equities short term, a close by the S&P500 above 2360 (0.5% higher) will technically be very bullish for the US stock market targeting fresh all time highs towards the 2450 region (around 4%) higher. In summary our view for US stocks over the next 2-3 months:
1. We think US stocks will rally from current levels, around 4%, through April towards the 2450 region. This strength is likely to remain focused in the NASDAQ / technology stocks.
2. If stocks rally in line with their seasonal strength towards the end of April we then expect a classic "sell in May and go away" leading to a correction of ~5% - a classic pullback over May-June. We are planning to reduce our equity exposure if stocks do rally into late April.
US S&P500 Weekly Chart
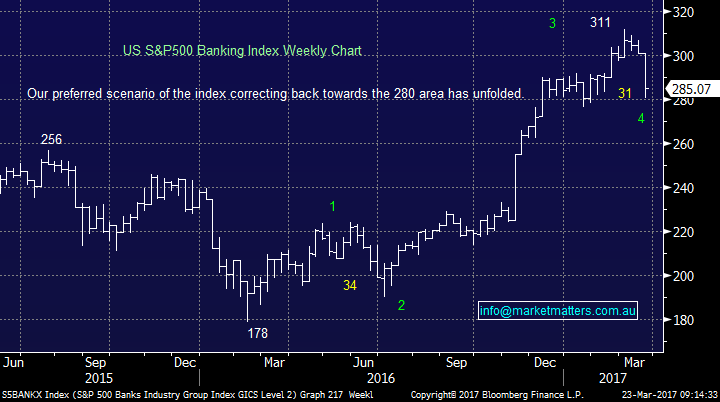
The US Banking Index has bounced, for now, from the 280 level which we targeted in last Weekend’s Report. They have now corrected 10% over the last 4 weeks and while they may nudge a touch lower we are now positive from current levels targeting fresh highs moving forward in 2017 - a good back drop for the Australian Banks, some of whom have appealing dividends looming in May.
US S&P500 Banking Index Weekly Chart
Yesterday the local market woke up from its recent slumber with a big bang, falling a whopping 90-points (1.56%) with only the relatively small gold sector closing in the green. Fortunately we had increased our MM portfolio's cash position to 19% last week by selling some of our $US exposed stocks i.e. Altium (ALU), CSL Ltd (CSL) and Macquarie Bank (MQG). All 3 of these stocks closed below last week's exit levels led by MQG which closed ~2.5% below our ~$88.56 exit price. Yesterday we used the combination of our increased cash levels, investing flexibility, with the significant market weakness to buy 2 stocks we like at current levels:
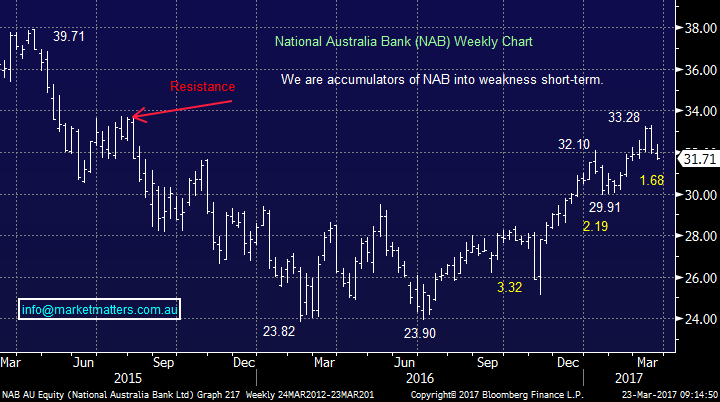
1. National Australia Bank (NAB) $31.71 - We followed our plan outlined in yesterday morning’s report allocating 4% of our portfolio into NAB around $31.70. NAB has now corrected 5% from last week’s high, if weakness continues we plan to buy an additional 2% ~$31 and a further 2% ~$30. NAB is currently yielding 6.24% fully franked with its next dividend not far away in mid-May.
2. Primary Healthcare (PRY) $3.38 - We purchased our favourite stock covered in yesterday's report, beneath $3.40, not an easy entry even on such a weak day for stocks with PRY actually closing up 3c, after trading most of the day well over the $3.40 level. We are comfortable with the 3% allocation into PRY and do not intend to accumulate further at this stage.
At this stage the MM portfolio is now sitting on 12% cash which feels ideal with 7 trading days remaining for March, prior to the seasonally very strong April - remember investors receive their dividends from the likes of CBA, Telstra and Wesfarmers in coming weeks which usually adds strength to the local market.
National Australia Bank (NAB) Weekly Chart
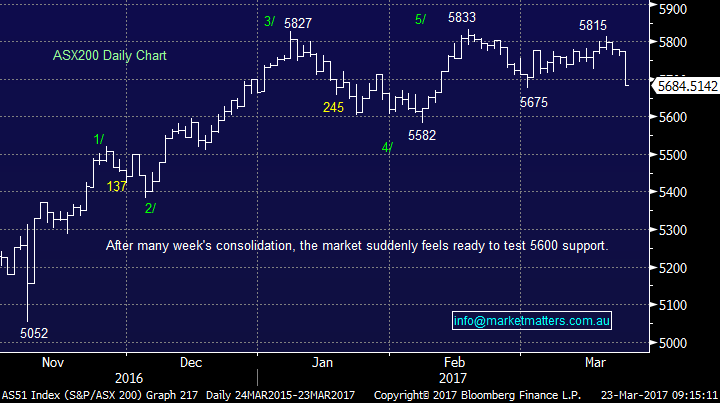
Let’s now take a quick look at the ASX200 overall after yesterday’s plunge as April looms. Firstly some simple statistics:
1. The ASX200 has traded between 5799 and 5681 this week, this 118-point range satisfies the average weekly range in 2017, hence further weakness over the next 2 days would be unusual.
2. The ASX200 has traded between 5815 and 5675 so far in March, this monthly range is very low and averages target a test of 5600, or a break up to 5875, by the month's end. If it is the bullish scenario it would set the market up perfectly for a very strong April.
As we have been mentioning recently Australian stocks are usually seasonally very strong from the first week of April for around 3-4 weeks. Hence for now we see no reason to increase cash levels in any meaningful manner.
ASX200 Daily Chart
Interestingly in Merrill Lynch's latest fund manager poll a staggering 34% believe equity markets are overvalued, the highest percentage over the last 17 years. As subscribers know we believe stocks will suffer a 25% correction commencing in the next year, however the timing still feels too early. If fund managers believe stocks are overvalued it means they have relatively large cash holdings intending to buy weakness, an overall bullish sign. Just like Sydney property, markets rarely fall let alone crash, when the majority of pundits led by the press are calling a major top.
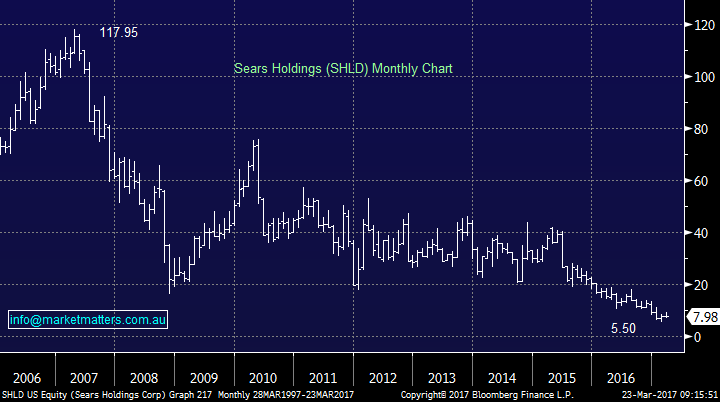
Lastly, combining two phrases we have been discussing during 2017 - "remain open minded" and "there is no reason to be invested in the retail sector". Last night Sears fell another 12% to $US7.98, a stock that was trading well over $US100 into the GFC. The company is actually now seeing "substantial doubt" around its long term future yet this 131-year old department store was once the largest retailer in the US, of course before people had heard of Amazon!
We reiterate, there is no need to be invested in retail until further notice.
US Sears Holdings Monthly Chart
Conclusion
We remain bullish equities over the next 1-2 months.
Overnight Market Matters Wrap
- The US share markets closed marginally mixed, as investors are watching President Trump’s attempt to get a health care vote passed by US lawmakers and the implications this may have for his pro-growth policies.
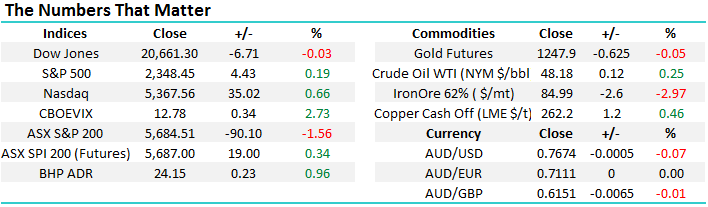
- In the commodities side, oil ended marginally lower, while copper, zinc and gold are all trading higher.
- Iron ore traded 3%lower, and has now retraced over 10% in the past month.
- The June SPI Futures is indicating the ASX 200 to open 19 points higher, slightly above the 5,700 area this morning.
Disclosure
Market Matters may hold stocks mentioned in this report. Subscribers can view a full list of holdings on the website by clicking here. Positions are updated each Friday.
Disclaimer
All figures contained from sources believed to be accurate. Market Matters does not make any representation of warranty as to the accuracy of the figures and disclaims any liability resulting from any inaccuracy. Prices as at 23/03/2017. 9.00AM.
Reports and other documents published on this website and email (‘Reports’) are authored by Market Matters and the reports represent the views of Market Matters. The MarketMatters Report is based on technical analysis of companies, commodities and the market in general. Technical analysis focuses on interpreting charts and other data to determine what the market sentiment about a particular financial product is, or will be. Unlike fundamental analysis, it does not involve a detailed review of the company’s financial position.
The Reports contain general, as opposed to personal, advice. That means they are prepared for multiple distributions without consideration of your investment objectives, financial situation and needs (‘Personal Circumstances’). Accordingly, any advice given is not a recommendation that a particular course of action is suitable for you and the advice is therefore not to be acted on as investment advice. You must assess whether or not any advice is appropriate for your Personal Circumstances before making any investment decisions. You can either make this assessment yourself, or if you require a personal recommendation, you can seek the assistance of a financial advisor. Market Matters or its author(s) accepts no responsibility for any losses or damages resulting from decisions made from or because of information within this publication. Investing and trading in financial products are always risky, so you should do your own research before buying or selling a financial product.
The Reports are published by Market Matters in good faith based on the facts known to it at the time of their preparation and do not purport to contain all relevant information with respect to the financial products to which they relate. Although the Reports are based on information obtained from sources believed to be reliable, Market Matters does not make any representation or warranty that they are accurate, complete or up to date and Market Matters accepts no obligation to correct or update the information or opinions in the Reports.
If you rely on a Report, you do so at your own risk. Any projections are estimates only and may not be realised in the future. Except to the extent that liability under any law cannot be excluded, Market Matters disclaims liability for all loss or damage arising as a result of any opinion, advice, recommendation, representation or information expressly or impliedly published in or in relation to this report notwithstanding any error or omission including negligence.
To unsubscribe. Click Here


