Is there a potentially “free” dividend on offer from CBA?
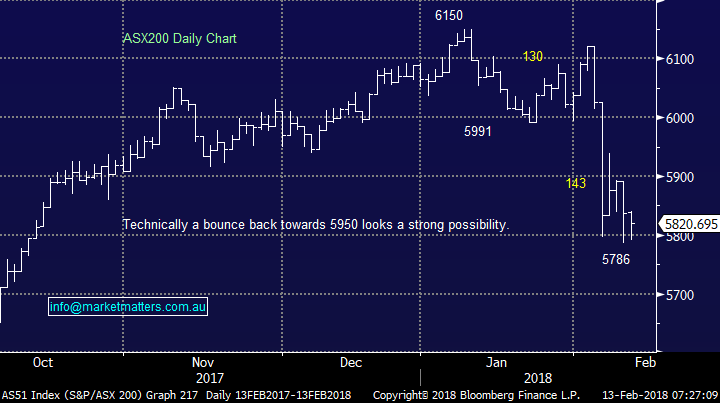
As I start typing this report the Dow is up over 500-points while the SPI futures are implying the ASX200 will open up around 25-points. At this point in time US stocks have recovered almost 50% of the month's losses while locally we are languishing within striking distance of this month’s 5786 low. However, the decline we experienced last week was not as extreme as the fall experienced globally. Following the recent volatility I can understand investors’ concern in chasing this rebound, but we are set to open 100-points below last Wednesday's high whereas the Dow is much closer to this equivalent level. There are a 3 reasons we are currently not panicking about the relatively weak position of our market:
- While global equity markets were healthy into January's high the ASX200 was a noticeable underperformer, just like it feels presently.
- Without blowing smoke where we shouldn’t, it seems to me that MM was one of very few mkt participants in January who was calling the ASX200 lower in 2018 yet suddenly the press is full of pundits calling the market lower moving forward – the crowd is usually wrong.
- Global markets have followed our path so far in 2018 – albeit more aggressively than we thought - hence we are staying with our short-term view that many of these markets will again make fresh all-time highs to complete the 9-year bull market advance since the GFC.
Perhaps the warning signal for stocks will come when the ASX200 enjoys a few days of outperformance, similar to 2-weeks ago.
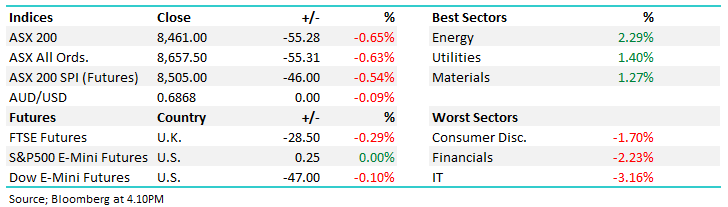
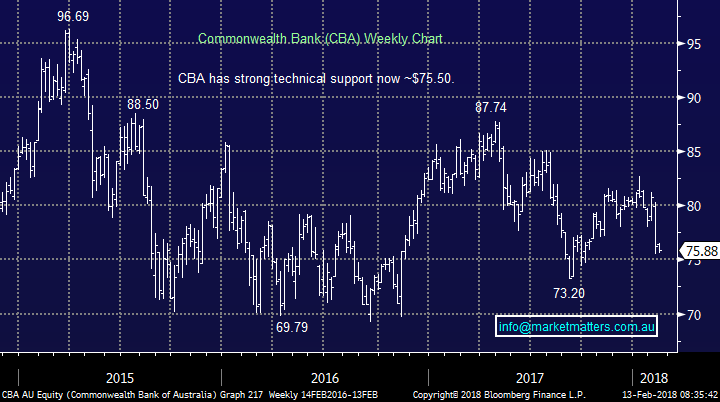
The Banking Sector weighed on our market yesterday, retreating -0.85%, the standout negative contributor to the ASX200. CBA trades ex-dividend $2 fully franked tomorrow and today we will evaluate whether an opportunity exists to buy the stock looking for a “free” dividend into April / May in the midst of some banking weakness.
Local Index
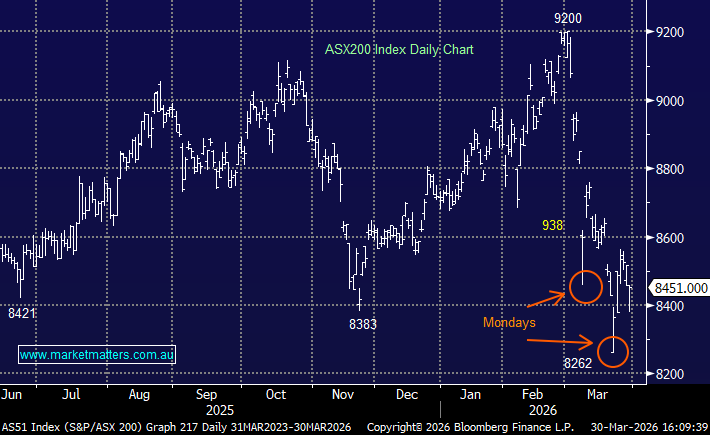
Yesterday’s rally by the ASX200 ran out of steam in the late afternoon as it appeared traders became wary of the looming session in the US. In the short-term a test of 5950 is our first objective i.e. ~2.2% higher. For us to become bullish technically the ASX200 we need to see a close back above 6000.
ASX200 Daily Chart
Poaching CBA’s dividend
CBA goes ex-dividend tomorrow, paying an attractive $2 fully franked. Buying CBA today and holding for just over 1-year will receive 3 dividends providing a likely attractive 8.4% fully franked income (12% grossed for franked). However we are looking at the stock more from the angle of a potentially quick ~2-month free dividend.
- The question is can we buy CBA today around $76 and sell it ~April at around the same price / higher.
Seasonally CBA, like the ASX200, usually performs well from now into April adding weight to the plan. What would have been the outcome of the last 8-years since the GFC:
- With some careful exits on a couple of occasions this strategy has worked every year since the GFC!
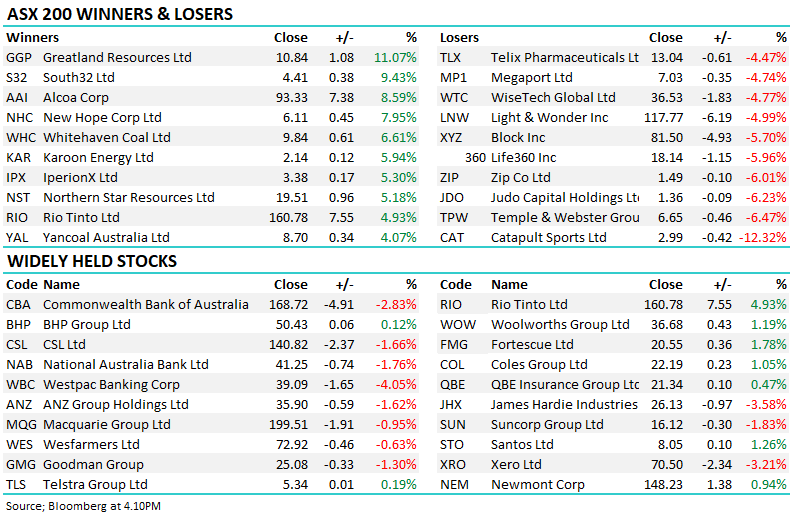
The recent weakness in CBA adds weight to our thoughts i.e. -4.9% over the last 5-days and -6.2% over the last month – not helped by the new banking enquiry. Importantly it should be remembered that while stocks have enjoyed a bull market since early 2009, CBA is over $20 below its 2015 high so clearly it has not been all smooth sailing.
We like the idea of buying CBA at current levels for a “potential free dividend over” the coming few months, however across our own portfolios we already hold enough of the ‘Big Australian’!
Commonwealth Bank (CBA) Weekly Chart
Commonwealth Bank (CBA) Seasonal Chart
Conclusion
No major change, at this stage on the macro / index level, MM remains keen to accumulate resource stocks into current weakness albeit cautiously due to reduced cash levels.
We like CBA at current levels for a potential “free dividend”.
Global markets
US Indices
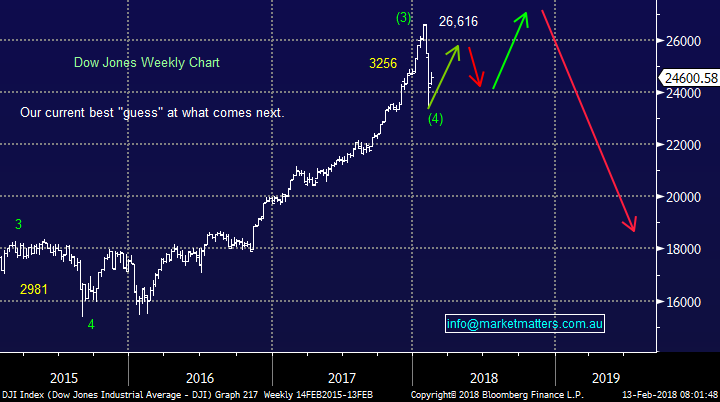
No change from yesterday, overall US stocks are now in the area where we can see a low forming and our opinion is they will be higher in say 1-2 months’ time.
- While we expect US stocks to rally to fresh highs the likely manner of the advance is far more choppy / indecisive than the almost exponential gains we witnessed from late 2016.
Similar to both 2010 and 2014 we believe that US stocks have given the market a relatively friendly warning over recent days – a nudge around what could be on the horizon. At this point in time I expect investors to slowly forget the recent volatility and refocus on all the bullish fundamental reasons to be in stocks ideally pushing global markets back up to fresh all-time highs before buying the next dip will become very dangerous. Our prevailing view from here is:
- Global markets are likely to regain their bullish euphoric mood through February / March and push prices back to all-time highs.
- Following later in 2018/9 will be a ~20% correction back to the lows of 2016 i.e. hence our recent buying is relatively short-term in nature.
US Dow Jones Weekly Chart
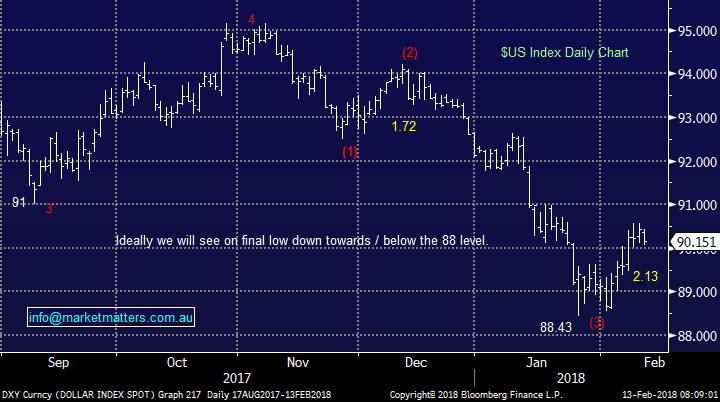
The $US
As we have been focusing on over recent months MM continues to believe the $US, along with the highly discussed interest rates is the key to stocks is 2018/9 e.g. Last night the $US Index slipped 0.35% and the Dow rallied over 400-points. Our short-term view at this point in time remains intact:
- If our short-term view is correct the $US should turn lower from around current levels to challenge the 88 area one last time, ideally before a 8-10% rally minimum.
- We expect US stocks to make, or at least challenge, the all-time highs posted in January.
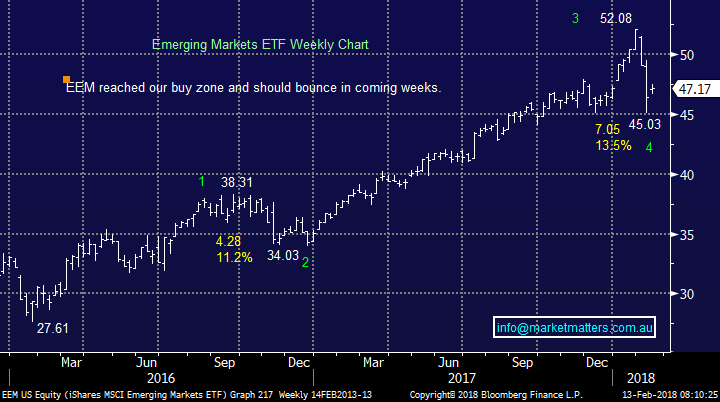
- The Emerging markets are one of the clearest indices at present and if they can consolidate between 47 and 50 our view will be looking good i.e. up then down hard.
$US Index Daily Chart
Emerging Markets (EEM) Weekly Chart
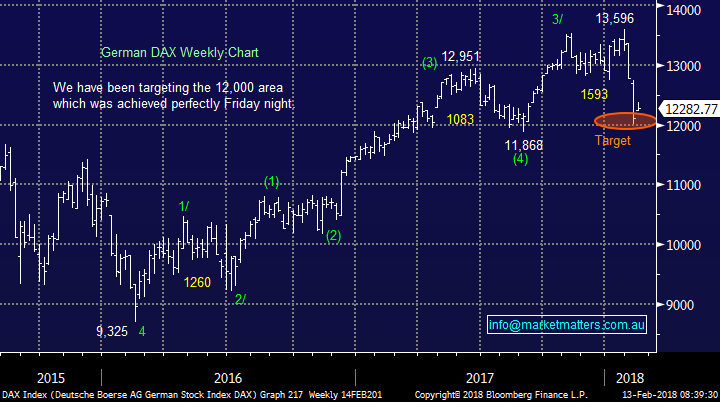
European Stocks
European stocks made fresh recent lows this week - a rally back over 13,000 by the German DAX will look great for fresh all-time highs in 2018.
German DAX Weekly Chart
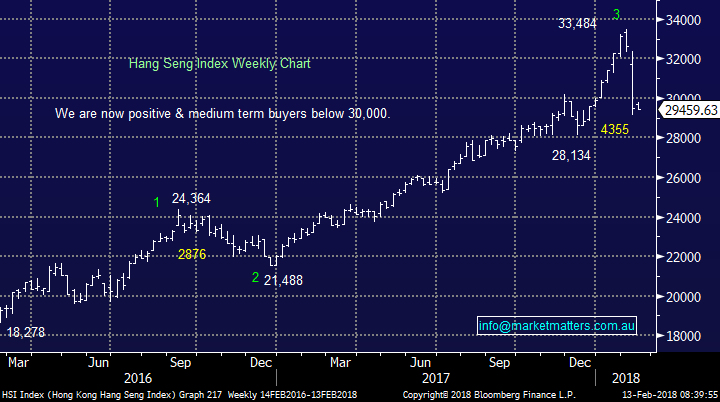
Moving onto our close neighbours in Asia, the Hang Seng is now in our buy zone below the 30,000 area.
Hang Seng Weekly Chart
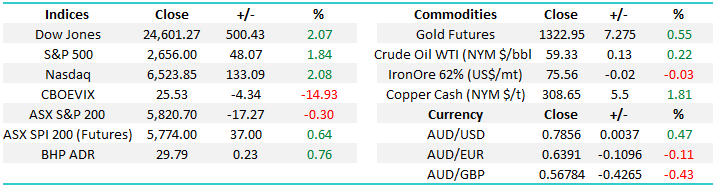
Overnight Market Matters Wrap
· The US equity markets continued its attempt to claw back some of last week’s savage losses, with the Dow ending its session up 1.7% and the broader S&P 500 up 1.39%.
· The volatility (VIX) Index settled at lower levels (-12% at around 25), while the bond market recovered from an intra-day new 4 year high level of 2.9%, to close around 2.86% ahead of the US CPI number on Wednesday.
· Commodities were mixed. Oil rallied early but closed little changed on the day, with benchmark Brent price around US$62.75/bbl., gold jumped 0.8% to US$1325/oz., while copper rebounded 1.8% to US$3.09/lb. The iron ore price marginally weaker at US$75.56/t as demand winds down ahead of the upcoming Chinese New Year.
· The March SPI Futures indicating the ASX 200 to open 12 points higher, testing the 5835 level this morning.
Disclosure
Market Matters may hold stocks mentioned in this report. Subscribers can view a full list of holdings on the website by clicking here. Positions are updated each Friday, or after the session when positions are traded.
Disclaimer
All figures contained from sources believed to be accurate. Market Matters does not make any representation of warranty as to the accuracy of the figures and disclaims any liability resulting from any inaccuracy. Prices as at 13/2/2018. 8.00 AM.
Reports and other documents published on this website and email (‘Reports’) are authored by Market Matters and the reports represent the views of Market Matters. The MarketMatters Report is based on technical analysis of companies, commodities and the market in general. Technical analysis focuses on interpreting charts and other data to determine what the market sentiment about a particular financial product is, or will be. Unlike fundamental analysis, it does not involve a detailed review of the company’s financial position.
The Reports contain general, as opposed to personal, advice. That means they are prepared for multiple distributions without consideration of your investment objectives, financial situation and needs (‘Personal Circumstances’). Accordingly, any advice given is not a recommendation that a particular course of action is suitable for you and the advice is therefore not to be acted on as investment advice. You must assess whether or not any advice is appropriate for your Personal Circumstances before making any investment decisions. You can either make this assessment yourself, or if you require a personal recommendation, you can seek the assistance of a financial advisor. Market Matters or its author(s) accepts no responsibility for any losses or damages resulting from decisions made from or because of information within this publication. Investing and trading in financial products are always risky, so you should do your own research before buying or selling a financial product.
The Reports are published by Market Matters in good faith based on the facts known to it at the time of their preparation and do not purport to contain all relevant information with respect to the financial products to which they relate. Although the Reports are based on information obtained from sources believed to be reliable, Market Matters does not make any representation or warranty that they are accurate, complete or up to date and Market Matters accepts no obligation to correct or update the information or opinions in the Reports.
If you rely on a Report, you do so at your own risk. Any projections are estimates only and may not be realised in the future. Except to the extent that liability under any law cannot be excluded, Market Matters disclaims liability for all loss or damage arising as a result of any opinion, advice, recommendation, representation or information expressly or impliedly published in or in relation to this report notwithstanding any error or omission including negligence.
To unsubscribe. Click Here