Is the Trump Reflation Trade Taking US Stocks Higher?
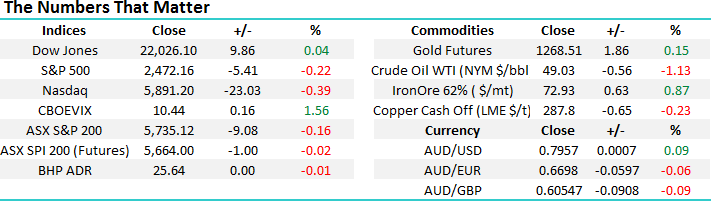
The ASX200 delivered another choppy day finally closing -0.16% lower as the disappointing results of Suncorp (-6.4%)and RIO (-2.5%) weighed on the index. Unfortunately, we own both of these stocks in our MM Growth Portfolio, while todays fall certainly ate into our paper profits we remain comfortable with both stocks medium-term. Otherwise there was no standout during the day except the aggressive selling in very early trade followed by a slow grind higher throughout the day, something we’ve witnessed many times since mid-May. We hope to cover both stocks, plus the possible fall-out from the CBA money laundering debacle in a new ‘Direct From The Desk’ – video insight today – keep an eye out!
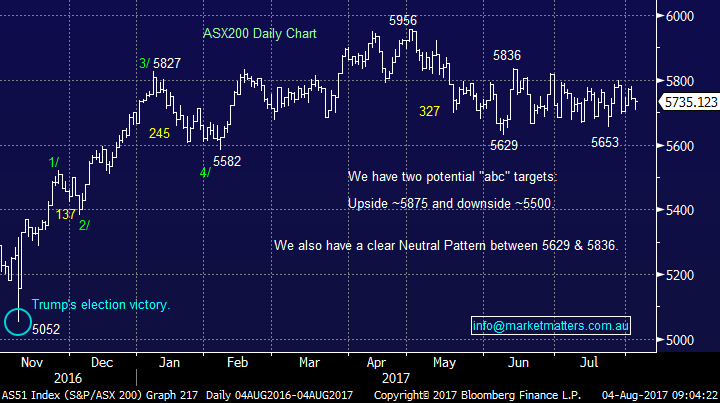
We continue to feel the market will pull back towards the 5500-area in the seasonally weak August / September period but it currently feels like we may need a negative lead from overseas markets to set this correction in motion. Hence today we are taking a close look at the internals of the US market look for any clues that the reflation trade, which has been labelled the reason for the surge in US stocks, is running out of steam i.e. The US S&P500 has rallied 19.3% since Donald Trump’s election victory last November with optimism that he would add significant stimulus to the US economy a definite contributor.
ASX200 Daily Chart
US Stocks
Last night was again mixed for US stocks with the Dow closing up 10-points, over 22000, but the tech NASDAQ was 0.4% lower with APPLE shares drifting lower following their surge in the previous session.
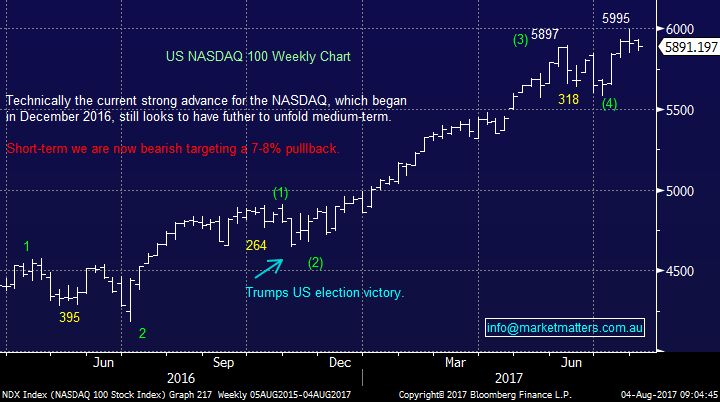
There is no change to our current view that we believe a very strong possibility exists for +5% correction by US stocks in the short-term.
US NASDAQ Index Weekly Chart
The Trump reflation trade
Last November Donald Trump shocked the world by winning the US election initially sending stocks plummeting before investors thought about his underlying policies. In Australia as the results from the voting crossed the newswires the ASX200 initially plunged almost 4% before bouncing in late trade and then ultimately rallying an impressive 17.9% into May’s high. Similarly, the US S&P500 has rallied close to 20% after his win, making fresh all-time highs this week, with only one noticeable 3.25% correction in March. Donald would have been chuffed with himself no doubt!
The rally was named the “Trump reflation trade” and is based on the theory that Trump’s policies will lift US inflation and growth hence hurting bonds as interest rates inevitably rise. We are currently targeting a ~5% correction in US stocks but for this to prove accurate perhaps we need the market to lose faith in “Trumponomics” although they certainly have ignored many “interesting” events since his victory.
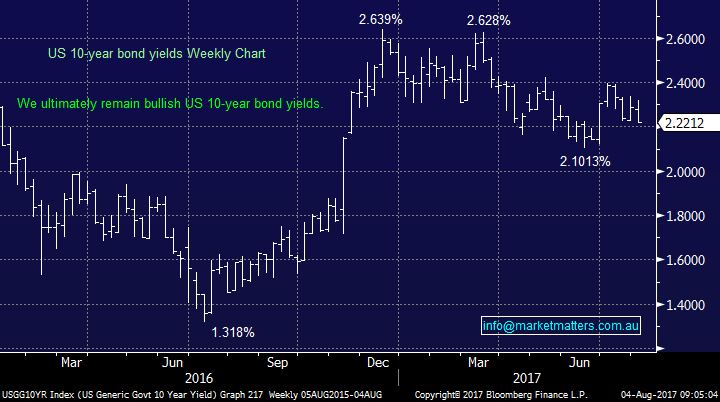
However, when we look at US interest rates they topped out in mid-December and have been basically drifting lower ever since implying optimism around Trump’s polices has been declining for over 6-months. Yet over the same period that US interest rates (bond markets) lost confidence in the reflation trade the S&P500 advance another 10%.
US 10-year bond yields Weekly Chart
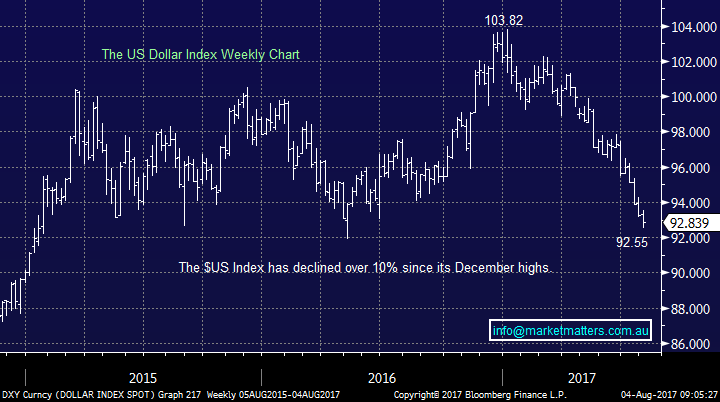
Similarly, the $US has declined over 10% since its December highs. Both the huge FX and bond markets which are often called more intelligent than the stock market have shown no faith in Donald Trump’s ability to stimulate the US economy and yet US stocks continue to rally. The Trump reflation trade sounds about as real as the Loch Ness monster from an economics perspective.
$US Index Weekly Chart
Now time to delve into the individual sectors of the S&P500 in an attempt to understand the US stock markets last ~6-months impressive strength. Firstly, there are only a few things that catch the eye when we look at the 10-sectors in a time frame when the S&P500 advanced 8.6%:
1. Only the energy sector declined over this bullish period, by -8.81%.
2. The best performing sector amongst the winners was not surprisingly the tech stocks which gained +14.4%, while the worst was the consumer staples +4.86%.
3. Seven of the 10 sectors gained between 5 and 10% illustrating healthy broad-based gains.
However, when we look at the previous 5 trading days the story is slightly different with the market basically unchanged and only the energy, financials and utilities in the green i.e. 70% of sectors are down. Unfortunately, no great insights but the NASDAQ tech stocks led us up so they will probably lead us lower.
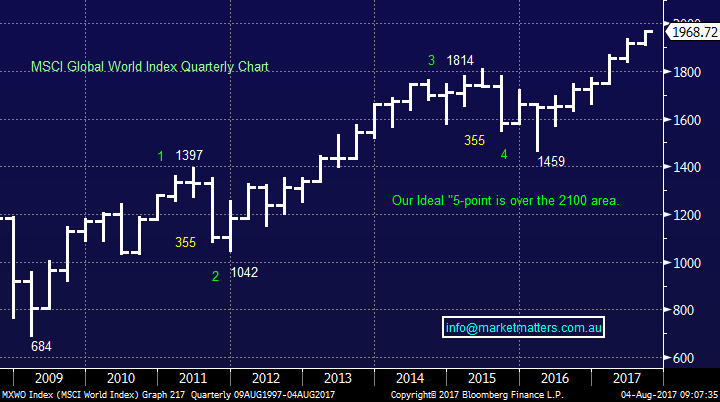
When we look at stocks on a global basis even with European stocks down ~6% since May the MSCI Global Index is on its all-time high. Three very important points from the World Index, which we have been following very closely since early 2016:
1. Our long-term target of ~2100 is now only around 6% away.
2. Short-term a 5% correction looks close at hand.
3. Since Trumps election victory the global world index has advanced 18.9%.
Although the global world index is made up of over 50% US stocks we should remember it does not include any emerging markets which have significantly outperformed US stocks recently. Our conclusion is that global equities have been very strong, not just the US because of Mr Trump. Another example of why we are not big believers in the “Trump reflation trade”.
Our view at MM, which we regularly quoted earlier in the year, is global equities have rallied strongly because fund managers were simply too negative and underweight stocks - when no tsunami hit the global economy to let them buy at lower levels, they’ve had to chase. Arguably we’ve been in a sweet spot for stocks of record low interest rates and steady growth, plus China more often than not surprising on the upside in recent times.
MSCI Global World Index Quarterly Chart
Conclusion (s)
We are not actually believers in the “Trump reflation trade”, in fact we believe optimism around his policies pushing equities higher was probably over by Christmas.
Our view is global equities have pushed higher in 2017 because fund managers were far too bearish / underweight at the start of the year and no bad news has hit the global economy with China in fact supporting rather than dragging as many forecasted.
We continue to see a high chance for a pullback in the US stock market in the short term
Overnight Market Matters Wrap
· US stocks were mixed overnight as concerns continued to weigh on sentiment over the extent of the Trump administration's Russian ties during last year's election.
· While the Dow held above yesterday's record close of over 22,000, both the broader S&P 500 and Nasdaq closed easier as the Trump-Russian probe looks set to drag on.
· The UK market on the other hand rallied strongly but sterling weakened further after the Bank of England kept rates on hold after it slightly lowered growth forecasts for this year to 1.7%.
· Commodities were mixed with iron ore rebounding from yesterday's weakness but oil and base metals generally weaker. BHP closed a little weaker and RIO a little stronger in US trading while the A$ slipped back to us79.40. The futures market is pointing to a flattish open for the local market.
· The June SPI Futures is indicating the ASX 200 to open 11 points lower towards the 5725 level this morning.
Disclosure
Market Matters may hold stocks mentioned in this report. Subscribers can view a full list of holdings on the website by clicking here. Positions are updated each Friday.
Disclaimer
All figures contained from sources believed to be accurate. Market Matters does not make any representation of warranty as to the accuracy of the figures and disclaims any liability resulting from any inaccuracy. Prices as at 04/08/2017. 8.00AM.
Reports and other documents published on this website and email (‘Reports’) are authored by Market Matters and the reports represent the views of Market Matters. The MarketMatters Report is based on technical analysis of companies, commodities and the market in general. Technical analysis focuses on interpreting charts and other data to determine what the market sentiment about a particular financial product is, or will be. Unlike fundamental analysis, it does not involve a detailed review of the company’s financial position.
The Reports contain general, as opposed to personal, advice. That means they are prepared for multiple distributions without consideration of your investment objectives, financial situation and needs (‘Personal Circumstances’). Accordingly, any advice given is not a recommendation that a particular course of action is suitable for you and the advice is therefore not to be acted on as investment advice. You must assess whether or not any advice is appropriate for your Personal Circumstances before making any investment decisions. You can either make this assessment yourself, or if you require a personal recommendation, you can seek the assistance of a financial advisor. Market Matters or its author(s) accepts no responsibility for any losses or damages resulting from decisions made from or because of information within this publication. Investing and trading in financial products are always risky, so you should do your own research before buying or selling a financial product.
The Reports are published by Market Matters in good faith based on the facts known to it at the time of their preparation and do not purport to contain all relevant information with respect to the financial products to which they relate. Although the Reports are based on information obtained from sources believed to be reliable, Market Matters does not make any representation or warranty that they are accurate, complete or up to date and Market Matters accepts no obligation to correct or update the information or opinions in the Reports.
If you rely on a Report, you do so at your own risk. Any projections are estimates only and may not be realised in the future. Except to the extent that liability under any law cannot be excluded, Market Matters disclaims liability for all loss or damage arising as a result of any opinion, advice, recommendation, representation or information expressly or impliedly published in or in relation to this report notwithstanding any error or omission including negligence.
To unsubscribe. Click Here


