Is the May / June Correction Over?
Wow, we were way too tentative in yesterday’s Morning Report when we said:
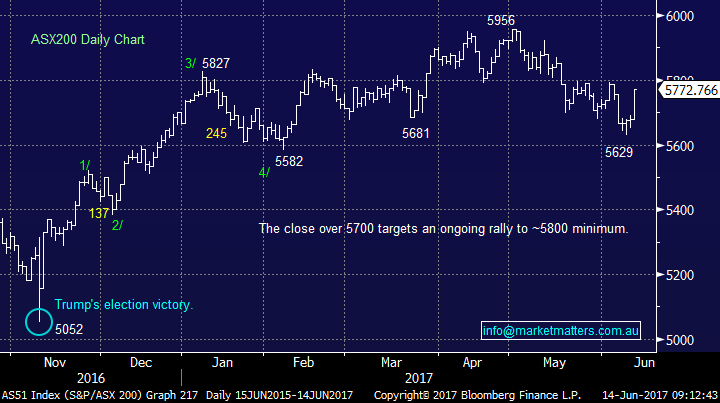
“If the ASX200 can break over 5700 we believe it should target 5800 minimum fairly quickly.”
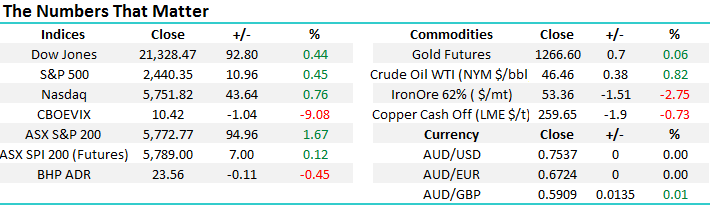
Literally a few hours after rallying through 5700 yesterday morning, the ASX200 closed up 94-points / 1.67% to enjoy its best day in 7-months, managing to close only 0.5% below 5800. The questions we now ask ourselves - is the seasonal correction over and are we off for another assault on the big psychological 6000 area?
Remember the 3 statistics we have been quoting recently:
1. The average correction for the ASX200 since the GFC is 6.9%, this year we have corrected only 5.5% to-date.
2. The ASX200’s range for June to-date is 5629 to 5793 i.e. 164-points. If the market which closed at 5772 today can break to fresh monthly highs, statistically the likelihood is we will test 5850 this month.
3. The average pullback for CBA over May/June since the GFC is just over 10% but this year we already have seen an 11.4% correction.
On balance, we believe the seasonal pullback is complete and the market is well positioned with July, the seasonally second strongest month of the year, only a few weeks away – we will maintain this positive stance while the ASX200 holds over 5690.
Overall, we are comfortable with our 10% cash holding as historically opportunities often present themselves as we approach the end of a financial year.
ASX200 Daily Chart
US Stocks
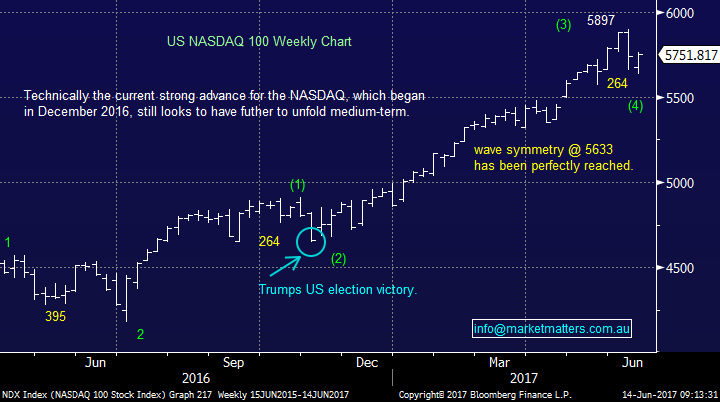
US stocks closed higher across the board last night, with the Dow both making and closing at all-time highs. At this point in time we are also net bullish the recently volatile NASDAQ with a target around the 6000 area i.e. 4% higher. However, after the recent 264-point / 4.5% correction we would anticipate price action similar to that between October and December 2016 i.e. a choppy ascent.
No change to our important line in the sand, unless the S&P500 closes below 2400 / 1.6% lower there are no sell signals.
US NASDAQ-100 Weekly Chart
Today we will look at arguably the 2 most influential market sectors within the ASX200, which include the ASX200’s 5 biggest companies which alone make up almost 30% of the market, before we even add the balance of the respective sectors. Clearly if these 2 sectors are aligned, it gives a solid indication for the overall direction of the broader ASX200.
The Financials
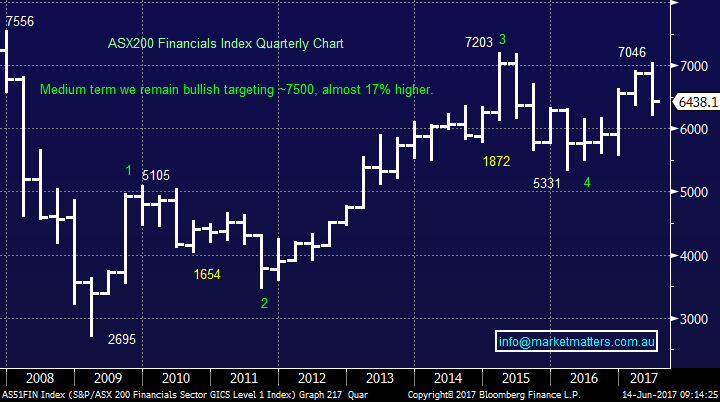
The local financials index has endured a pretty average May – June correcting 12.2% at its worst last week. However, over 2017/8 we remain bullish targeting a test of the pre-GFC highs for the sector, around 17% higher.
From a technical perspective if we do get the rally to the ~7500 region for the ASX200 Financial Index this will be an ideal time to significantly reduce our market / financials exposure.
ASX200 Financials Index Quarterly Chart
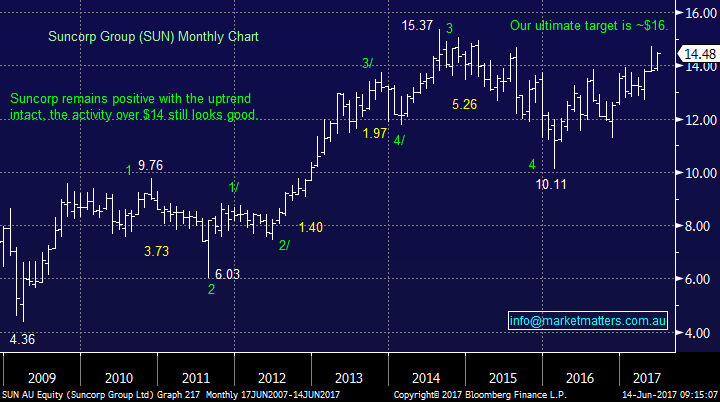
Suncorp (SUN) has been one of our favourite stocks since we established our largest market position back in 2015. We remain bullish, targeting the $16 area i.e. over 10% higher. In line with our comments on the overall financial sector, we do intend to realise profits when / if SUN reaches our target area.
Suncorp (SUN) Monthly Chart
The Resources
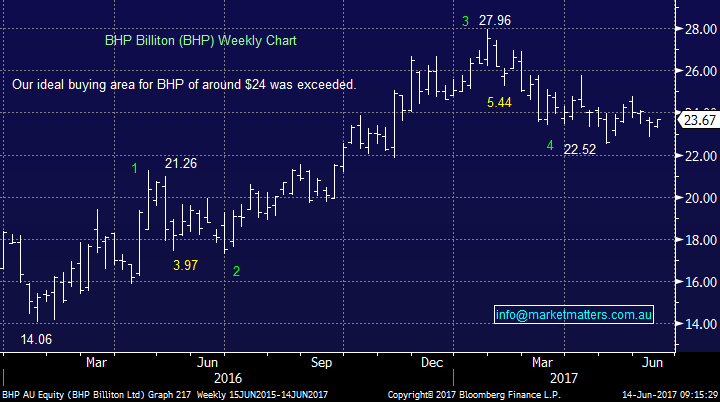
Not surprisingly following the large corrections in the many commodity markets, the leading Australian resource stocks have had a tough 2017 to-date e.g. iron ore has corrected -43.8%, crude oil -20.8% and copper -12.4%. However, we remain optimistic that the local resource stocks will eventually come back into favour and break their highs of early 2017 i.e. around +20% higher for BHP.
BHP Billiton (BHP) Weekly Chart
Conclusion(s)
We remain bullish the ASX200 over coming months still targeting a decent break over 6000 in 2017/8.
Overnight Market Matters Wrap
· A rebound in the US equities markets were realised overnight, ahead of the 2-day US Fed meeting tonight where there is a 97.8% consensus of a rate hike.
· Gold rose little, while oil resumed its game of snakes and ladders, rising 0.82% higher overnight.
· The Volatility (VIX) index remains in ultra-low level complacency, with risk remaining in a bullish stance.
· BHP is expected to continue its positive run after its US performance, adding 1.25% from Australia’s previous close.
· The June SPI Futures is indicating the ASX 200 to open 15 points higher, testing the 5790 level this morning.
Disclosure
Market Matters may hold stocks mentioned in this report. Subscribers can view a full list of holdings on the website by clicking here. Positions are updated each Friday.
Disclaimer
All figures contained from sources believed to be accurate. Market Matters does not make any representation of warranty as to the accuracy of the figures and disclaims any liability resulting from any inaccuracy. Prices as at 14/06/2017. 8.00AM.
Reports and other documents published on this website and email (‘Reports’) are authored by Market Matters and the reports represent the views of Market Matters. The MarketMatters Report is based on technical analysis of companies, commodities and the market in general. Technical analysis focuses on interpreting charts and other data to determine what the market sentiment about a particular financial product is, or will be. Unlike fundamental analysis, it does not involve a detailed review of the company’s financial position.
The Reports contain general, as opposed to personal, advice. That means they are prepared for multiple distributions without consideration of your investment objectives, financial situation and needs (‘Personal Circumstances’). Accordingly, any advice given is not a recommendation that a particular course of action is suitable for you and the advice is therefore not to be acted on as investment advice. You must assess whether or not any advice is appropriate for your Personal Circumstances before making any investment decisions. You can either make this assessment yourself, or if you require a personal recommendation, you can seek the assistance of a financial advisor. Market Matters or its author(s) accepts no responsibility for any losses or damages resulting from decisions made from or because of information within this publication. Investing and trading in financial products are always risky, so you should do your own research before buying or selling a financial product.
The Reports are published by Market Matters in good faith based on the facts known to it at the time of their preparation and do not purport to contain all relevant information with respect to the financial products to which they relate. Although the Reports are based on information obtained from sources believed to be reliable, Market Matters does not make any representation or warranty that they are accurate, complete or up to date and Market Matters accepts no obligation to correct or update the information or opinions in the Reports.
If you rely on a Report, you do so at your own risk. Any projections are estimates only and may not be realised in the future. Except to the extent that liability under any law cannot be excluded, Market Matters disclaims liability for all loss or damage arising as a result of any opinion, advice, recommendation, representation or information expressly or impliedly published in or in relation to this report notwithstanding any error or omission including negligence.
To unsubscribe. Click Here


