How important are dividends?
Following the previous 2-days weakness the local share market consolidated yesterday as we expected, actually managing a healthy bounce of 40-points / 0.7%. Just over half of these gains were attributable to the banking sector despite receiving more negative news near the close yesterday - hence it will be very interesting to see the price action of the banks today. South Australia has now levied a “state tax” on our banks to help fund infrastructure spend. This is a dangerous theme with government balance sheets stretched and some sectors in Australia being viewed as ‘too profitable’ – simply an easy way to fill a hole left by government mismanagement – all too common in our country unfortunately.
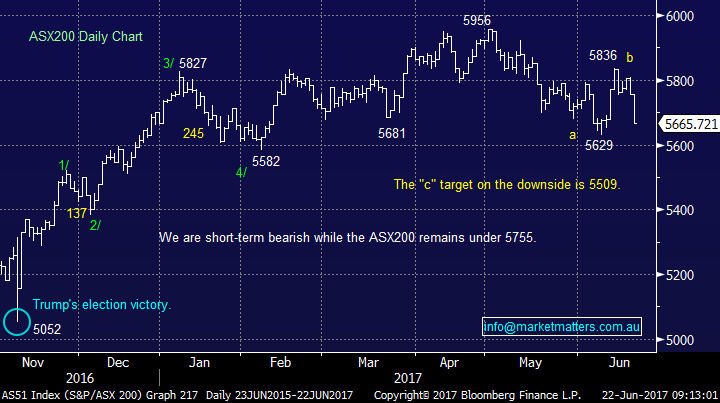
Overall a few more days rest would not surprise but unless the ASX200 can rally back over 5755 we will maintain our negative short-term bias. There only remains 6-trading days in the seasonally weak May-June period and it certainly has lived up to its reputation. Now, will July as the strongest month of the year live up to its? So far, we have corrected only 5.5%, still short of the average 6.9% since the GFC which targets 5545.
The MM portfolio remains in 15% cash, following our realised profit in JHG, and we intend to put some / all of this money to work around the 5550-area, if the opportunity arises, ideally at the end of June / start of July.
ASX200 Daily Chart
US Stocks
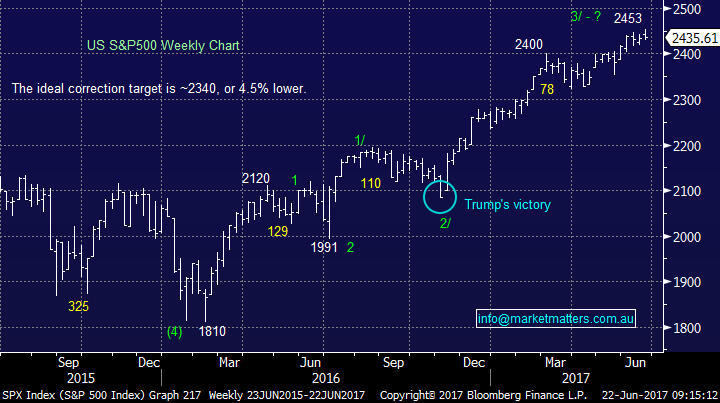
Last night US equities were again marginally lower with the major indices all closing in the red. Although no sell signals have yet been generated over recent weeks our “gut feel” is the most likely direction for US stocks moving forward is now down, with our preferred scenario a 4-5% correction.
Cash levels are simply too high and fund managers too cautious in our view for the market to have a meaningful rout even though we have not seen a drop of more than 10% since 2015.
US S&P500 Weekly Chart
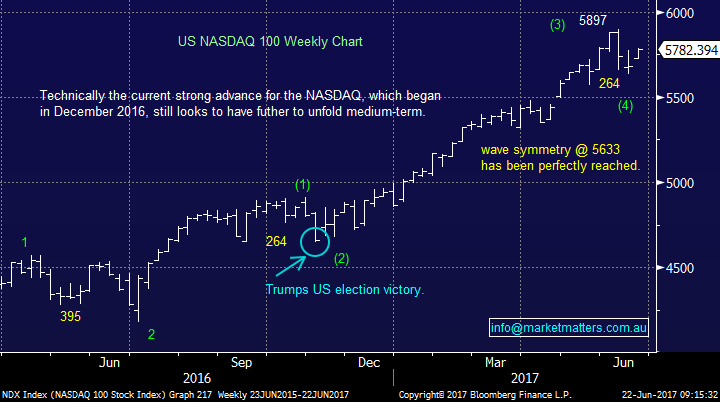
The NASDAQ continues to enjoy a period of increased volatility, we remain 50-50 what path the market follows short-term but either way we still target another test of the 5600 area, or 3% lower.
US NASDAQ Weekly Chart
European Stocks
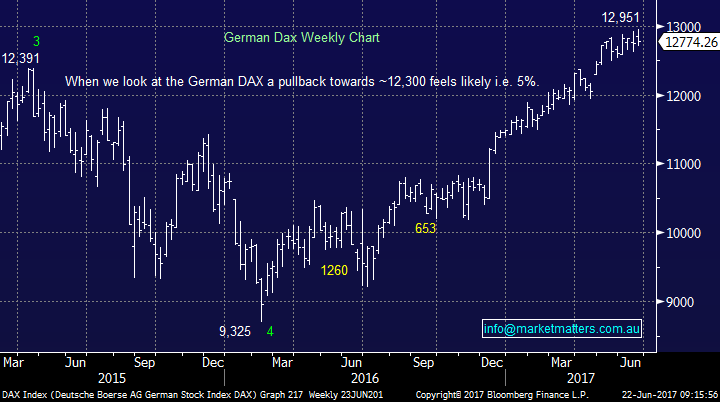
No change, when we look closely at the German DAX the picture is very similar to that of US stocks. We are targeting a pullback of ~5% towards the 12,300 area before a resumption of its strong bull market.
German DAX Weekly Chart
July is a bumper month for dividends with almost $10bn hitting investors bank accounts in the first 7-days of next month – ANZ, MQG, NAB and WBC make up almost 90% of this windfall. This cash injection / wealth effect is obviously a significant contributor to the bullish trends we typically see play out in July.
Seasonality – 8 years post the GFC
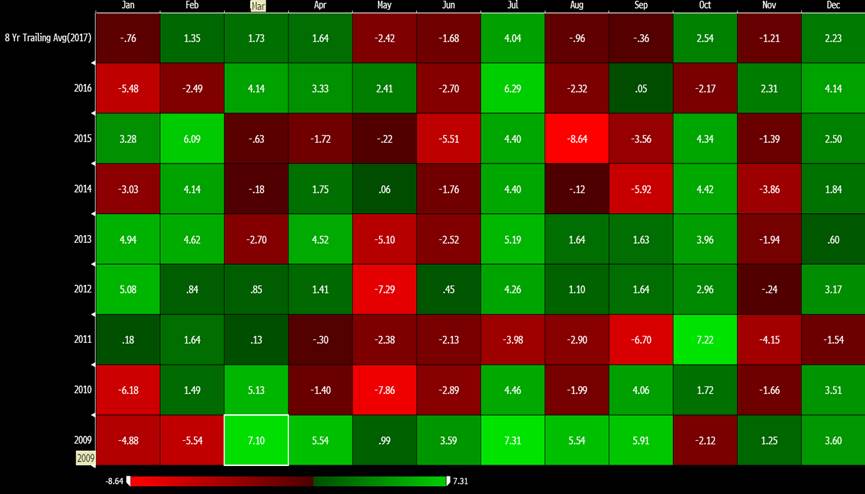
With July, a big dividend month we thought today was an opportune time to look at the effect dividends have on the Australian share market. The answer is a lot!
Since the GFC the ASX200 has rallied 83% basis yesterdays close, remaining 20% below its all-time high of November 2007. Conversely the ASX200 Accumulation Index has advanced 170% since the GFC and currently sits almost 30% above its high of 2007.
ASX200 Accumulation Index Monthly Chart
Hence buying Australian stocks that pay a good fully franked yield has been a good investment strategy for local investors assuming they are solid companies which also generate some capital appreciation. As most of us know there have been some awful “yield traps” over recent years with 2 household names at the forefront of this wealth destruction e.g. Telstra (TLS) and Myer (MYR).
One of our main objectives at MM is buying quality companies who pay excellent fully franked dividends, at optimum levels. When we look at relatively stable CBA it has experienced 28%, 29% and 61% falls in the last 9-years alone illustrating perfectly that careful entry levels can have a huge impact on an investors long-term returns – we sold CBA well over $90 and have been buying under $80 hence adding value to the MM portfolio.
Around 50% of the MM portfolio fits these yield criteria which makes perfect long-term sense – our largest holding Suncorp (SUN) is probably the best example as it yields close to 5% fully franked and has given us a nice paper profit since late 2015. I cover Suncorp (SUN) on Live Wire this morning for those that are interested!

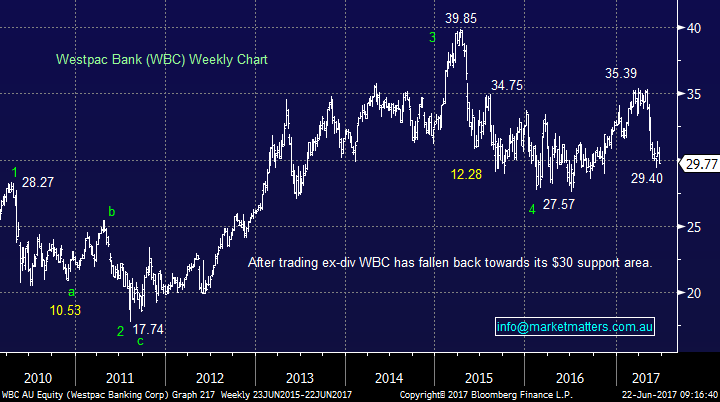
Also, we continue to look at WBC with a view to increasing our position by 2.5% to 7.5% - the stock now pays a 6.23% fully franked dividend (8.9% grossed up). Conversely, we are likely to sell our TLS moving forward as we see the risks of capital depreciation in the years ahead.
Westpac (WBC) Daily Chart
Conclusion(s)
We remain mildly negative equities in the short-term looking for a 4-5% correction by US / European stocks. On balance, we believe this will lead to a test below 5550 by the ASX200 for a buying opportunity:
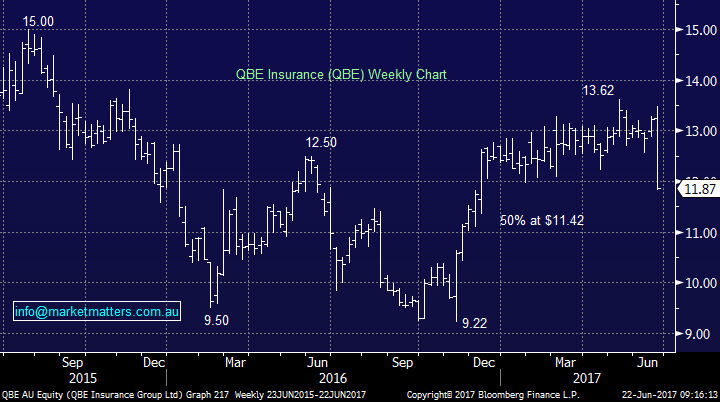
1. We are buyers of QBE under $11.50 but sellers over $12.50.
2. We are buyers of WBC under $29.40, or above $30.50.
3. We are buyers of RIO under $55.
We are still watching TLS very carefully as we look for an optimum exit level.
Overnight Market Matters Wrap
· The US major indices ended with little change overnight, giving back early gains in late trading as a stronger healthcare sector were offset by slight weakness in financials. Euro markets likewise traded sideways as the U.K. Negotiations with the European Union resumed on its exit plans.
· Further details of replacement plans for "Obamacare" helped the healthcare related stocks while the bank shares eased ahead of a further update on the Federal Reserve's stress testing measures, which came out after market and gave the sector the tick of approval.
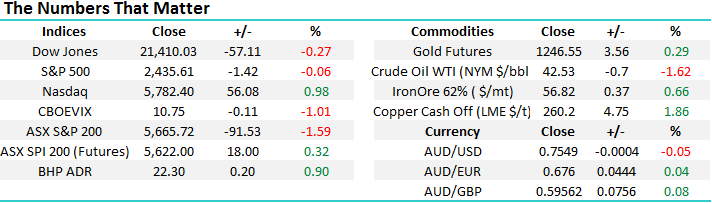
· Oil recovered slightly from its recent sell off with the global benchmark Brent up 1% to $45.3 while commodities were mixed with iron ore slightly easier at $56.5 /t and gold slightly ahead at $1248/oz. Both Rio and BHP firmed around 1% in overnight trading. The A$ was a little easier at 75.3c.
· The ASX 200 is expected to follow the US and open with little change, towards the 5710 area this morning as indicated by the September SPI Futures.
Disclosure
Market Matters may hold stocks mentioned in this report. Subscribers can view a full list of holdings on the website by clicking here. Positions are updated each Friday.
Disclaimer
All figures contained from sources believed to be accurate. Market Matters does not make any representation of warranty as to the accuracy of the figures and disclaims any liability resulting from any inaccuracy. Prices as at 23/06/2017. 8.00AM.
Reports and other documents published on this website and email (‘Reports’) are authored by Market Matters and the reports represent the views of Market Matters. The MarketMatters Report is based on technical analysis of companies, commodities and the market in general. Technical analysis focuses on interpreting charts and other data to determine what the market sentiment about a particular financial product is, or will be. Unlike fundamental analysis, it does not involve a detailed review of the company’s financial position.
The Reports contain general, as opposed to personal, advice. That means they are prepared for multiple distributions without consideration of your investment objectives, financial situation and needs (‘Personal Circumstances’). Accordingly, any advice given is not a recommendation that a particular course of action is suitable for you and the advice is therefore not to be acted on as investment advice. You must assess whether or not any advice is appropriate for your Personal Circumstances before making any investment decisions. You can either make this assessment yourself, or if you require a personal recommendation, you can seek the assistance of a financial advisor. Market Matters or its author(s) accepts no responsibility for any losses or damages resulting from decisions made from or because of information within this publication. Investing and trading in financial products are always risky, so you should do your own research before buying or selling a financial product.
The Reports are published by Market Matters in good faith based on the facts known to it at the time of their preparation and do not purport to contain all relevant information with respect to the financial products to which they relate. Although the Reports are based on information obtained from sources believed to be reliable, Market Matters does not make any representation or warranty that they are accurate, complete or up to date and Market Matters accepts no obligation to correct or update the information or opinions in the Reports.
If you rely on a Report, you do so at your own risk. Any projections are estimates only and may not be realised in the future. Except to the extent that liability under any law cannot be excluded, Market Matters disclaims liability for all loss or damage arising as a result of any opinion, advice, recommendation, representation or information expressly or impliedly published in or in relation to this report notwithstanding any error or omission including negligence.
To unsubscribe. Click Here


