Fund manager K2 follows Platinum and slashes fees
Yesterday we saw another volatile day on the local bourse with stocks surging 46-points by 11am only for the market to slowly fall throughout the day and be actually in the red by 4pm. There was no particular stand out area (s) of strength or weakness, the selling felt generally across the whole market.
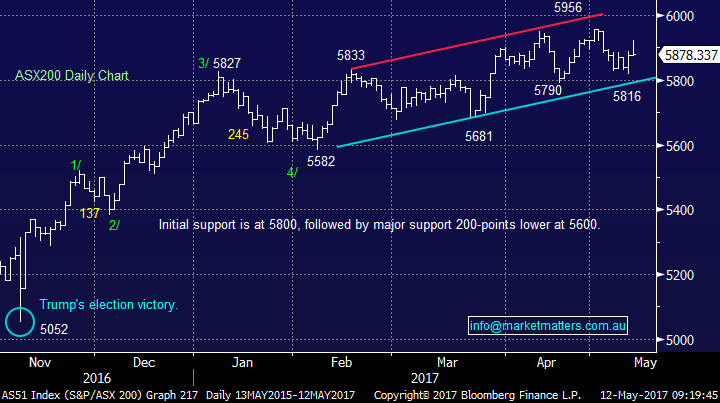
The high of 5956 on the 1st of May was in sight at 11am yesterday but only a few hours later we found ourselves back again closer to the monthly low of 5816. If we assume 5956 remains the high for May, even if this month becomes the equal lowest range for almost 3-years statistically we should still break under 5800 over the next few weeks. Another point of caution for the bulls for the next 4-6 weeks is since the GFC June is often weaker than May and notably so in the last 2-years.
MM’s short-term negative view for the ASX200 remains intact with our initial target of ~5800 now basically satisfied, while our potential targets of 5700 / 5600 for a May-June retracement will look very attainable technically if we close under 5816.
ASX200 Daily Chart
Overseas markets were again very quiet last night, although the VIX has popped back over 10%, we continue to feel US stock markets are feeling “tired” which is no great surprise after their excellent rally over the last 5-months. Our view at current levels remains unchanged:
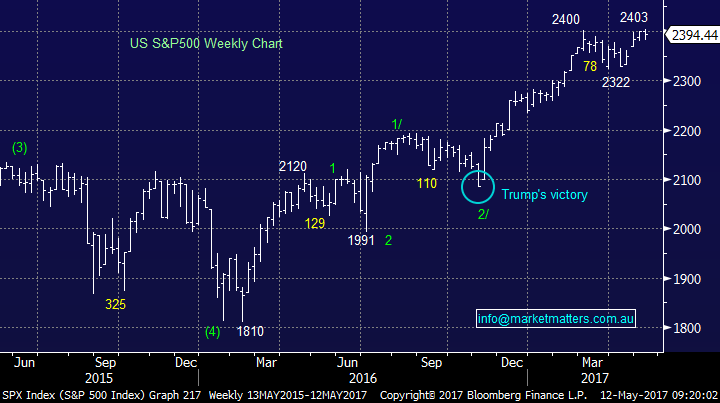
a. The US S&P500 remains around all-time highs but it may now struggle to reach our previous 2425 target area after making a fresh all-time high at 2403 and then reversing lower.
b. We sense a ~5% correction is very close at hand, it still feels like we are entering a classic "sell in May and go away" scenario for US stocks.
c. Assuming we get a 5% correction over May / June, similar to last year, we will be keen buyers into this weakness targeting further gains later in 2017. The NASDAQ is likely to be our yardstick for a buy area with US stocks and we will be simply looking for a correction of ~265-points, similar to that of October / November 2016.
Importantly we now feel the short-term risks for US stocks are on the downside.
d. Longer-term we still see a further ~6% upside for the broad US Russell 3000 index but ultimately our conviction belief remains that the 2016 lows will ultimately be tested, a correction of at least 25%!
Hence it’s important to understand moving forward MM will become comfortable with increasingly higher cash levels.
US S&P500 Weekly Chart
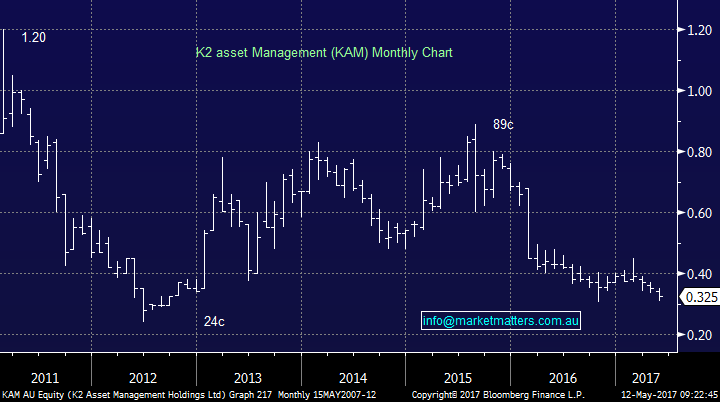
Yesterday boutique fund manager K2 Asset Management (KAM) followed Platinum (PTM) by announcing the significant reduction in its fee structure in an attempt to appease investors and attract some improved positive fund flow – the fund size has almost halved from $1bn back in 2010. Our comment from when PTM cut its fees applies to KAM, improve performance and funds will come back! We feel that cutting fees may buy these companies some time but only results will turn them around.
With the booming ETF market potentially in its infancy fund managers need to “add value” or they will slowly fall into the sea, it certainly feels like we are seeing the start of a trend for fund managers of lower management fees. It should always be remembered that the larger the fund the harder it often becomes to add value, particularly BIG funds operating in the Australian market.
We have no interest in KAM at this moment in time.
K2 Asset Management (KAM) Monthly Chart
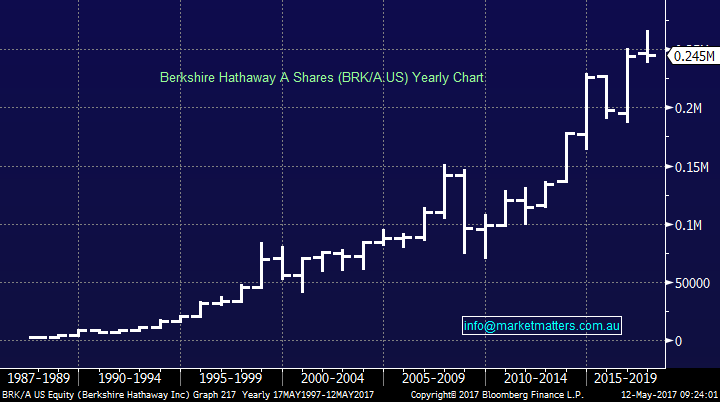
So we have seen two of the sectors big underperformers reduce their fees but what we are now turning our attention to is if / when the better quality stocks will eventually be forced to follow suit. One thing for sure is that mediocrity will no longer be tolerated in this sector. We have all heard of Warren Buffett and his company Berkshire Hathaway, one of the greatest business success stories in history. Perhaps some of our fund managers should eat some of Mr Buffett’s humble pie and especially take a leaf from his book when it comes to business / company overheads. There is no Berkshire Hathaway yacht in the Sydney to Hobart!!
Interestingly we think Berkshire is a sell technically targeting ~15% lower prices, this ties in with our longer-term view on US stocks.
Berkshire Hathaway Class A Yearly Chart
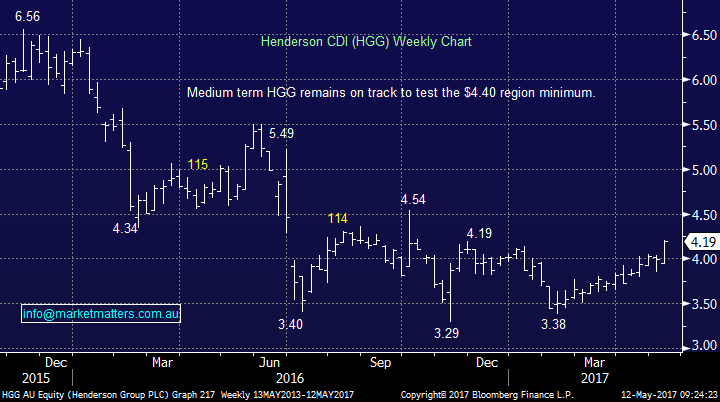
Our only real concern within the sector today is our 8% portfolio in Henderson Group (HGG) which is currently showing a paper profit of 9.7% + dividends.
We have liked this holding for three main reasons:
- It’s was very cheap compared to its market piers & the market was very negative on the Janus deal
- Its Europe facing which as our preferred positioning at this point in time.
- It can reduce costs quickly and cross sell existing products into a wider distribution network
Basically, we see real rather than perceived synergies in this ‘joining of forces’
ETF’s have clearly changed the investment landscape placing a lot of emphasis on performance of active managers. It’s quite simple, if you charge more, that fee needs to be justified in terms of performance. If you don’t beat the fund charging 0.20% pa, how can you justify charging 1.2%? The answer we feel is by offering something different – unique that can’t be replicated by an index tracker.
We like HGG, we have don’t for a while now however the investment becomes lower conviction the higher it trades. We intend to sell ~$4.40 and potentially sooner for all / part of our holding.
Henderson Group (HGG) Weekly Chart
Conclusion (s)
We are concerned as to the short-term positioning of the funds management area of the market and are monitoring our HGG position very carefully.
Overnight Market Matters Wrap
· The US markets closed slightly off record highs with healthcare stocks helping offset the weaker retailers. All eyes on the April retail sales data due out tonight to see if there is broad weakness in spending.
· A close to the downside was seen in the US equity markets overnight as weaker than expected quarterly sales numbers from one of the US biggest department stores, Macy's, sparked a 17% sell off in the stock to a 5 year low amid fears that US consumer spending was starting to stall.
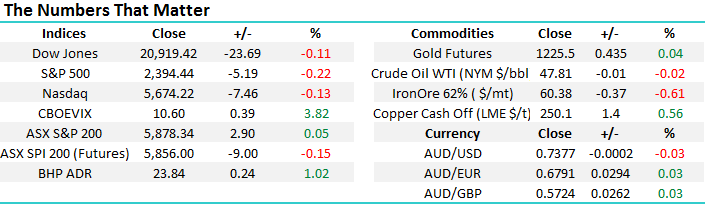
· Oil prices continued their recovery rising 1% along with a 0.5% rally in the gold price while other commodities were mixed with copper and aluminium stronger, but iron ore slightly weaker hovering around US$60 a tonne.
· The June SPI Futures is indicating the ASX 200 to open marginally lower, towards the 5,875 level this morning.
Disclosure
Market Matters may hold stocks mentioned in this report. Subscribers can view a full list of holdings on the website by clicking here. Positions are updated each Friday.
Disclaimer
All figures contained from sources believed to be accurate. Market Matters does not make any representation of warranty as to the accuracy of the figures and disclaims any liability resulting from any inaccuracy. Prices as at 12/05/2017. 8.00AM.
Reports and other documents published on this website and email (‘Reports’) are authored by Market Matters and the reports represent the views of Market Matters. The MarketMatters Report is based on technical analysis of companies, commodities and the market in general. Technical analysis focuses on interpreting charts and other data to determine what the market sentiment about a particular financial product is, or will be. Unlike fundamental analysis, it does not involve a detailed review of the company’s financial position.
The Reports contain general, as opposed to personal, advice. That means they are prepared for multiple distributions without consideration of your investment objectives, financial situation and needs (‘Personal Circumstances’). Accordingly, any advice given is not a recommendation that a particular course of action is suitable for you and the advice is therefore not to be acted on as investment advice. You must assess whether or not any advice is appropriate for your Personal Circumstances before making any investment decisions. You can either make this assessment yourself, or if you require a personal recommendation, you can seek the assistance of a financial advisor. Market Matters or its author(s) accepts no responsibility for any losses or damages resulting from decisions made from or because of information within this publication. Investing and trading in financial products are always risky, so you should do your own research before buying or selling a financial product.
The Reports are published by Market Matters in good faith based on the facts known to it at the time of their preparation and do not purport to contain all relevant information with respect to the financial products to which they relate. Although the Reports are based on information obtained from sources believed to be reliable, Market Matters does not make any representation or warranty that they are accurate, complete or up to date and Market Matters accepts no obligation to correct or update the information or opinions in the Reports.
If you rely on a Report, you do so at your own risk. Any projections are estimates only and may not be realised in the future. Except to the extent that liability under any law cannot be excluded, Market Matters disclaims liability for all loss or damage arising as a result of any opinion, advice, recommendation, representation or information expressly or impliedly published in or in relation to this report notwithstanding any error or omission including negligence.
To unsubscribe. Click Here


