Four very different places to hide if we have a May / June correction
Yesterday the ASX200 gave a warning signal to the bulls falling 37-points in the morning with the banks leading the decline following ANZ's disappointing report. While the market did recover the majority of its decline in the afternoon we believe the ASX200 is "looking for a top" although a test of the nearby psychological 6000 area still remains a strong possibility. We believe ANZ has hammered a number of nails into the banking sectors coffin for at least the short-term. It now feels an enormous ask for NAB and / or Westpac to report so strongly over the coming days that the banks can significantly add to their 6.8% gains during 2017 - our preferred scenario remains a 5-6% correction for the banks during May / June.
We have increased our cash position to almost 30% over recent weeks including taking a nice profit on our CBA holding, hence although we are on balance bearish the market during May / June MM is now wearing its "buyers hat" looking to put this increased cash position to work into any decent market / stock specific weakness that may unfold.
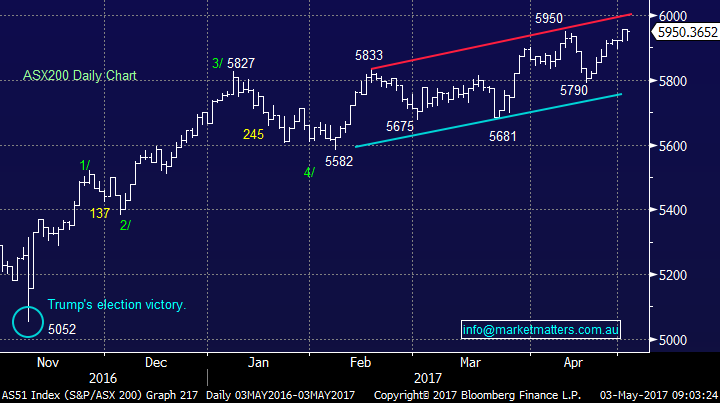
If we are correct and the US market is positioned to gain an additional ~1.5% over the next few days then the ASX200 is likely to remain firm short-term and probably test the 6000 level but one day soon the afternoon rally which local stocks have regularly enjoyed in 2017 will not materialise and this is likely to be an ideal trigger to sell for the short term traders out there.
ASX200 Daily Chart
This morning US stocks have closed marginally higher as they await the Fed's decision on US interest rates - the APPLE report has disappointed with the stock trading down close to 2% in the afterhours market which is likely to test the resolve of the NASDAQ tonight. Overall US equities remain extremely close to our initial upside target and the risk / reward continues to not favour general buying:
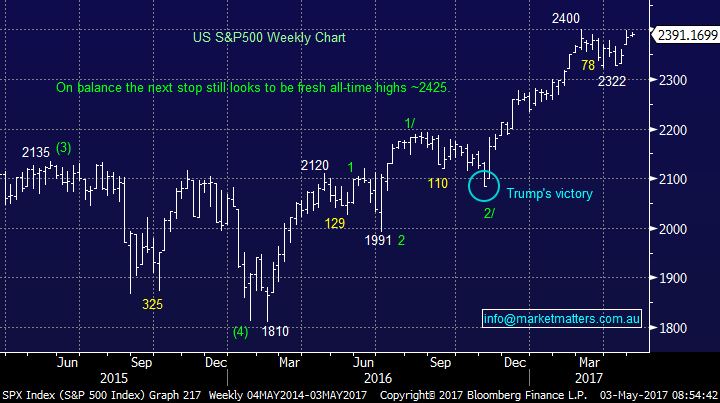
1. The US S&P500 still looks poised to rally another ~1.5% over next few days / weeks.
2. A 5% correction is still looming rapidly on the horizon, it still feels like we are heading towards a classic "sell in May and go away" scenario.
3. Assuming we get a 5% correction over May / June, similar to last year, we will be keen buyers into this weakness targeting further gains later in 2017. The NASDAQ is likely to be our yardstick for a buy area with US stocks and we will be simply looking for a correction of ~265-points, similar to that of October / November 2016.
US S&P500 Weekly Chart
Today we are going to suggest 4 stocks that we feel may be relatively well insulated if we see a ~5% correction in the market during May / June. Obviously cash is another simple option and we remain comfortable with our large ~30% holding at present, even if we are wrong and stocks do maintain their rally over May / June our view is the missed opportunity will be limited considering that the market has already rallied over 17% since November, and is certainly not cheap at current prices.
1. Suncorp (SUN) $14.13
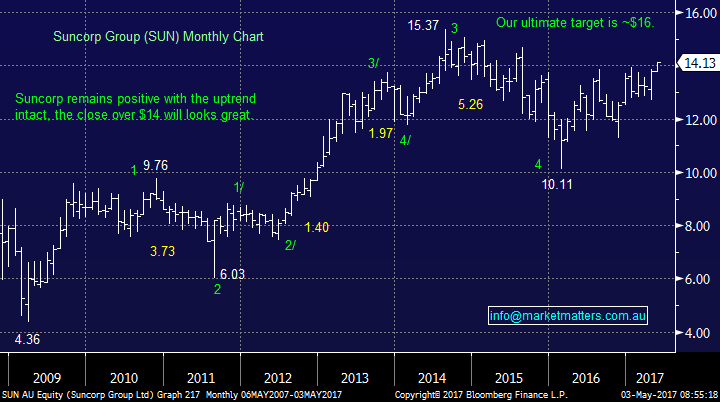
Suncorp is our largest position in the MM portfolio and hence not surprisingly our favourite stock at this point in time. Yesterday as the banking sector fell 0.74% SUN rallied a solid 0.86% making fresh highs since August 2015. There looks to be a clear trend evolving out of banks into SUN that may have much further to unfold. We remain bullish SUN targeting a likely test towards the $16 area i.e. well over 10% higher, hence even if SUN does succumb to some seasonal selling pressure we remain comfortable long term holders and will continue to enjoy its 5% fully franked yield plus the chance of a special dividend later in the year! We’re comfortable with our 12% position, which is clearly a large holding.
For the traders we would be considering buying Suncorp and selling ANZ for the next 1-2 months, a relative strength play not a view on the index itself.
Suncorp (SUN) Monthly Chart
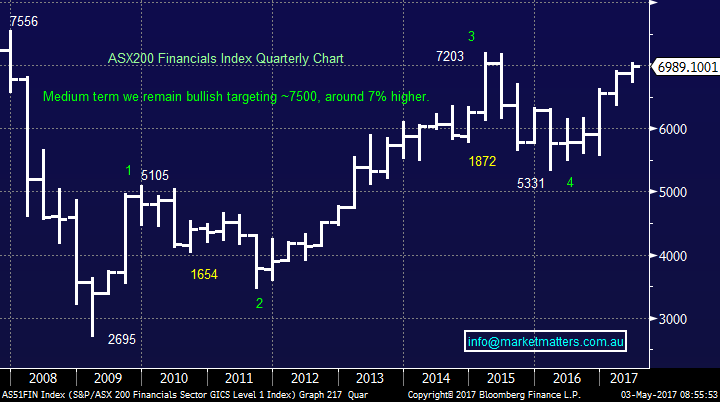
We also remain bullish the financial sector over the longer term which supports our positive outlook for SUN.
ASX200 Financials Index Quarterly Chart
2. Telstra (TLS) $4.26
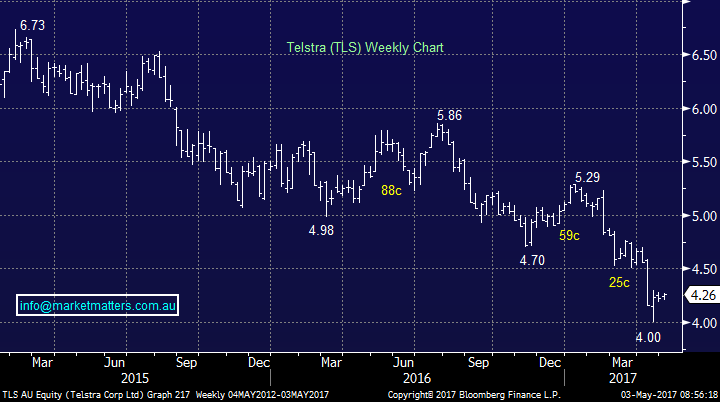
The Telco sector will be fascinating today following another downgrade by Vocus last night, remember they often come in three's before its time to step up and buy. TLS has been smashed, rightly so, over recent times but we believe it's very unlikely to go far under $4 in the foreseeable future. Hence if the stock consolidates at current levels for say 12-months the 7.3% fully franked yield becomes very attractive, particularly when it can be combined with an option strategy for sophisticated investors. Also historically TLS has been a good performer during periods of market weakness although the sector uncertainty around broadband and mobile competition does cloud this previous correlation.
Investors could consider buying TLS around $4.20 with a view / plan to average if we see weakness under $4 - that's our current plan.
Telstra (TLS) Weekly Chart
3. Fairfax Media (FXJ) $1.08
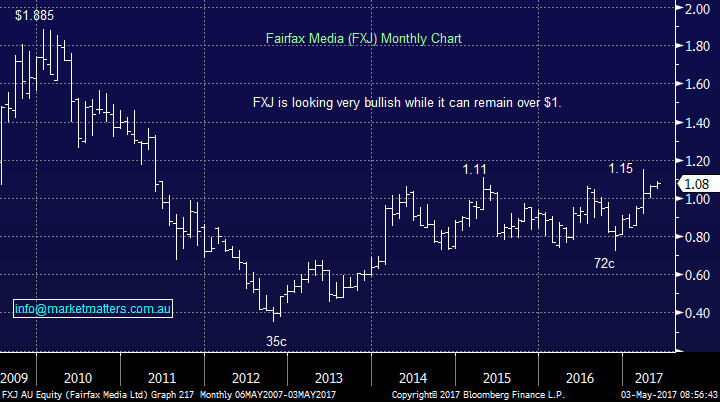
Talk has been rife in the media around a bid by private equity firm TPG for Fairfax with the prize being the real estate website The Domain Group which certainly looks undervalued compared to REA Group. The stock has corrected around 6% since the rumours were flying and we think the risk / reward is becoming more attractive. This is clearly a speculative play but we feel sellers are unlikely to be aggressive in a market pullback if there remains the potential for a takeover bid.
We are comfortable buyers of FXJ around $1.08 as a short term trade but would will re-evaluate the position if we see weakness back under $1.
Fairfax Media (FXJ) Monthly Chart
4. Alumina (AWC) $1.75
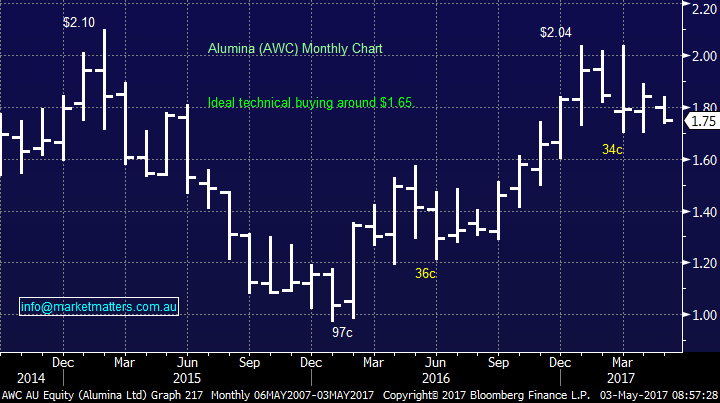
Lastly a stock we have not discussed in a long time but AWC is now becoming interesting. We like the alumina producer under $1.70, or around 3% lower. The stock is trading on an est. P/E of 12.3x which is not demanding and is currently yielding 4.5% fully franked. Notably the stock has fallen while the ASX200 has soared 900-points hence a rally if we get a market correction is not unreasonable.
We like AWC under $1.70 as a shorter term trade.
Alumina (AWC) Monthly Chart
Conclusion (s)
We like SUN, TLS, FXJ and AWC for the reasons briefly outlined above as places to park cash if we see a classic "sell in may and go away" correction in Australian stocks.
Overnight Market Matters Wrap
·Another marginal close was witnessed overnight in the US, as we near towards the end of earnings season and investors wait for further comments on its economy from tonight’s FOMC meeting.
·Disappointing growth indicators in the US was shown, as weaker than expected auto sales data was reported.
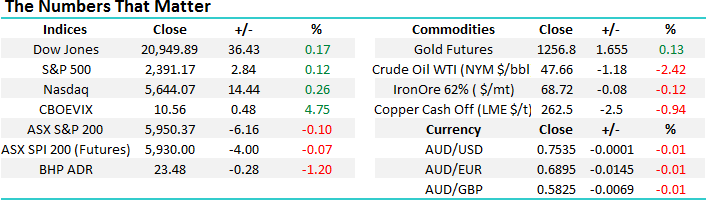
·Oil continues to slide, down 2.42% with BHP expected to feel the pain from its energy business today as it closed an equivalent of -1.2% in the US from Australia’s previous close.
·The June SPI Futures is indicating the ASX 200 to open marginally higher, up 6 points, above the 5955 level this morning.
Disclosure
Market Matters may hold stocks mentioned in this report. Subscribers can view a full list of holdings on the website by clicking here. Positions are updated each Friday.
Disclaimer
All figures contained from sources believed to be accurate. Market Matters does not make any representation of warranty as to the accuracy of the figures and disclaims any liability resulting from any inaccuracy. Prices as at 03/05/2017. 8.00AM.
Reports and other documents published on this website and email (‘Reports’) are authored by Market Matters and the reports represent the views of Market Matters. The MarketMatters Report is based on technical analysis of companies, commodities and the market in general. Technical analysis focuses on interpreting charts and other data to determine what the market sentiment about a particular financial product is, or will be. Unlike fundamental analysis, it does not involve a detailed review of the company’s financial position.
The Reports contain general, as opposed to personal, advice. That means they are prepared for multiple distributions without consideration of your investment objectives, financial situation and needs (‘Personal Circumstances’). Accordingly, any advice given is not a recommendation that a particular course of action is suitable for you and the advice is therefore not to be acted on as investment advice. You must assess whether or not any advice is appropriate for your Personal Circumstances before making any investment decisions. You can either make this assessment yourself, or if you require a personal recommendation, you can seek the assistance of a financial advisor. Market Matters or its author(s) accepts no responsibility for any losses or damages resulting from decisions made from or because of information within this publication. Investing and trading in financial products are always risky, so you should do your own research before buying or selling a financial product.
The Reports are published by Market Matters in good faith based on the facts known to it at the time of their preparation and do not purport to contain all relevant information with respect to the financial products to which they relate. Although the Reports are based on information obtained from sources believed to be reliable, Market Matters does not make any representation or warranty that they are accurate, complete or up to date and Market Matters accepts no obligation to correct or update the information or opinions in the Reports.
If you rely on a Report, you do so at your own risk. Any projections are estimates only and may not be realised in the future. Except to the extent that liability under any law cannot be excluded, Market Matters disclaims liability for all loss or damage arising as a result of any opinion, advice, recommendation, representation or information expressly or impliedly published in or in relation to this report notwithstanding any error or omission including negligence.
To unsubscribe. Click Here


