Evaluating the Market Matters Growth Portfolio (A2M, CBA, CGF, TLS, NAN)
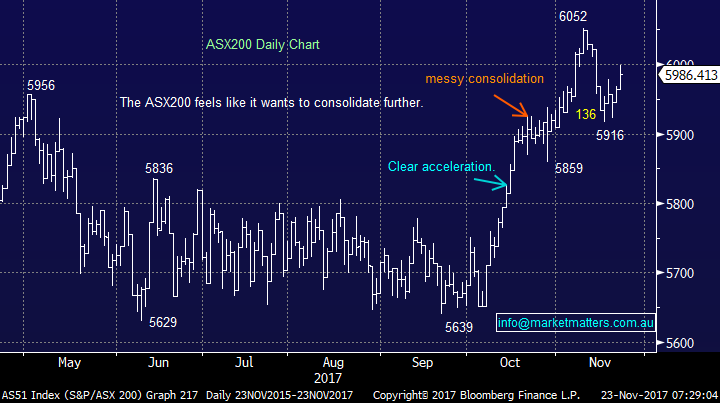
The ASX200 had another assault on the psychological 6000 area yesterday with strength across most sectors leading to an overall gain of 0.4% but some major moves on the stock level caught most people’s attention e.g. Winners - Mineral Resources (MIN) +12.6%, a2 Milk (A2M) up +6.3%, CYB Plc (CYB) +6.2% and losers - Webjet (WEB) -11.6% and Fisher & Paykel -5.3%. The market again demonstrated its current uncanny ability to pick the US market as it drifted 12-points through the afternoon and this morning we find the Dow 64-points lower.
Technically the perfect / easy picture would be a pullback from this 6000 area followed by another leg down towards the major support ~5860. While markets rarely give us the ideal scenario, especially over short time frames, it’s always best to have them clear just in case. For now we remain short-term mildly bearish with local stocks having already corrected around half of the usual ~5% pullback in November. Note we are not married to this seasonal weakness scenario in a year that has already ignored some usual characteristics.
In the bigger picture we remain bullish the ASX200 following its +7% advance since early October and are keen to allocate more funds into appropriate stocks if this current downturn continues looking to benefit from the traditional Christmas rally / window dressing.
Today we are going to focus on our Growth Portfolio following our 3 transactions yesterday – our first triple day!
ASX200 Daily Chart
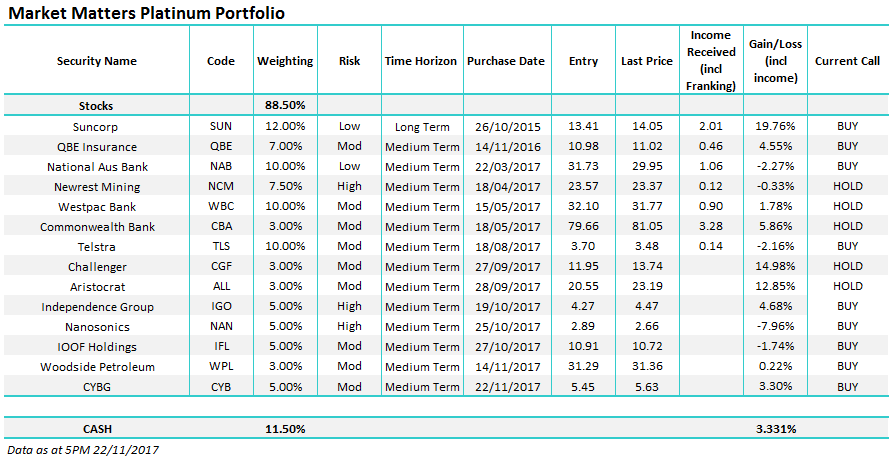
The MM Growth Portfolio.
At MM we constantly evaluate our Growth Portfolio in the attempt to generate optimum returns while obviously taking into account risk. We live in fortuitous times for the investor where brokerage charges have fallen from ~2% to both buy and sell to just a few $$’s to transact, over just a few decades, enabling investors the opportunity to tailor their holdings without the very real fear of chewing up returns in costs – hence the more active investor like MM has been born.
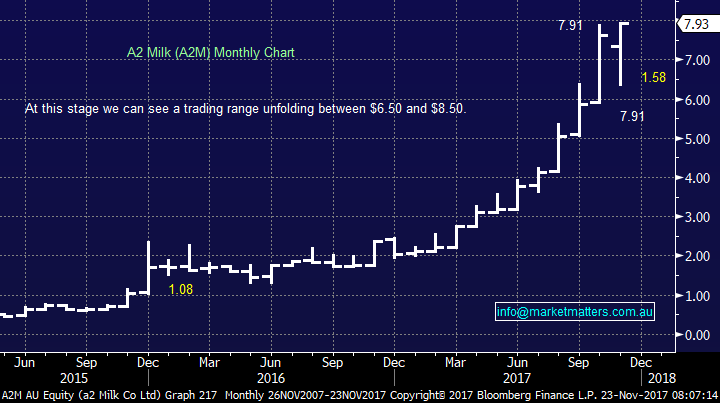
I like to again take this opportunity to point out that we are not traders as our largest holding, 12% in Suncorp, illustrates – we have been long for over 2-years and are currently showing a healthy paper profit of almost 20%. However we do believe when shorter term opportunities arise in quality stocks, not a penny dreadful, we so no reason not to try and reap potential rewards e.g. yesterdays 22% realised profit from a2 Milk (A2M) in just 2 weeks.
Yesterday we took a very healthy ~22% profit in a2 Milk (A2M) but some of the comments we received were interesting but happily not negative.
- When we bought the stock after its $1.58 / 20% correction people wondered why we were buying a stock that had run so hard in 2017, questioning if we had missed the party.
- When we sold yesterday, before our $8 target area, people wondered why we sold a stock that looked so good.
Our answer is pretty simple – we were very happy with 22% in just a fortnight, the stock was within a few cents of our technical target and importantly the stocks volatility has gone gangbusters often implying a top is being formed i.e. the average move of the last 4 weeks is over 90c / almost 12%.
Remember multi-billionaire investor Baron Rothschild - "I never buy at the bottom and I always sell too soon."
A2 Milk (A2M) Monthly Chart
1 Banks
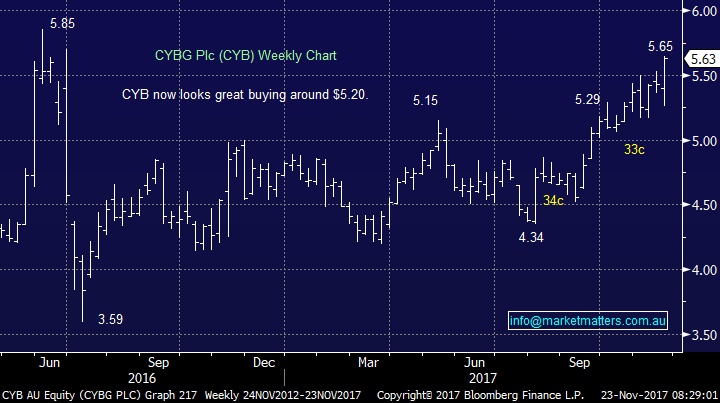
We hold 28% of the MM Growth Portfolio in local banks via CBA, CYB , NAB and WBC – a mildly overweight position.
Yesterday we switched our Bank of Queensland (BOQ) position over to CYB – basically locking in a nice “free” fully franked dividend. CYB is our preferred bank from a potential price appreciation basis following its excellent report this week, which led to a 6.2% rally yesterday its not often your ahead 3.3% in a bank on the day of purchase!
Overall we like banks into 2018 and are looking for an opportunity to increase our CBA holding back up towards 10% as the November banking correction is not materialising. Also, if banks run very hard into 2018 we may consider taking profit on NAB or WBC who do not go ex-dividend until mid-2018.
CYBG Plc (CYB) Weekly Chart
2 Insurers
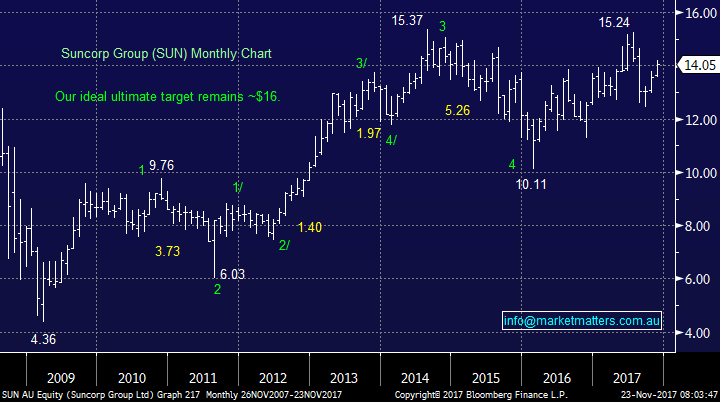
We are holding a hefty 19% in the often scary insurance sector via 12% in Suncorp (SUN) and 7% in QBE Insurance (QBE).
Suncorp (SUN) $14.05 – Our target for SUN in this bull market is ~$16 / 14% higher. If during a Christmas rally the stock trades over $15 we may consider reducing our position.
QBE Insurance (QBE) – This stock continues to disappoint on the corporate level but should benefit from higher US interest rates and a weaker $A/$US both of which fit our current views. We re also seeing improvement in commercial insurance premiums. We will certainly consider selling this position into any Christmas strength.
Suncorp (SUN) Monthly Chart
3 Resources
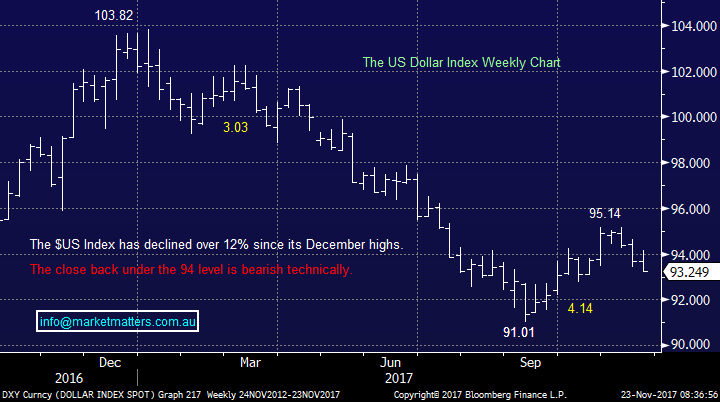
We hold 15.5% of our portfolio in 3 resource stocks having locked in some great profits over recent months. We believe the $US is the key to the sectors performance into Christmas and are targeting a further 3-4% decline to fresh 2017 lows, this is theory should be supportive of resource stocks.
Independence Group (IGO) $4.47 – we like this Nickel mining and exploration company as demand continues to grow. We actually have a target close to $6.
Woodside Petroleum (WPL) $31.36 – we like this holding following Shells large placement. The stock should start advancing towards the mid/high $30 region if crude oil can rally to our $US70/barrel target.
Newcrest Mining (NCM) $23.37 – our least favourite holding in the sector and we are looking to sell if / when the $US trades down towards the 90 level, which will hopefully coincide with NCM rallying over $25.
$US Index Weekly Chart
A valuation comparison of our major resource companies
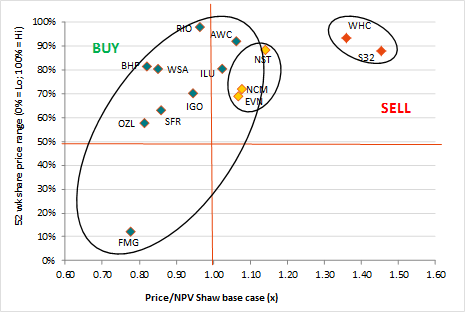
Source: Shaw and Partners
4 Fund Managers
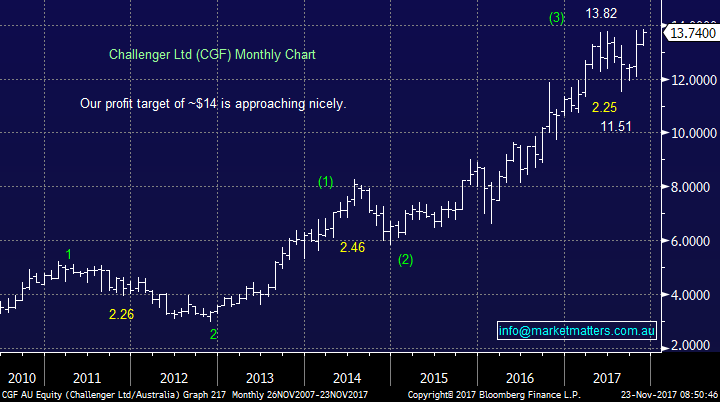
We have an 8% weighting here via IOOF Holdings (IFL) and Challenger (CGF). While we are comfortable with both holdings we remain likely to take a healthy profit in CGF above $14.
Challenger (CGF) Monthly Chart
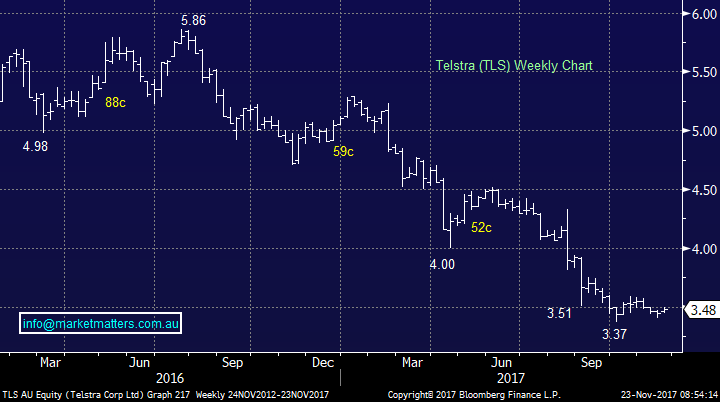
5 Telco’s
We currently have 10% of our portfolio in the much maligned TLS which is down over 30% over the last 12-months. We are down 2% on our holding, probably better than most but still not a good outcome.
We can see ourselves reducing / selling the position in the near future.
Telstra (TLS) Weekly Chart
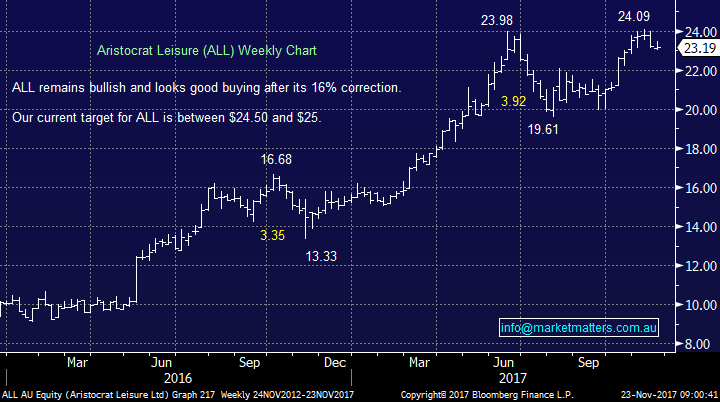
6 Consumer Services
We hold 3% of our portfolio in this sector via Aristocrat (ALL) and we remain comfortable with our $24.50-$25 target area.
Aristocrat (ALL) Weekly Chart
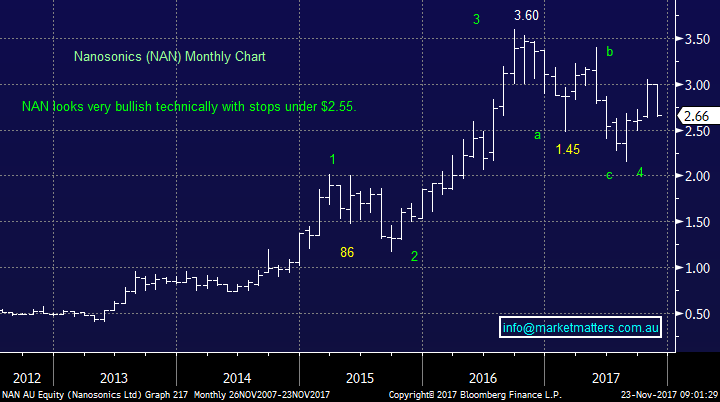
7 Healthcare
We hold 5% of our portfolio in Nanosonics (NAN) which is undoubtedly our poorest position at present showing almost a 8% paper loss following a recent broker downgrade.
We will exit this position if it cannot hold over $2.60 – capital preservation is always the key to investing.
Nanosonics (NAN) Monthly Chart
Global markets
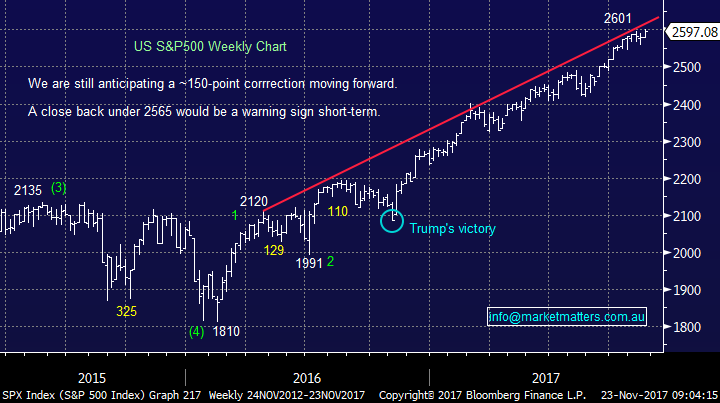
US Stocks
The US continues to oscillate around all-time highs and although we need a ~5% correction to provide a decent risk / reward buying opportunity, no sell signals have been generated to-date. We would not be surprised to see this choppy advance continue into Christmas as the bears throw in the towel.
US S&P500 Weekly Chart
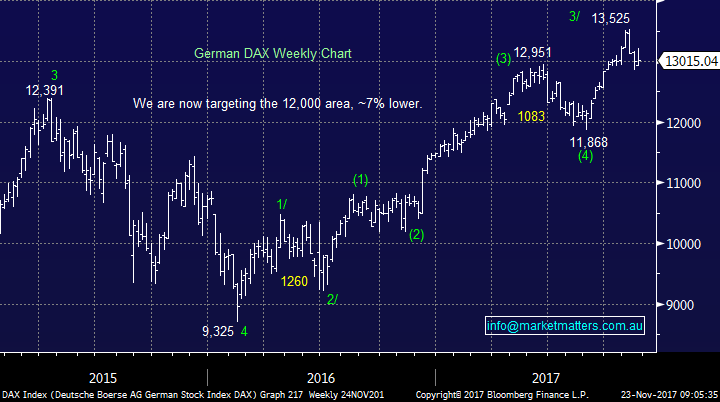
European Stocks
European stocks look to be failing after their recent break out to fresh 2017 highs, we are now neutral / negative Europe over the next few weeks.
German DAX Weekly Chart
Conclusion (s)
We are comfortable with the majority of the MM Growth Portfolio the below stocks looking the most likely to be tweaked moving forward:
Buyers – CBA plus other short term opportunities for December, Mineral Resources 12.5% advance yesterday showed they are about!
Sellers – CGF, TLS and NAN.
*Watch for alerts.
Disclosure
Market Matters may hold stocks mentioned in this report. Subscribers can view a full list of holdings on the website by clicking here. Positions are updated each Friday, or after the session when positions are traded.
Disclaimer
All figures contained from sources believed to be accurate. Market Matters does not make any representation of warranty as to the accuracy of the figures and disclaims any liability resulting from any inaccuracy. Prices as at 23/11/2017. 9.00 AM.
Reports and other documents published on this website and email (‘Reports’) are authored by Market Matters and the reports represent the views of Market Matters. The MarketMatters Report is based on technical analysis of companies, commodities and the market in general. Technical analysis focuses on interpreting charts and other data to determine what the market sentiment about a particular financial product is, or will be. Unlike fundamental analysis, it does not involve a detailed review of the company’s financial position.
The Reports contain general, as opposed to personal, advice. That means they are prepared for multiple distributions without consideration of your investment objectives, financial situation and needs (‘Personal Circumstances’). Accordingly, any advice given is not a recommendation that a particular course of action is suitable for you and the advice is therefore not to be acted on as investment advice. You must assess whether or not any advice is appropriate for your Personal Circumstances before making any investment decisions. You can either make this assessment yourself, or if you require a personal recommendation, you can seek the assistance of a financial advisor. Market Matters or its author(s) accepts no responsibility for any losses or damages resulting from decisions made from or because of information within this publication. Investing and trading in financial products are always risky, so you should do your own research before buying or selling a financial product.
The Reports are published by Market Matters in good faith based on the facts known to it at the time of their preparation and do not purport to contain all relevant information with respect to the financial products to which they relate. Although the Reports are based on information obtained from sources believed to be reliable, Market Matters does not make any representation or warranty that they are accurate, complete or up to date and Market Matters accepts no obligation to correct or update the information or opinions in the Reports.
If you rely on a Report, you do so at your own risk. Any projections are estimates only and may not be realised in the future. Except to the extent that liability under any law cannot be excluded, Market Matters disclaims liability for all loss or damage arising as a result of any opinion, advice, recommendation, representation or information expressly or impliedly published in or in relation to this report notwithstanding any error or omission including negligence.
To unsubscribe. Click Here


