Could Iran & Aramco become too much for the Oil sector? (WPL, BPT, STO)
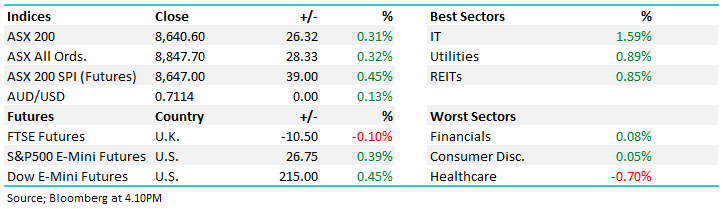
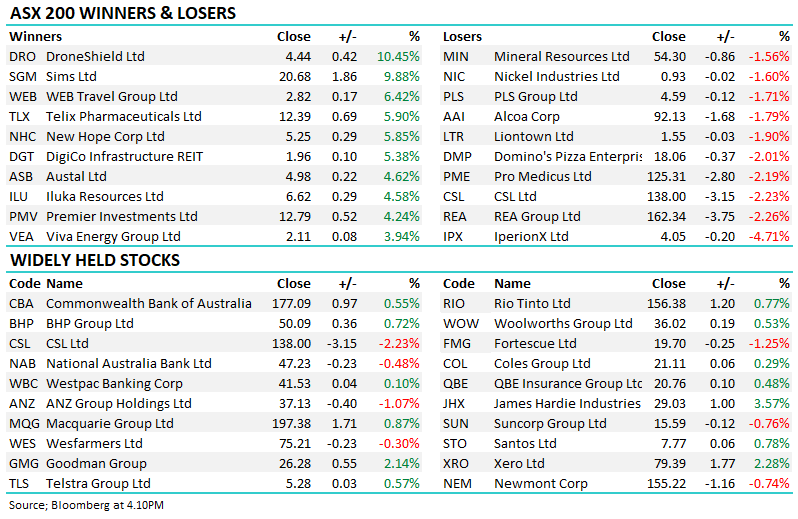
A 17-point push by the ASX200 at 4pm yesterday took the market to a respectable +0.36% close, nothing like leaving it to the last minute. The sector rotation continued in earnest as the Banks & Resources continued to rally strongly while the IT, Healthcare and “yield plays” struggled – a subject we’ve been examining in recent reports. The market breadth was impressive for what felt like a quiet day, except for the last minute finale, as winners beat losers 2:1 while a solid 12% of the ASX200 managed to close up by more than 3%.
Some of the more battered stocks continued to receive a bid tone with the likes of AMP Ltd (AMP) +3.6%, Boral (BLD) +3.5%, South32 (S32) +3.3%, Pact Group (PGH) +3.1% catching our eye. Potentially we’re seeing some profit taking in this years top performers like Appen (APX) -5.2% and Charter Hall Group (CHC) -5.7% with some of the realised monies probably going bargain hunting across the index. Overall at MM we believe this sector reversion has further to unfold hence we wouldn’t be “fighting” the current moves. Interestingly performance reversion also unfolded between the ASX200 and the booming New Zealand Index which fell almost 2% while we rallied.
Yesterday MM dipped our toe back into the gold sector with a 3% allocation into Evolution mining (EVN) for our Growth Portfolio taking our elevated cash position down to 26%. EVN has now corrected over 17% in under 6-weeks making it an ideal opportunity to commence accumulating the sector which has struggled as bond yields have bounced marginally higher – subscribers / investors who believe that bond yields have reached their nadir are probably best to avoid the gold sector, however until proven otherwise, we believe it’s a move to fade.
Short-term MM remains comfortable adopting a conservative stance towards equities around current levels.
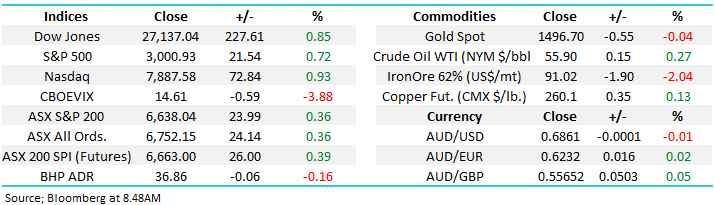
Overnight US stocks closed strongly led by the NASDAQ which rallied +0.9%, the broad based S&P500 is now only 1% below its all-time high. A tweet by President Trump calling for interest rates at zero, or lower, wouldn’t have hurt sentiment but it felt more directed at the Fed in an effort to improve his position for next November’s election. A few weeks ago we said that stocks “felt like they wanted to rally when no negative news flashed across our screens”, this continues to feel true. The SPI futures are calling the ASX200 to open up 25-points this morning.
This morning MM is going to revisit the Energy Sector as President Trump considers easing sanctions on Iran which sent crude tumbling down ~2.6% overnight, plus many people now anticipate that Saudi’s long awaited $US1.5-2 trillion float of Aramco to be due “very soon”.
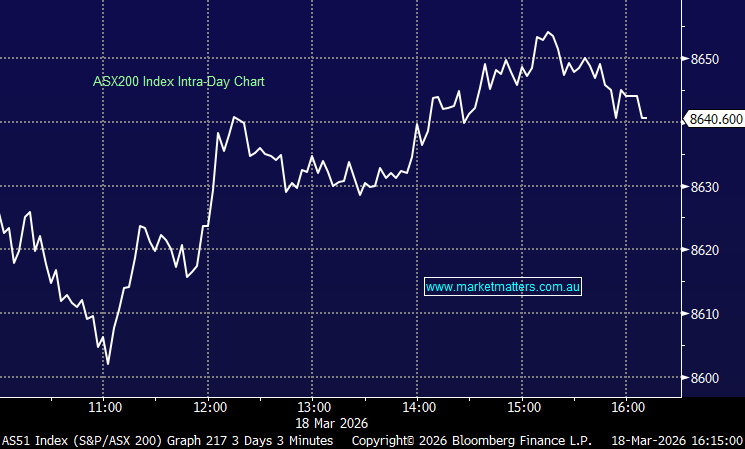
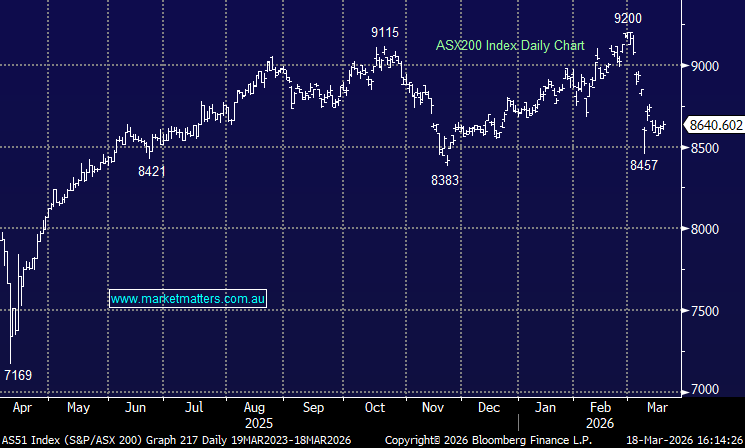
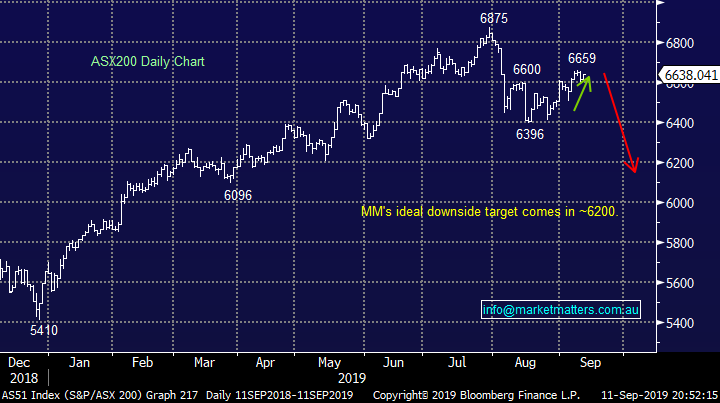
ASX200 Chart
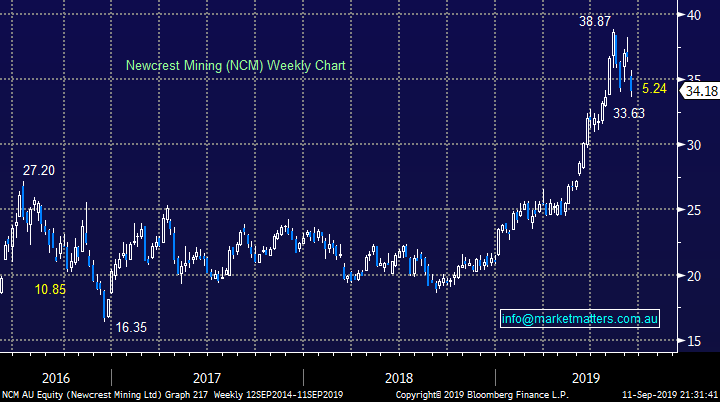
As we mentioned earlier MM bought Evolution Mining (EVN) yesterday as we look to re-establish a gold position into the sectors current weakness. Apart from Evolution (EVN) our favourite sector pick is heavyweight Newcrest (NCM) which has corrected over 13% from its early August high. MM remains bullish NCM targeting a test of $40 hence we are considering buying around current levels.
MM is bullish Australian gold stocks into the current weakness.
Newcrest Mining (NCM) Chart
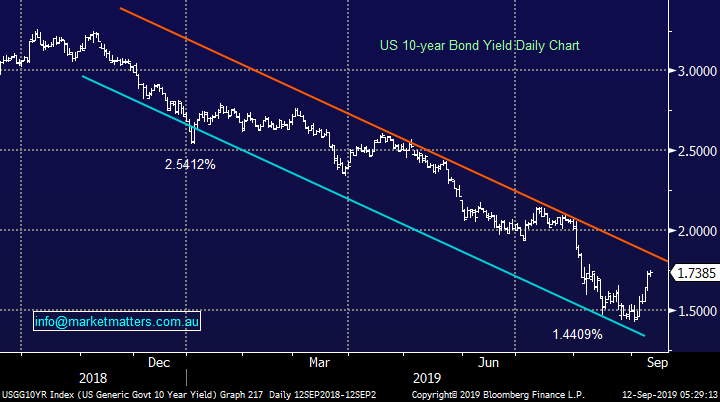
Overnight we saw a slowing of the switch from growth to value stocks which was shown by the tech based NASDAQ outperforming both the Dow and S&P500. This rotation in our opinion has been triggered by US 10-year bond yields bouncing strongly over the last 2-weeks i.e. growth stocks revel in a low interest rate environment. There’s no reason yet to conclude bond yields have bottomed but we would be inclined to buy another fresh low for growth as opposed looking for more acceleration to the downside,
The down trend in US & global bond yields has been aggressive in 2019 as many market followers now expect a recession in the next 12-months. President Trump’s approval rating has fallen below 40% following concerns on how he’s handling the US economy, around 60% of Americans now believe a recession is very likely hence the volatile President needs to resolve US – China trade sooner rather than later to kick start his 2020 election campaign - a potentially bullish outcome for bond yields.
On balance MM thinks US bond yields will at least test sub 1.5% one more time.
US 10-year Bond yield Chart
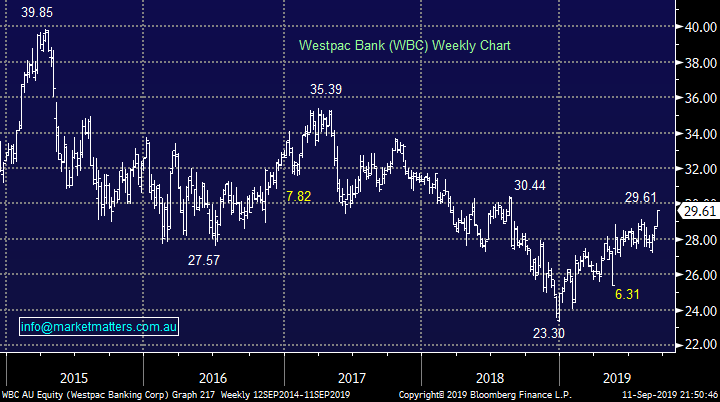
Yesterday Westpac (WBC) made fresh 12-month highs potentially assisted by the tick up in bond yields. However to the income starved Australian investor the banks yield remains extremely attractive – the average term deposit is now around 1.5% compared to WBC paying 6.35% fully franked, a 94c dividend is anticipated in November.
MM remains bullish the banks medium-term.
Westpac (WBC) Chart
Will Iran & Aramco become too much for the Oil sector?
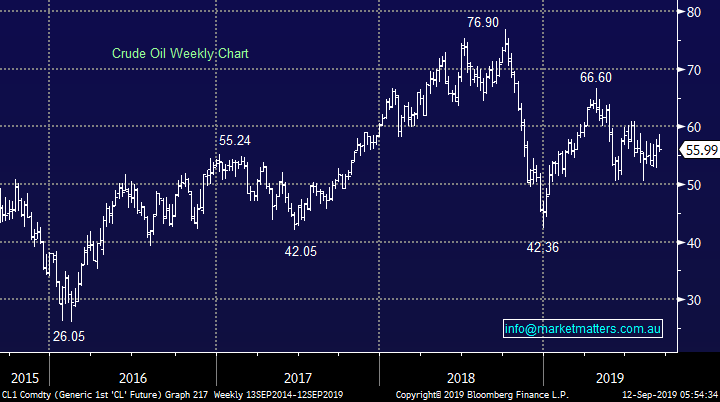
Overnight we saw a 2.6% fall in crude oil as belief of potential easing’s in sanctions against Iran gathered momentum. However the chart below illustrates the move hardly registers compared to swings over the last few years with crude oil remaining very range bound with no clear direction. A major catalyst appears required to see a breakout of the $US50/barrel - $US60/barrel trading range which has been controlling since May.
MM is neutral crude oil at current levels.
Crude Oil Chart
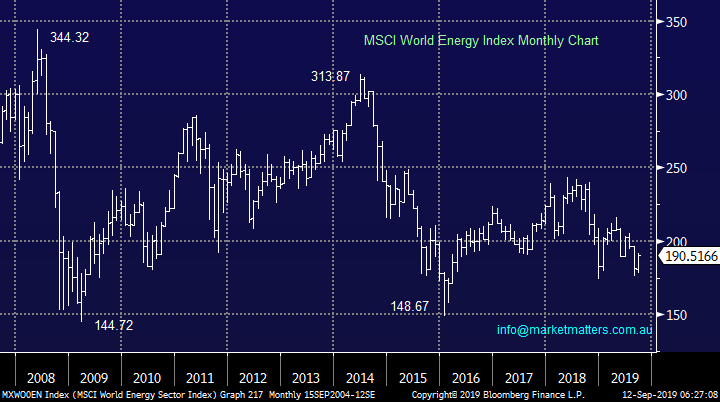
With Iran currently appearing to have little meaningful impact on the underlying crude oil price lets now consider the huge $US1.5-2 trillion float of Saudi goliath Aramco. It’s not yet clear where they will list although Trump has already volunteered / pitched the New York Stock Exchange to the Saudi’s, via tweet of course, give him his due he’s always trying! When the company does finally list its highly likely to attract some monies from other members of the sector as fund managers seek allocations without increasing their oil / energy exposure.
To put the float into perspective the 2 largest global oil companies EXXON Mobil (XOM US) and Chevron Coro (CVX US) are valued at $US304bn and $US230bn respectively while local heavyweight Woodside (WPL) is only valued at $A30bn. Hence a massive $US1.5-2 trillion listing is likely to pressure the currently listed global energy stocks for a few months.
MM is currently neutral the global Energy Sector.
MSCI World Energy Index Chart
Today we have briefly looked at 3 Australian energy stocks to see if any value has emerged over 2019.
1 Woodside Petroleum (WPL) $32.19
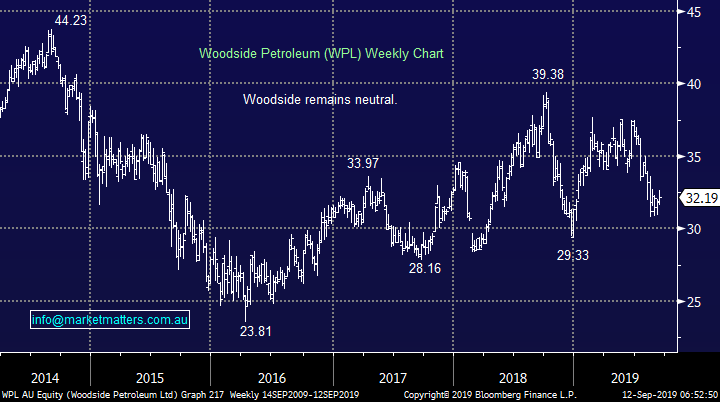
Local heavyweight WPL has struggled to keep pace with the ASX200 through 2019 and although it’s still positive for the year the stocks clearly at the bottom of its $30.48 - $37.70 trading range.
Technically WPL remains neutral, like most of its global peers, although the anticipated 5.6% fully franked yield is attractive hence we hold the stock in our Income Portfolio – its next dividend is due in February 2019. If the stock tests major support ~$30 it will look attractive on both a risk / reward and yield perspective.
MM likes WPL around $30.
Woodside Petroleum (WPL) Chart
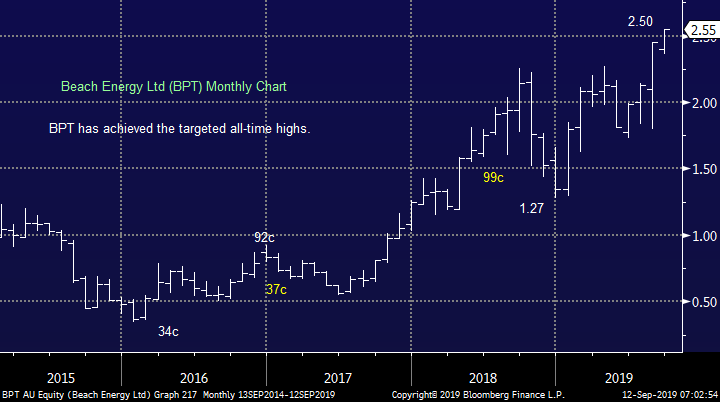
2 Beach Energy (BPT) $2.55
BPT has reached our target area leaving us neutral from a technical perspective. The company reported solid Q4 quarterly results back in late July showing free cash flow of $130m.
However after an excellent run since early 2018 I’m a little concerned that BPT might encounter some profit taking with the likes of WPL and obviously Aramco potentially becoming more attractive from a relative value perspective.
MM is now neutral BPT.
Beach Energy (BPT) Chart
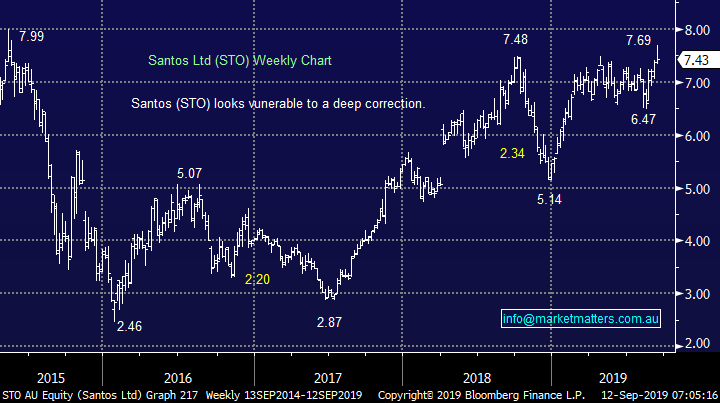
3 Santos (STO) $7.43
Over recent weeks MM has been looking for Santos (STO) to challenge the $8 area. After this weeks rejection of $7.70 and last night Iran’s news we are becoming far more cautious, before considering Aramco.
MM is now neutral / negative STO.
Santos (STO) Chart
Conclusion (s)
MM is unlikely to buy oil stocks at current levels.
Global Indices
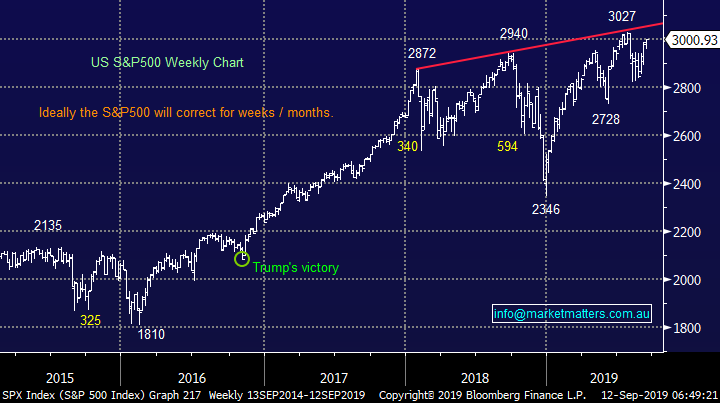
No major change yet, we are looking for a decent pullback from this 3000 area by the S&P500 but no specific sell signals have been triggered – note at the moment we still feel a break to fresh all-time highs will fail to aggressively follow through to the upside.
US stocks will generate a short-term sell signal below 2935, or 2.2% lower.
US S&P500 Index Chart
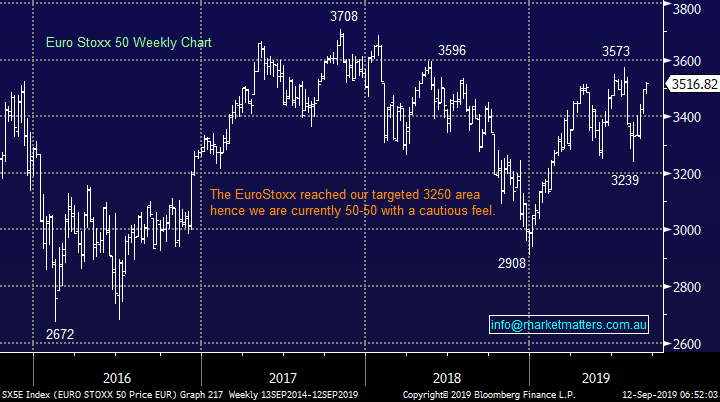
No change again with European indices, while we remain cautious European stocks as their tone has become more bearish over the last few months, however we had been targeting a correction of at least 5% for the broad European indices, this has now been achieved.
The long-term trend is up hence any “short squeezes” might be harder and longer than many anticipate, potentially one is currently unfolding.
Euro Stoxx 50 Chart
Overnight Market Matters Wrap
· US equities rallied overnight on comments from Trump targeting the Fed, calling them bone-heads and saying rates should be at zero. He has also floated plans to cut capital gains tax by indexing gains to inflation.
· On the US-China trade front, China has released a list of products that it will exempt from its retaliatory tariffs on US made goods, although most are at the smaller end of the spectrum
· Nickel and copper fell on the LME, while iron ore rose 1.5%. US 10 year bonds are stable at 1.74% despite the Presidents encouraging the Fed to lower rates.
· Crude oil fell more than 2% after Trump mentioned easing sanctions on Iran.
· The September SPI Futures is indicating the ASX 200 to open 26 points higher, testing the 6665 level this morning.
Have a great day!
James & the Market Matters Team
Disclosure
Market Matters may hold stocks mentioned in this report. Subscribers can view a full list of holdings on the website by clicking here. Positions are updated each Friday, or after the session when positions are traded.
Disclaimer
All figures contained from sources believed to be accurate. All prices stated are based on the last close price at the time of writing unless otherwise noted. Market Matters does not make any representation of warranty as to the accuracy of the figures or prices and disclaims any liability resulting from any inaccuracy.
Reports and other documents published on this website and email (‘Reports’) are authored by Market Matters and the reports represent the views of Market Matters. The Market Matters Report is based on technical analysis of companies, commodities and the market in general. Technical analysis focuses on interpreting charts and other data to determine what the market sentiment about a particular financial product is, or will be. Unlike fundamental analysis, it does not involve a detailed review of the company’s financial position.
The Reports contain general, as opposed to personal, advice. That means they are prepared for multiple distributions without consideration of your investment objectives, financial situation and needs (‘Personal Circumstances’). Accordingly, any advice given is not a recommendation that a particular course of action is suitable for you and the advice is therefore not to be acted on as investment advice. You must assess whether or not any advice is appropriate for your Personal Circumstances before making any investment decisions. You can either make this assessment yourself, or if you require a personal recommendation, you can seek the assistance of a financial advisor. Market Matters or its author(s) accepts no responsibility for any losses or damages resulting from decisions made from or because of information within this publication. Investing and trading in financial products are always risky, so you should do your own research before buying or selling a financial product.
The Reports are published by Market Matters in good faith based on the facts known to it at the time of their preparation and do not purport to contain all relevant information with respect to the financial products to which they relate. Although the Reports are based on information obtained from sources believed to be reliable, Market Matters does not make any representation or warranty that they are accurate, complete or up to date and Market Matters accepts no obligation to correct or update the information or opinions in the Reports. Market Matters may publish content sourced from external content providers.
If you rely on a Report, you do so at your own risk. Past performance is not an indication of future performance. Any projections are estimates only and may not be realised in the future. Except to the extent that liability under any law cannot be excluded, Market Matters disclaims liability for all loss or damage arising as a result of any opinion, advice, recommendation, representation or information expressly or impliedly published in or in relation to this report notwithstanding any error or omission including negligence.