Could Australia be headed for a Recession?
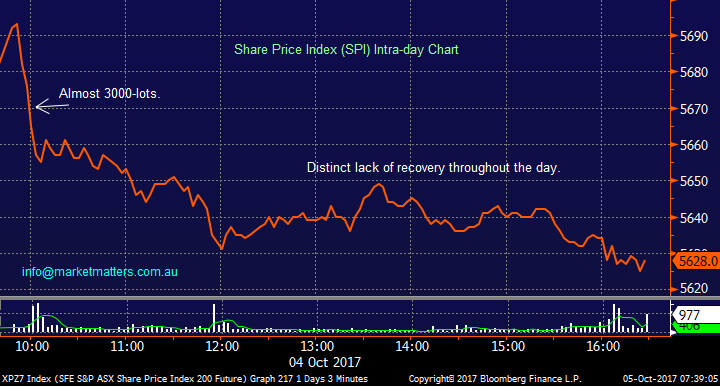
Since June, buying the local market as it was sold off towards the 5600 area has proven correct, but as we all know nothing lasts forever, we are very cautious this time. Yesterday’s savage 49-point / 0.9% sell-off had no obvious lead and was pretty unexpected on all, but the most bearish trading desks. The selling kicked in aggressively at 10am as the stocks opened, with 3000-SPI futures contracts being sold in just 6-minutes, this equated to 17% of the entire day’s volume in this particular market.
We’ve mentioned this early aggressive selling of the SPI futures a number of times over recent weeks and today we thought was an opportune time to ensure subscribers understand the implications to our underlying stock market which we are all familiar.
1 A SPI futures contracts value is calculated by the price multiplied by $25.
2 Hence at yesterday’s 9.50am open of 5689 one SPI contract was worth $142,225 (5689 x $25).
3 Subsequently when someone sells 3000 lots in a few minutes it’s the equivalent a portfolio of over $426m being dumped at market i.e. 3000 x 5689 x $25.
4 Yesterday’s total daily turnover on the ASX200 was $3,925,221,650 hence this one quick order was ~11% of the days total turnover, before we even consider the huge % of day trading etc. within this $3.925bn total.
The SPI very often leads the ASX200 as it’s a quick and efficient way to buy / sell the overall market. If the SPI falls too far compared to the underlying index, arbitrage kicks in and computers buy the SPI and sell stocks, hence realigning market efficiency.
Obviously we have no way of knowing who the seller(s) are of the SPI over recent weeks, previously we speculated it was an overseas fund manager taking advantage of the local markets performance in $US with the $A trading close to the psychological 80c level. However, the exciting factor is SPI selling leads to overall market selling and hence opportunities can arise in quality stocks e.g. Challenger (CGF) and Aristocrat (ALL) last week – both positions remain comfortably in profit - touch wood!
S&P ASX Share Price Index 200 (SPI) Intra-day Chart
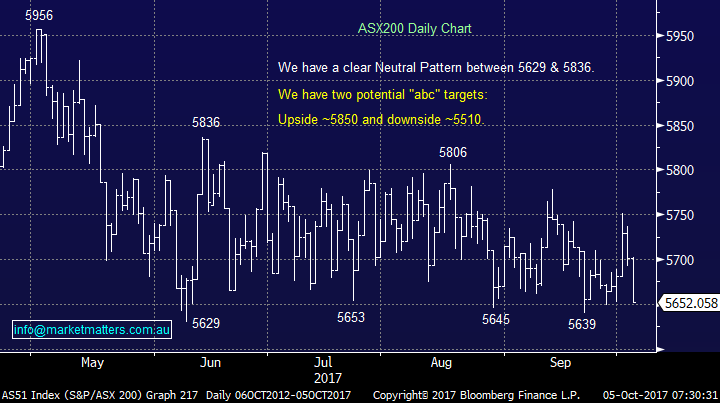
The ASX200 closed just 23-points / 0.4% above its 20-week low, hence not surprisingly we remain comfortable with our short-term bearish projected pullback to the psychological 5500 area.
ASX200 Daily Chart
Global Markets
US Stocks
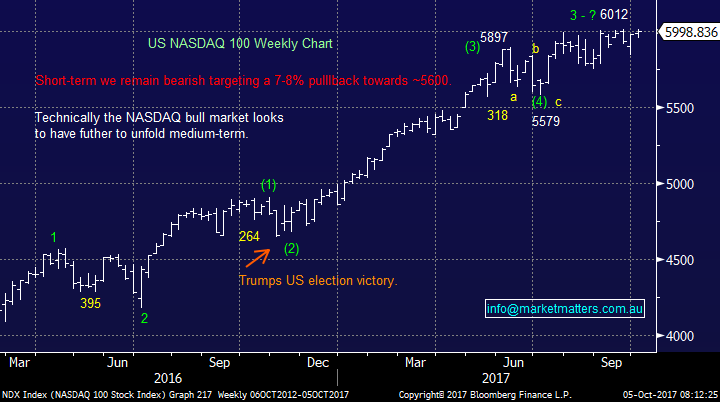
Last night the broad based S&P500 closed up 0.1%, around its all-time high. We remain concerned around the current complacency within the US market but stress no sell signals have yet materialised.
There is no change to our short-term outlook for US stocks, we are targeting / need a ~5% correction before the risk / reward favours buying this market.
US NASDAQ Weekly Chart
European Stocks
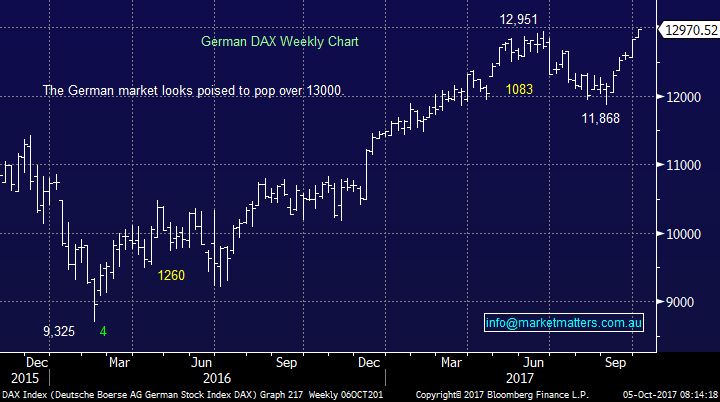
No change, European stocks look poised to make further fresh 2017 highs in the next few days / weeks but we would not be surprised to see this rally fail and another pullback towards 12,000 unfold for the German DAX.
German DAX Weekly Chart
Asian Stocks
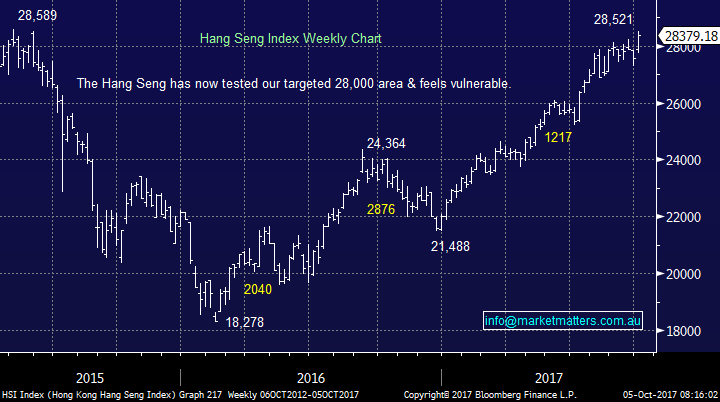
The Hang Seng remains strong, especially after enjoying the 3% advance over the last 2-days but we continue to believe this 28,000 area will be a magnet for the market over coming weeks / months.
Hong Kong’s Hang Seng Weekly Chart
Thoughts on an Australian Recession
The average Australian has less money in their pockets than over previous decades and are spending less accordingly. The young are finding it harder to buy a house as prices surge aided by record low interest rates. Sydney is now the 2nd most expensive city in the world leading to 16% less 25-34 year old’s getting on the property ladder and this very same drive to own expensive real estate has pushed household debt to a record high. Australians retiring with debt will put increased pressure on the government welfare system moving forward, the net result:
“The Australian government / RBA cannot make many mistakes or we will see the first Australian recession in 26-years”.
Our concern is that the local economy feels like a crème brulee i.e. soft underneath and brittle on top. For now things are ok but any decent fall in housing prices is likely to hammer consumer confidence leading to economic stagnation – us Australians basically expect our house to go up in value every year! Just consider what other countries have done to improve housing affordability – another way of saying making house prices fall!
1 Singapore has experienced 3-years of falling prices following a number of measures including banning interest only loans.
2 Canada has seen prices plunge following measures like a 15% tax on foreign buyers in some cities.
The above 2 examples sound very familiar to what we have been hearing locally and it now feel prices have initially come off the boil. The underlying numbers show our economy is fine and the likes of the US and China are definitely helping, but we feel both the government and RBA are walking a tightrope with marginal room for error – they would love for house prices to remain static for at least a few years but this is not an easy scenario to engineer.
Overall it’s easy to see why the ASX200 is unpopular on the global stage but this will ultimately lead to some amazing opportunities so it’s not all doom and gloom. For now it’s important to keep our fingers on the pulse as the next few years look fascinating but only for the prepared and flexible.
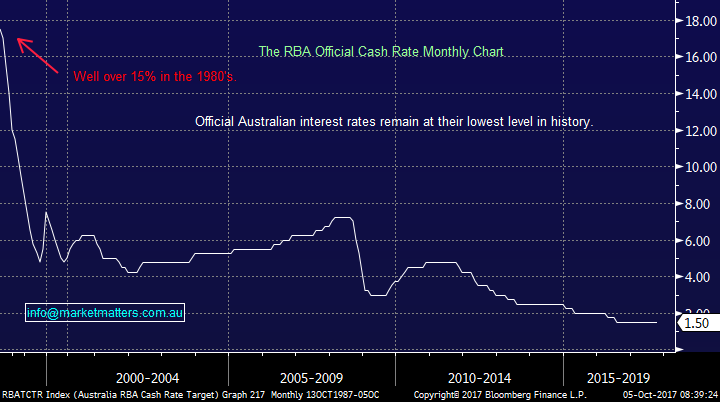
We’ve said previously that we can see an interest rate rise on Melbourne Cup day in 2018 but it may be a case of “one and done” for a while as the RBA watch the housing market extremely closely.
RBA Cash Rate Monthly Chart
3 stocks we’re watching closely
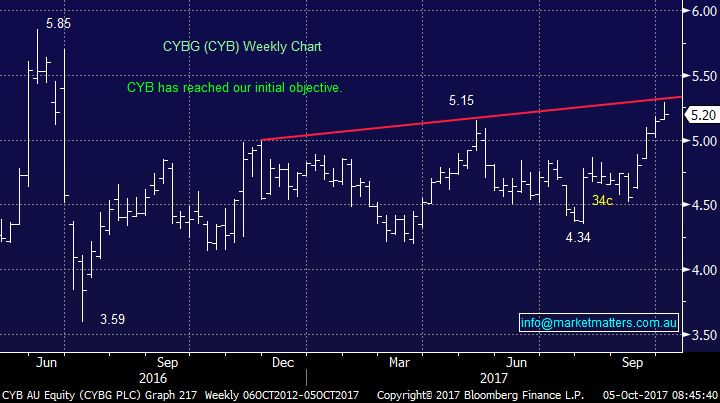
1 CYBG Plc (CYB) $5.20
We remain sellers of half of our holding in CYB at $5.30, this level may be lowered over the next week.
CYBG Plc (CYB) Weekly Chart
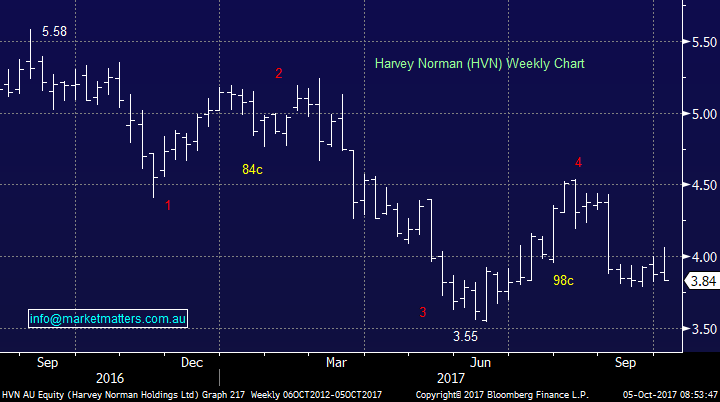
2 Harvey Norman (HVN) $3.84
HVN got hit almost 4% yesterday, underperforming in a weak market. We remain buyers about 10% lower which in this environment feels relatively close – note this may be a purchase for both our Platinum and Income Portfolios.
Harvey Norman (HVN) Weekly Chart
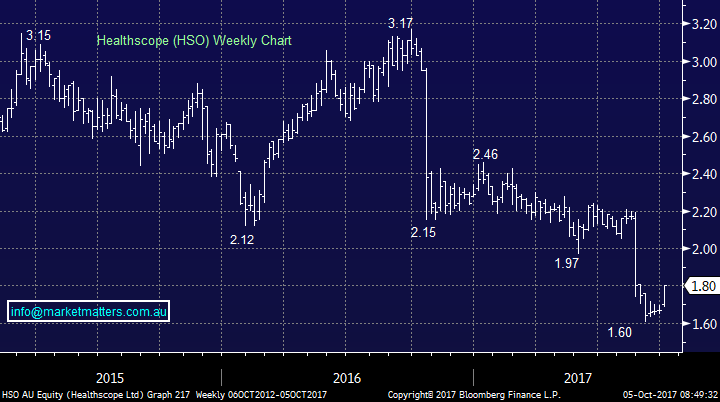
3 Healthscope (HSO) $1.80
Unfortunately we exited HSO a few days early, but if we were still long we would be sellers over $1.80 in the short-term. We have not given up on HSO moving forward and will still consider buying into weakness.
*It’s important to learn and move on from mistakes / bad luck, at MM we are comfortable buying stocks at higher prices than we previously exited if we see value.
Healthscope (HSO) Weekly Chart
Conclusion (s)
We remain happy to increase our market exposure into weakness but see no reason to chase stocks at current levels.
Overnight Market Matters Wrap
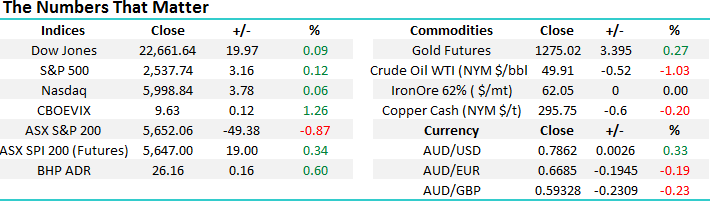
· The US equity markets continue to climb higher, but only marginally overnight, with the US Institute for Supply Management mentioning that the service sector activity rose to its highest level since 2005, despite recent hurricanes.
· On the commodities front, oil slid 1.03%, while iron was unchanged at US$62.05/t. BHP however, is expected to outperform the broader market yet again after ending its US session an equivalent of 0.60% higher from Australia’s previous close to $26.16.
· The December SPI Futures is indicating the ASX 200 to open 11 points higher towards the 5665 area this morning.
Disclosure
Market Matters may hold stocks mentioned in this report. Subscribers can view a full list of holdings on the website by clicking here. Positions are updated each Friday.
Disclaimer
All figures contained from sources believed to be accurate. Market Matters does not make any representation of warranty as to the accuracy of the figures and disclaims any liability resulting from any inaccuracy. Prices as at 5/10/2017. 8.00AM.
Reports and other documents published on this website and email (‘Reports’) are authored by Market Matters and the reports represent the views of Market Matters. The MarketMatters Report is based on technical analysis of companies, commodities and the market in general. Technical analysis focuses on interpreting charts and other data to determine what the market sentiment about a particular financial product is, or will be. Unlike fundamental analysis, it does not involve a detailed review of the company’s financial position.
The Reports contain general, as opposed to personal, advice. That means they are prepared for multiple distributions without consideration of your investment objectives, financial situation and needs (‘Personal Circumstances’). Accordingly, any advice given is not a recommendation that a particular course of action is suitable for you and the advice is therefore not to be acted on as investment advice. You must assess whether or not any advice is appropriate for your Personal Circumstances before making any investment decisions. You can either make this assessment yourself, or if you require a personal recommendation, you can seek the assistance of a financial advisor. Market Matters or its author(s) accepts no responsibility for any losses or damages resulting from decisions made from or because of information within this publication. Investing and trading in financial products are always risky, so you should do your own research before buying or selling a financial product.
The Reports are published by Market Matters in good faith based on the facts known to it at the time of their preparation and do not purport to contain all relevant information with respect to the financial products to which they relate. Although the Reports are based on information obtained from sources believed to be reliable, Market Matters does not make any representation or warranty that they are accurate, complete or up to date and Market Matters accepts no obligation to correct or update the information or opinions in the Reports.
If you rely on a Report, you do so at your own risk. Any projections are estimates only and may not be realised in the future. Except to the extent that liability under any law cannot be excluded, Market Matters disclaims liability for all loss or damage arising as a result of any opinion, advice, recommendation, representation or information expressly or impliedly published in or in relation to this report notwithstanding any error or omission including negligence.
To unsubscribe. Click Here


