Central banks and the stock market (OZL, STO)
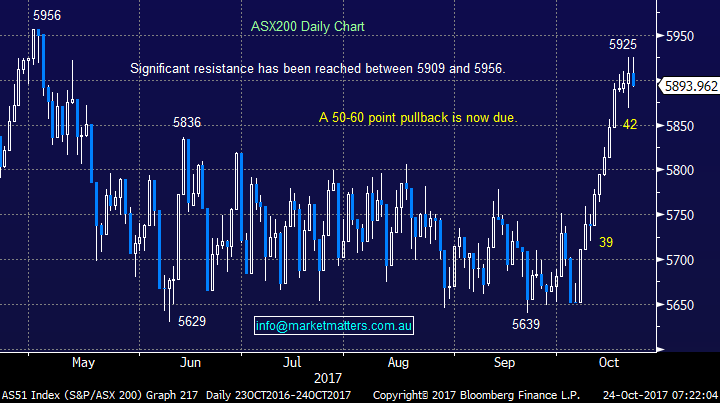
The ASX200 again retreated from 6-month highs, well over 5900, to close down 13-points breaking an 8-day winning streak with selling slowly creeping into most sectors, however the turnaround was very orderly with no apparent aggressive selling. We now believe there is a very strong possibility that US stocks are commencing a ~5% correction to provide an excellent buying opportunity for yet another exciting Christmas rally. Our feeling is that local stocks will outperform most of their global counterparts if this correction does unfold and the below levels should become important over coming days / weeks:
- We should see a test of last Friday’s 5870 low in the next 24 hours which is likely to offer some initial support.
- We see a worst case scenario of a pullback to the 5825 area which we would regard as an optimum buying area.
- A break back under the psychological 5800 area would negate our current bullish outlook for stocks into 2018.
Following our realized profit of ~9% from Santos (STO) yesterday the MM Growth Portfolio is now sitting on a fairly hefty 20% cash position but volatility feels to be on the rise so we remain confident of finding some good buying opportunities in the days / weeks ahead – we are sitting in the market to allocate 3% of the portfolio into Oz Minerals (OZL) under $8.25.
*Watch for further alerts*
ASX200 Daily Chart
Stock markets
Over recent decades there have been a number of global incidents when central banks / governments have come to the assistance of stock markets in various ways – the consistent theme has been to jump on board immediately for the ride, its likely to be profitable! Obviously the biggest example here has been the coordinated central bank buying of bonds through quantitative easing which puts downward pressure on interest rates, however there are other examples, such as the “cash for clunkers” scheme in the US which helped to stimulate the economy / support the car industry after the GFC. Property on the other hand, has not received as much specific assistance however the impact of interest rates has clearly been obvious for all to see. Right now, we must remain very mindful that economic stimulation which has propelled global asset prices higher since the GFC is coming towards an end.
Considering that on a global scale we have seen well over $US12 trillion dollars of money printed, almost $US10 trillion of negatively yielding global bonds issued and 654 interest rate cuts to get economies to where they are today. Does it feel that strong yet?
Australian Stocks
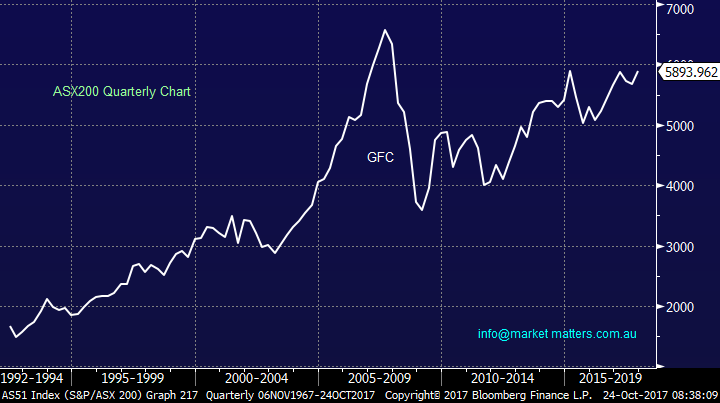
The RBA controls the Australian economy as best it can with interest rates which clearly has a significant impact on the share market. The current record low 1.5% RBA cash rate has helped fuel a stock market recovery and a property price explosion. Australians embrace property far more than stocks, especially when we compare ourselves to the likes of America. Hence it's within property that the RBA / Government is concerned about a bubble and are slowly pushing banks to toughen lending which is slowly putting the brakes on housing. Clearly, they are trying to avoid another bubble which then has the distinct chance of bursting. That would create an ‘uncontrollable’ situation for the RBA and other regulators and would likely lead to a recession. The clear takeout is that when the RBA slowly raises interest rates, its likely to be very harmful to parts of our market e.g. the “yield play” stocks.
ASX200 Quarterly Chart
US stocks
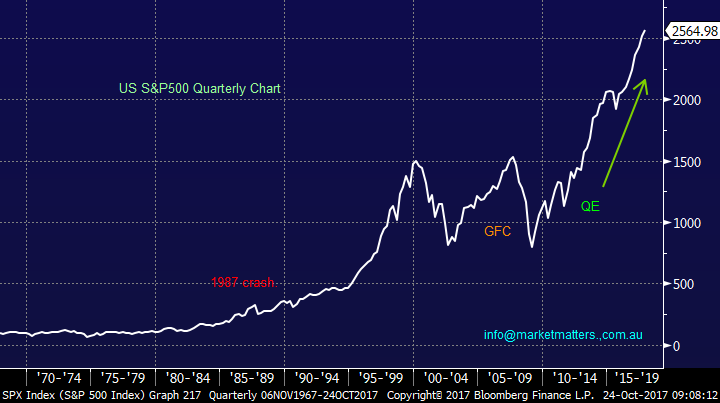
The US has adopted QE as a further step over and above aggressive cuts to interest rates. As means of an explanation, QE is an unconventional form of monetary policy where a Central Bank creates new money electronically to buy financial assets, to in effect crunch interest rates, stimulate the economy and lift asset prices. The Fed launched QE1 on the 26th November 2008 and the Dow added +3.53% that day. That program saw their biggest ‘bang for buck’ and the impact slowly reduced as other programs were rolled out. It has subsequently taken to QE4 to get the traction that the Fed wanted however the US economy is now looking strong and healthy. That said, as QE is being reduced a reasonable pullback in stock prices is fairly easy to comprehend..
US S&P500 Quarterly Chart
Japanese stocks
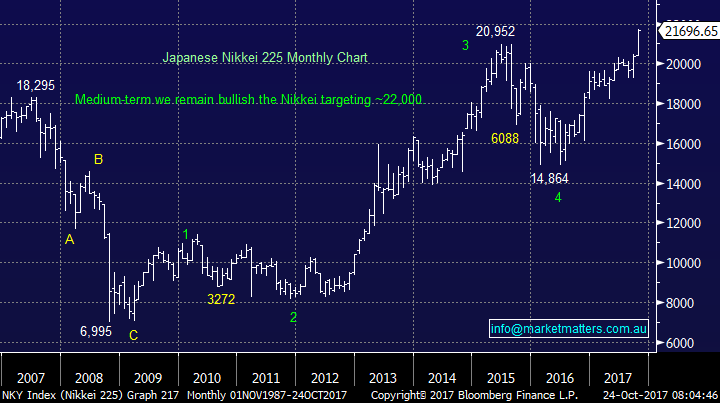
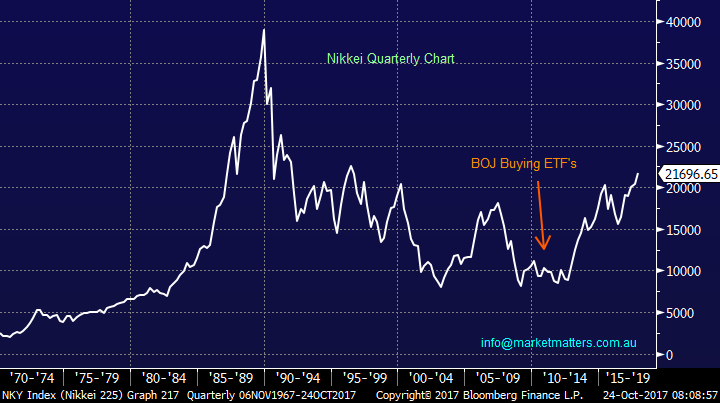
The Bank of Japan (BoJ) actually props up their equity market by investing in ETF’s although they have reduced their purchases significantly this month as the market has rallied on its own courtesy of a weakening yen against the $US. The BoJ has spent almost $US160m on ETF’s this month which is a hefty 95% below the average for 2017. Yesterday we saw the Nikkei close at its highest level since the mid-90’s strongly assisted by the BoJ who have been buying ETF’s since 2010 during which time the Nikkei has appreciated close to 150%. Some takeout’s from these numbers:
- Don’t fight the BoJ, while they remain strong buyers of pullbacks in the Nikkei.
- If the BoJ disappear we may see “good and bad news” met with selling after the last 8-years gains.
- Next time the BoJ announce changes to their stimulus go with it either way – they are patient and will probably continue for years.
- When we look at the last 50-years the Nikkei remains well under its 1980’s highs i.e. crazy euphoria is always a sell.
Hence overall the BoJ wants a solid share market but interestingly the Japanese house prices were in a 15-year bear market between 1991 and 2005, and essentially received no support as the fundamentals were not supportive – perhaps the BoJ likes to “push” assets in the direction they both want them and believe they should be moving. Japanese residential property prices have only really started rallying this year after being down over the last 8-years i.e. not participating in the gains which stocks enjoyed.
Japanese Nikkei Monthly Chart
Japanese Nikkei Quarterly Chart
Hong Kong stocks
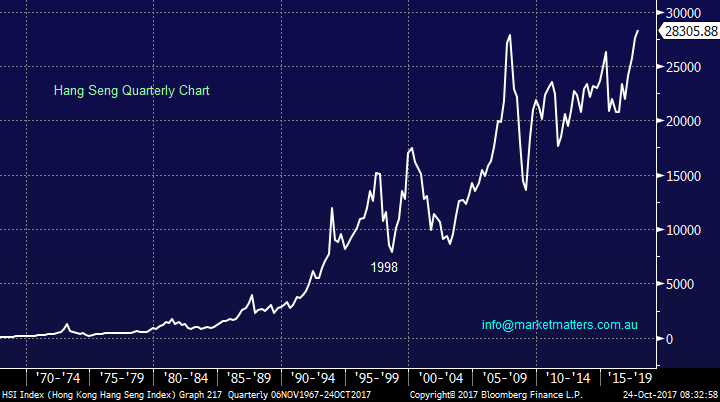
On the 14th of August 1998 the Hong Kong Government intervened in the share market which had fallen over 50% in the preceding year following the burst of a property and stock market bubble. Similar take outs to Japan:
- Don’t fight a central bank.
- When they announce a new policy go with it, as its likely to last.
- This was another example of governments / central banks wanting an orderly and preferably strong market.
Hang Seng Quarterly Chart
European stocks
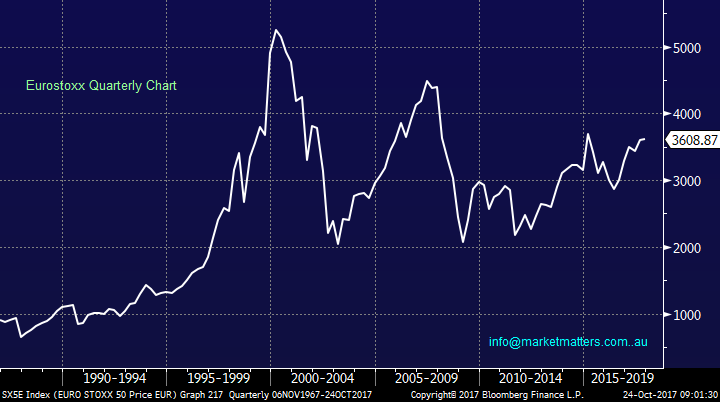
The ECB has been pouring trillions into asset purchases to stimulate the European economies and avoid deflation. However recently the ECB have paved the way to taper this stimulus after leaving interest rates on hold. If it’s taken such drastic measures to get European assets / stocks off the ground, but not surging like the US, what will happen when the tap is turned off? Do European economies have enough organic resilience to handle it?
Eurostoxx Quarterly Chart
Global Markets today
US Stocks
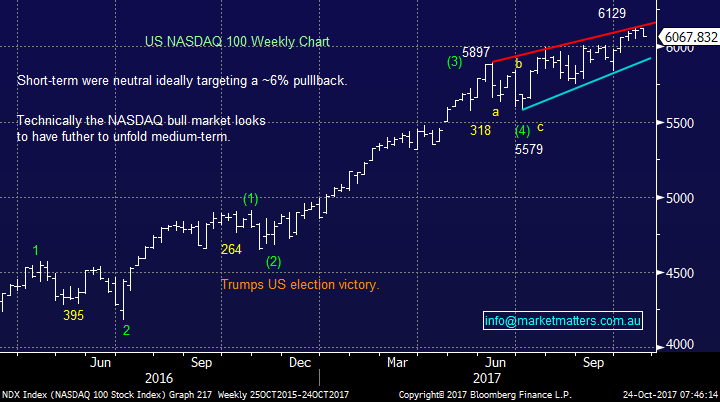
Last night the broad based S&P500 again closed down 0.2% and remains close its to all-time high, but we feel importantly, the tech NASDAQ which often leads the US indices fell 0.67% and now looks poised to correct over 6%.
There is no change to our short-term outlook for US stocks, ideally we are targeting / need a ~5% correction before the risk / reward will again favour buying this market.
US NASDAQ Weekly Chart
European Stocks
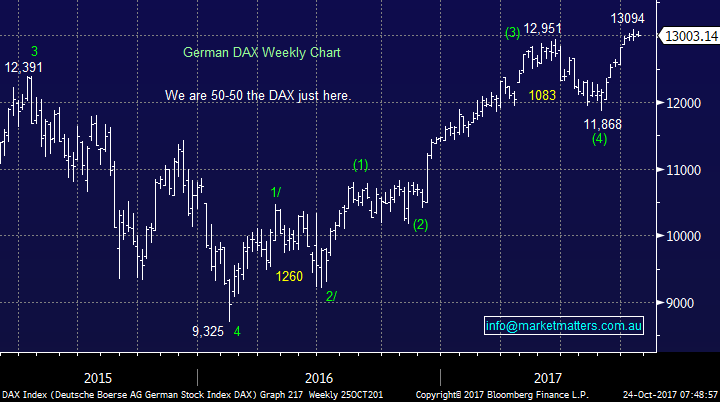
Yet again no change, European stocks have now made the fresh highs as anticipated but we would not be surprised to see this rally fail and another pullback towards 12,000 unfold for the German DAX.
German DAX Weekly Chart
Conclusion (s)
Stocks look close to a small correction but this remains likely to be another good buying opportunity, although perhaps the last one for a while.
When central banks end their QE / economic stimulus we have a clear reason for a decent stock market correction.
Overnight Market Matters Wrap
· The US equity markets eased back from its record levels overnight ahead of a slew of earnings reports due this week. Among the bigger moves, Industrial conglomerate GE fell 6% after announcing a major revamp at the weekend which raised concerns of a dividend cut.
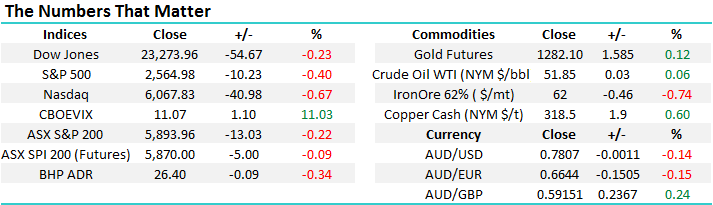
· There was little direction from the commodity suite with gold and copper slightly firmer, while Iron Ore was the laggard. BHP is expected to underperform the broader market, after closing down an equivalent of -0.34% in the US to Australia’s previous close of $26.40.
· The December SPI Futures is indicating the ASX 200 to open marginally lower this morning around the 5890 level.
Disclosure
Market Matters may hold stocks mentioned in this report. Subscribers can view a full list of holdings on the website by clicking here. Positions are updated each Friday, or after the session when positions are traded.
Disclaimer
All figures contained from sources believed to be accurate. Market Matters does not make any representation of warranty as to the accuracy of the figures and disclaims any liability resulting from any inaccuracy. Prices as at 24/10/2017. 8.00AM.
Reports and other documents published on this website and email (‘Reports’) are authored by Market Matters and the reports represent the views of Market Matters. The MarketMatters Report is based on technical analysis of companies, commodities and the market in general. Technical analysis focuses on interpreting charts and other data to determine what the market sentiment about a particular financial product is, or will be. Unlike fundamental analysis, it does not involve a detailed review of the company’s financial position.
The Reports contain general, as opposed to personal, advice. That means they are prepared for multiple distributions without consideration of your investment objectives, financial situation and needs (‘Personal Circumstances’). Accordingly, any advice given is not a recommendation that a particular course of action is suitable for you and the advice is therefore not to be acted on as investment advice. You must assess whether or not any advice is appropriate for your Personal Circumstances before making any investment decisions. You can either make this assessment yourself, or if you require a personal recommendation, you can seek the assistance of a financial advisor. Market Matters or its author(s) accepts no responsibility for any losses or damages resulting from decisions made from or because of information within this publication. Investing and trading in financial products are always risky, so you should do your own research before buying or selling a financial product.
The Reports are published by Market Matters in good faith based on the facts known to it at the time of their preparation and do not purport to contain all relevant information with respect to the financial products to which they relate. Although the Reports are based on information obtained from sources believed to be reliable, Market Matters does not make any representation or warranty that they are accurate, complete or up to date and Market Matters accepts no obligation to correct or update the information or opinions in the Reports.
If you rely on a Report, you do so at your own risk. Any projections are estimates only and may not be realised in the future. Except to the extent that liability under any law cannot be excluded, Market Matters disclaims liability for all loss or damage arising as a result of any opinion, advice, recommendation, representation or information expressly or impliedly published in or in relation to this report notwithstanding any error or omission including negligence.
To unsubscribe. Click Here


