Bitcoin maybe giving gold a helping hand
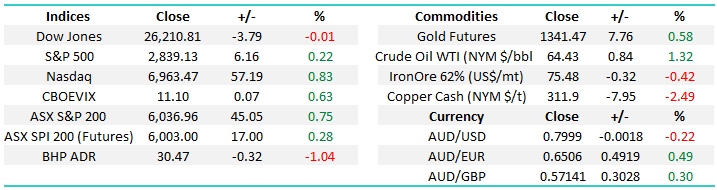
The ASX200 surged 45-points yesterday and it feels like yesterday’s thought that the low for January was in place may prove correct – seasonality again looks set to be a great guide to market swings / timing but will we get a fresh low in early February for a great buying opportunity? All sectors closed positive with some bargain hunting in the banks providing the backbone to our advance. Equities were very quiet overnight and major moves locally look set to be determined today by some standout moves in the metals overnight which we will look at in today’s note.
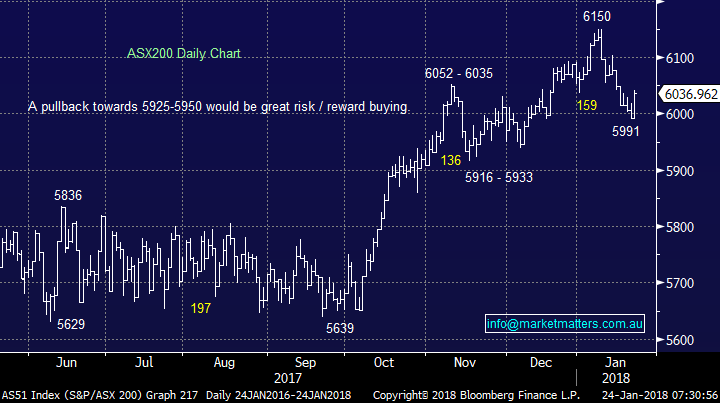
Ideally, we’re looking to invest our 20.5% cash position in the Growth Portfolio back into the market between 5925 and 5950 area for the ASX200 but individual opportunities look likely to arise in some stocks / sector beforehand. We took some nice profits in Harvey Norman (HVN) yesterday given the stock is no longer a screaming bargain, although on 12.5x it’s hardly expensive. The Income Portfolio is now holding 11% in cash. We’ll discuss our stance around this positioning in more detail in today’ Income Report.
ASX200 Daily Chart
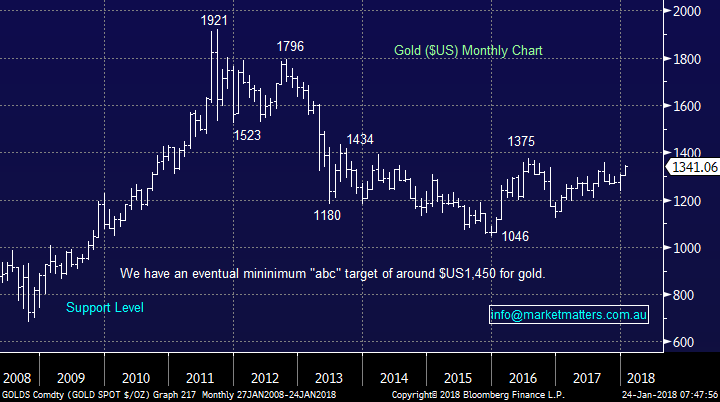
Gold $US1341/oz
Overnight gold rallied over 0.5% to be less than $US20/oz away from fresh 8-month highs. Investors have poured dollars into gold ETF’s taking investments to the highest level in 4-years following the precious metals best year since 2010. Interestingly, gold is not being sold as US stocks surge but its rally certainly has been assisted by a falling $US and US Treasuries (bonds). Gold even rallied after the US shutdown ended as investors are looking further ahead, potentially to the debt ceiling talks in a few months’ time.
Some investors are looking to gold as an inflation hedge, simply there are a number of reasons people buy gold but it’s obviously not for yield. However investors should be aware that rising interest rates is not necessarily bad for gold, just like stocks. e.g. In 1977 US 10-year Treasuries were yielding sub 7% and gold was at $US135/oz…….move on 3-years and Treasuries were paying almost 11% and gold was peaking at $US850/oz.
Controlled / steady increases in interest rates is usually ok for asset prices, its only when they go too far / too fast that we often get the “straw that broke the camel’s back” style experience.
Gold ($US) Monthly Chart
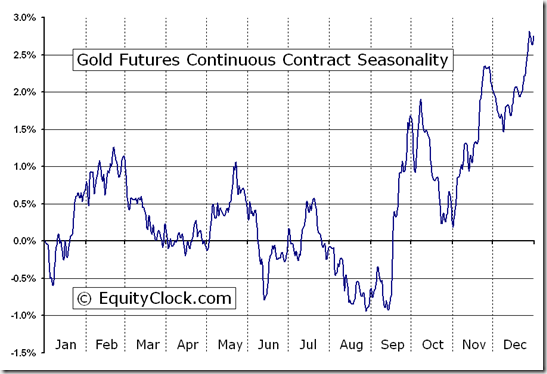
Subscribers should remember the gold seasonality chart that MM showed recently, it is simply common for gold to be strong into late February.
Gold Seasonality Chart
We should not get too carried away with bitcoins degree of press coverage, its estimated that less than 2% of Americans have invested / punted in bitcoin compared to over 55% that have at least dabbled in shares.
However the question of where to put $$, especially in this stage of the economic cycle is a tough one:
- Interest rates appear to have bottomed on a global basis hence the massive bond market is set to continue falling.
- Stocks usually do ok when interest rates start rising / bonds fall as money flows from bonds to stocks but fund managers are becoming increasingly concerned around valuations.
- Hence gold has a place for a small % of the flow out of bonds and due to the relative market sizes its likely to have a positive impact as we are witnessing.
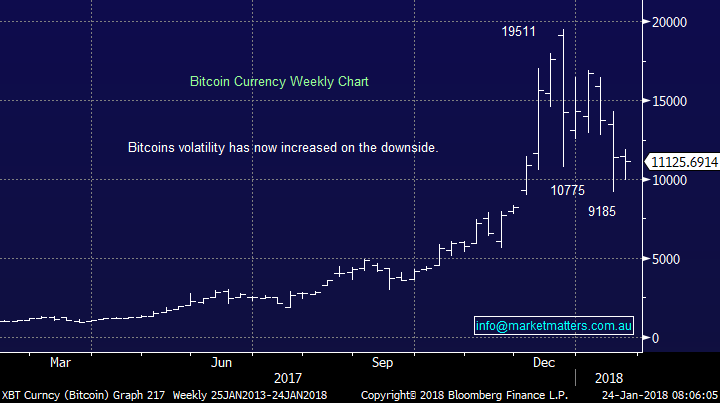
- Bitcoin is fortunate to be mentioned in the same breathe as these other assets but the press is mentioning traders have been selling bitcoin to buy gold in an attempt to satisfy their “fix” for action!
Importantly at this stage we can see reasons for gold to enjoy strong periods during 2018/9 and if the yellow metal falls / drifts lower into September we will be looking for opportunities – again refer to seasonality chart.
Bitcoin currency weekly Chart
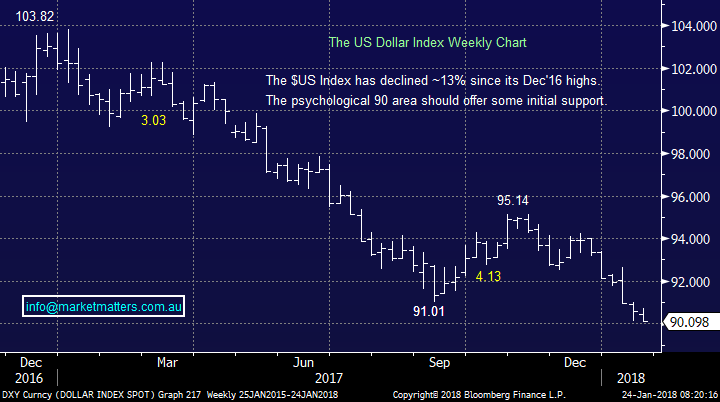
We maintain our target of around 88 for the $US Index and this may potentially coincide with a Q1 high for gold, importantly considering the 13% decline since late 2016 it’s not far to go. If this plays out as we are expecting, we will likely BUY the $US via an ASX listed ETF.
The $US Dollar Index Weekly Chart
Gold ETF’s rallied 1.6% last night to fresh 3-month highs overnight so we can expect some “love” into the local gold sector today. Over the next 1-2 years we remain mildly bullish gold overall but the next 6-months is less certain - the market is more likely to chop around in a fairly tight range as the $US currency bottoms.
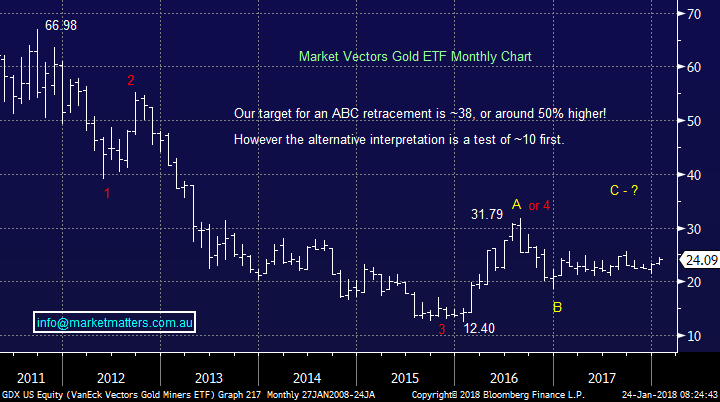
The increased investment into gold ETF’s leaves clear room for a decent correction before we see a strong rally.
Market vectors gold ETF Monthly Chart
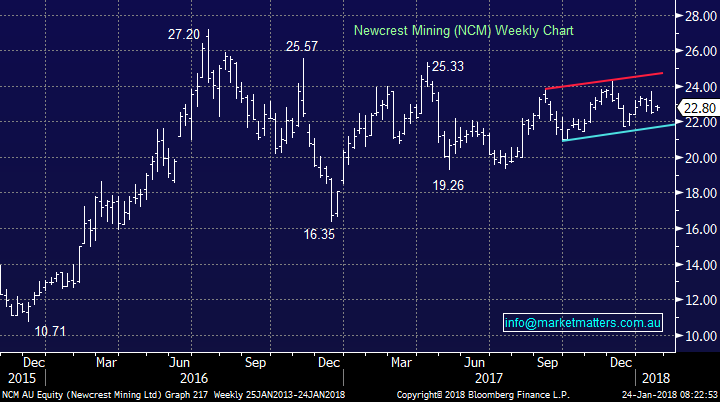
We have a 7.5% exposure to the sector via NCM which has proven frustrating with other smaller stocks within the local sector outperforming their larger cousin.
Our ideal exit of NCM remains around $25
Newcrest Mining (NCM) Weekly Chart
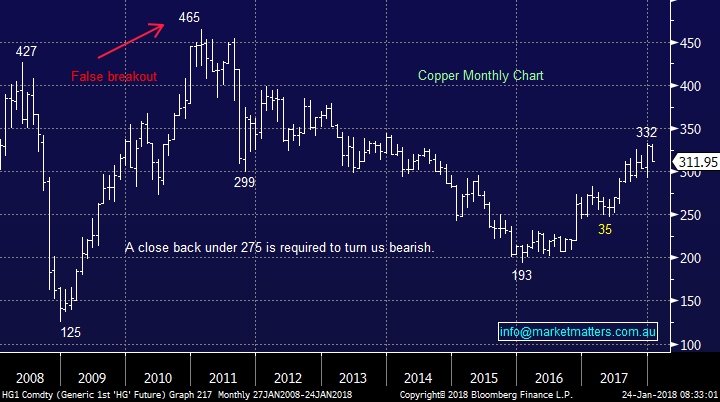
Copper $US311/lb
Overnight copper was smacked -2.5% to fresh 4-week lows. We remain optimistic that copper can retest its December lows, around 5% lower which should provide some excellent opportunity to increase our exposure to the resources sector. We will of course update subscribers if any stocks we like approach our ideal entry levels.
Copper Monthly Chart
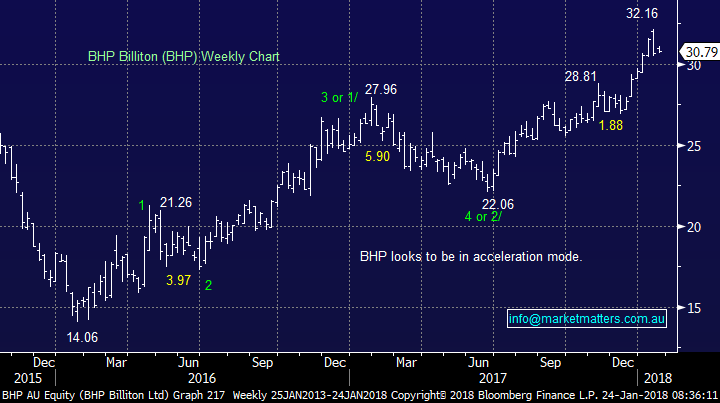
BHP is looking to open down around 1% this morning to $30.50 as initial sector weakness experienced last week looks set to continue for now.
MM will consider adding another 2% to our BHP holding around $30.30 in the next 2-days i.e. following our plan to accumulate into weakness.
BHP Billiton (BHP) Weekly Chart
Conclusion
At this stage MM remains keen to accumulate industrial resources into weakness and sell gold (NCM) into strength.
Global markets
US Stocks
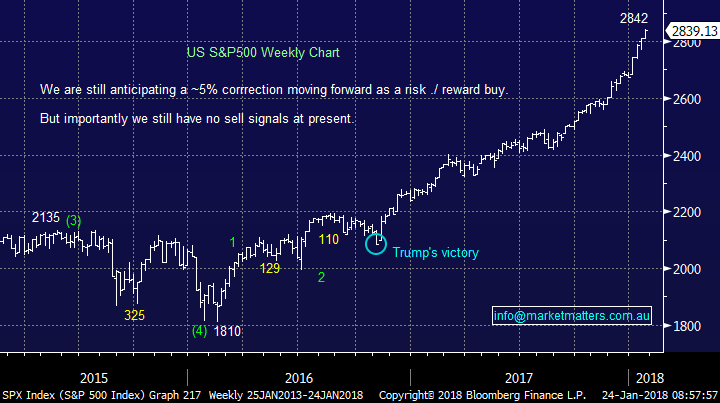
The S&P500 has continued its record breaking advance and with no sell signals at present investors should be long, or out.
US S&P500 Weekly Chart
European Stocks
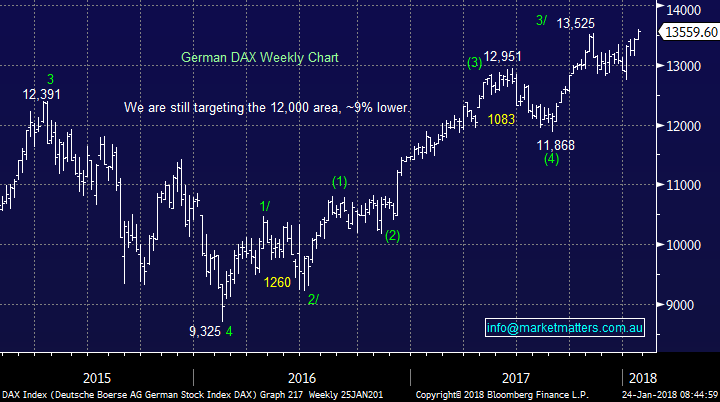
European stocks look set to make fresh recent highs the big question is will they fail, or kick on. At this stage we are sitting on the fail side but only just!
German DAX Weekly Chart
Overnight Market Matters Wrap
· The US equity markets ended its session little changed as corporate earnings continue to trickle out. The Nasdaq 100 outperformed, much thanks to Netflix (NFLX.US) and its solid quarterly earnings.
· The Aussie Battler $AUD continues its attempt to stay above the US80c handle, while Dr. Copper (tends to be an indicator of the overall health of the global economy)lost 2.49% overnight.
· Iron ore also lost some ground, with BHP expected to underperform the broader market after ending its US session down an equivalent of 1.04% to $30.47.
· The March SPI Futures is indicating the ASX 200 to open 23 points higher towards the 6060 level this morning, with January equity options expiry this afternoon.
Disclosure
Market Matters may hold stocks mentioned in this report. Subscribers can view a full list of holdings on the website by clicking here. Positions are updated each Friday, or after the session when positions are traded.
Disclaimer
All figures contained from sources believed to be accurate. Market Matters does not make any representation of warranty as to the accuracy of the figures and disclaims any liability resulting from any inaccuracy. Prices as at 24/01/2018. 8.00AM.
Reports and other documents published on this website and email (‘Reports’) are authored by Market Matters and the reports represent the views of Market Matters. The MarketMatters Report is based on technical analysis of companies, commodities and the market in general. Technical analysis focuses on interpreting charts and other data to determine what the market sentiment about a particular financial product is, or will be. Unlike fundamental analysis, it does not involve a detailed review of the company’s financial position.
The Reports contain general, as opposed to personal, advice. That means they are prepared for multiple distributions without consideration of your investment objectives, financial situation and needs (‘Personal Circumstances’). Accordingly, any advice given is not a recommendation that a particular course of action is suitable for you and the advice is therefore not to be acted on as investment advice. You must assess whether or not any advice is appropriate for your Personal Circumstances before making any investment decisions. You can either make this assessment yourself, or if you require a personal recommendation, you can seek the assistance of a financial advisor. Market Matters or its author(s) accepts no responsibility for any losses or damages resulting from decisions made from or because of information within this publication. Investing and trading in financial products are always risky, so you should do your own research before buying or selling a financial product.
The Reports are published by Market Matters in good faith based on the facts known to it at the time of their preparation and do not purport to contain all relevant information with respect to the financial products to which they relate. Although the Reports are based on information obtained from sources believed to be reliable, Market Matters does not make any representation or warranty that they are accurate, complete or up to date and Market Matters accepts no obligation to correct or update the information or opinions in the Reports.
If you rely on a Report, you do so at your own risk. Any projections are estimates only and may not be realised in the future. Except to the extent that liability under any law cannot be excluded, Market Matters disclaims liability for all loss or damage arising as a result of any opinion, advice, recommendation, representation or information expressly or impliedly published in or in relation to this report notwithstanding any error or omission including negligence.
To unsubscribe. Click Here


