Are We Comfortable With Our Iron Ore Exposure?
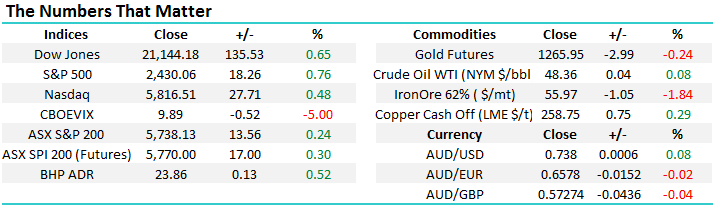
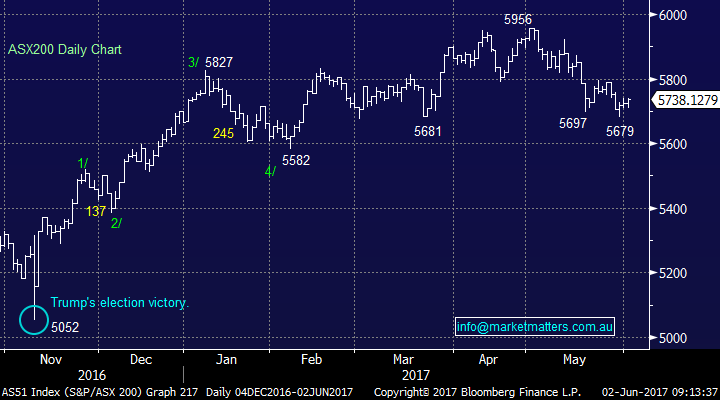
Over the last-3 days, the ASX200 has regained some internal strength, actually managing a small rally in the face of some minor adversity e.g. US stocks drifting lower and iron ore testing 12-month lows. Technically we can now see the local market challenge the psychological 5800 area over the next few days, aided by last night’s solid rally by global indices before seasonal weakness is again likely to take hold.
The stand out sector over the last few months has been the local “yield play” stocks, primarily at the expense of banks and growth / expansionary stories. For example since February, we have seen Transurban (TCL) rally +22% and Sydney Airports (SYD) +30%. We called both of these stocks to bounce at the start of 2017, but certainly not to the degree they actually have. Conversely, over the same timeframe we have seen Commonwealth Bank (CBA) fall -3.3% and BHP Billiton (BHP) -12.8%.
ASX200 Daily Chart
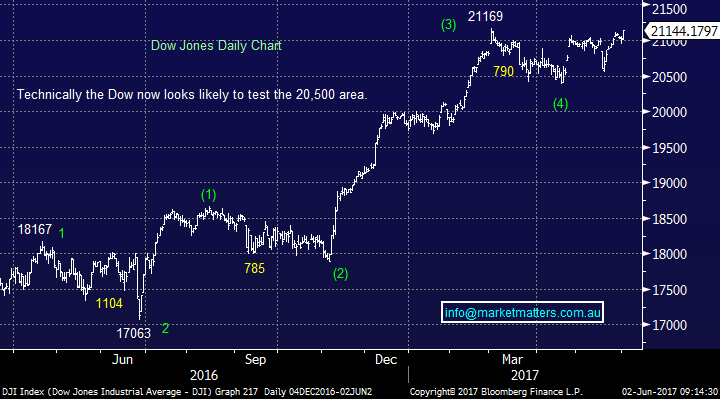
US stocks again rallied strongly last night, with the broad based indices making fresh all-time highs. We still see a further 2% upside for the Dow, before some consolidation is due. This is yet another example of a market not falling when too many people are predicting it. We cannot help but wonder if Australian property prices will follow suit with so many “experts” forecasting their demise.
US Dow Jones Daily Chart
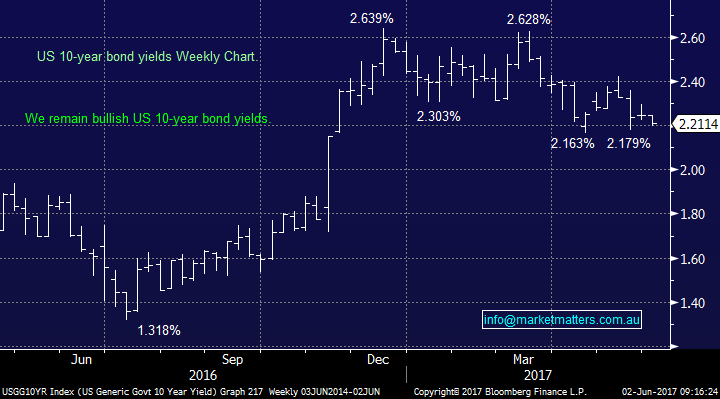
Investors have lost some confidence in a rapid global economic recovery as President Trump appears to be juggling a number of balls, as opposed to focusing specifically on the areas of growth. One of the best illustrations of the markets deteriorating optimism is the US 10-year bond yield, which has drifted back towards 2.2% after powering from 1.3% to over 2.6% in just a few months.
However at this point in time, we continue to believe the pullback in bond yields simply represents a mild correction after over doubling very quickly. If this view proves correct, the likelihood is we will see a reversal in performance from the “yield play” stocks to the banks and growth stocks.
US 10-year bond yields Weekly Chart
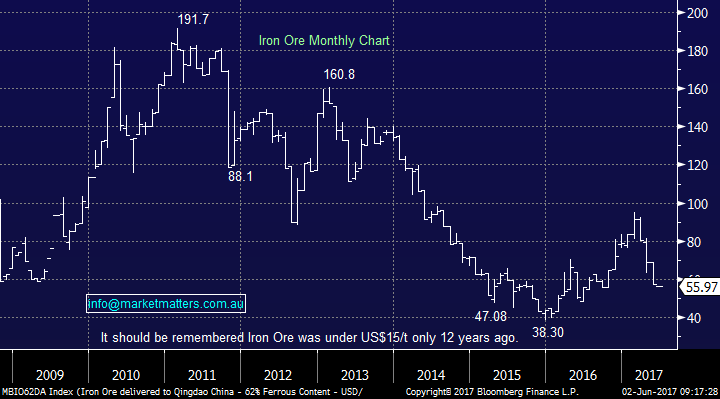
Today we are going to briefly look at 3 iron ore stocks, who sit in the cross hairs of a declining Iron Ore price. For these stocks to rally, it’s highly likely we need some renewed confidence in the global economy and of course, China. Iron ore futures have plummeted 40% in 2017 and for our current bullish stance to prove correct, we are likely to need a bounce from the current $US55/t area.
Iron Ore Monthly Chart
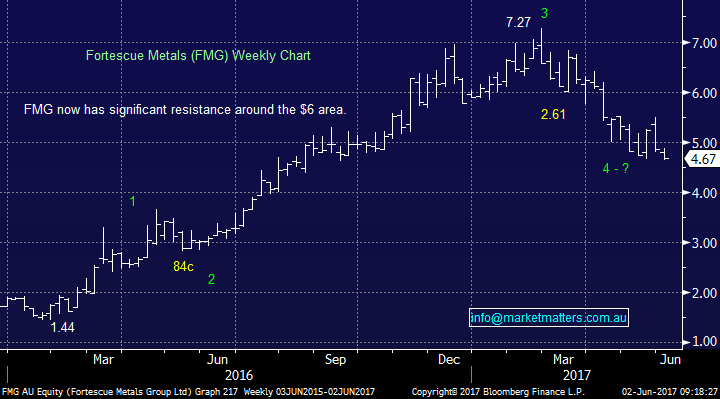
1 Fortescue Metals (FMG) $4.67 – not $3.67 as yesterday’s afternoon report suggested!
We have enjoyed a number of forays into FMG over the years with yesterday’s purchase around $4.66, arguably one of the most aggressive – we’ve almost caught the falling knife, which can be a dangerous game. However, we had planned this entry for over a week and we remain confident with our $5.50 target area - technically a close over $4.80 will give us a large degree of confidence.
We like the fact that FMG had already bounced 18% once (to $5.50) after its mid-May lows, implying to us perceived value in the stock by market players once iron ore finally stops falling, let alone a rally!
Fortescue Metals (FMG) Weekly Chart
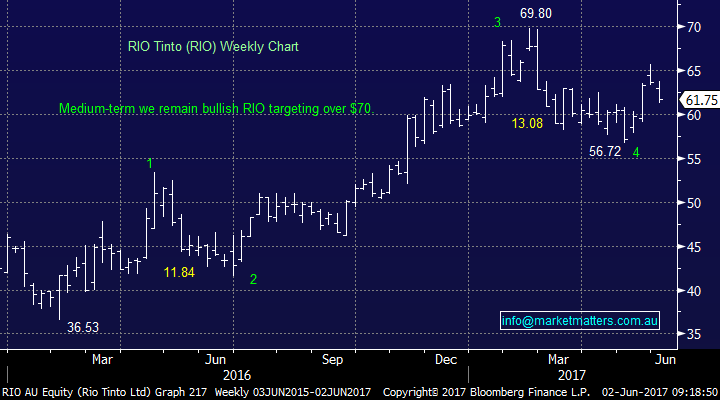
2 RIO Tinto (RIO) $61.75.
No change we remain bullish RIO targeting over $70, we get a degree of comfort that RIO has rallied strongly from its early May lows. The stock is currently valued on an undemanding 9.8x 2017 earnings, while paying an est. 3.6% fully franked yield.
Similar to FMG, if / when iron ore stops falling, RIO looks poised to continue its recovery.
RIO Tinto (RIO) Weekly Chart
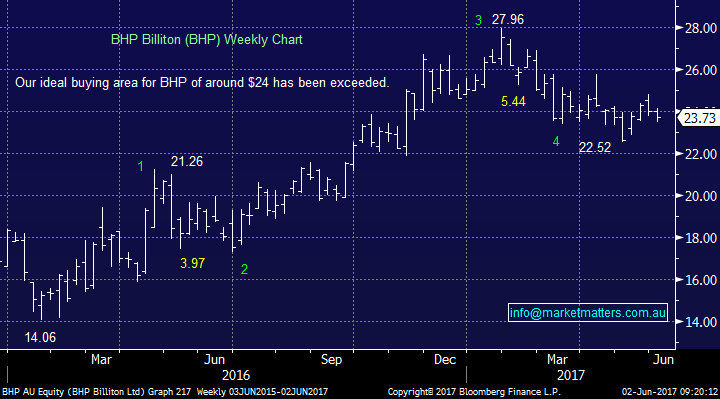
3 BHP Billiton (BHP) $23.73.
BHP has had the proverbial sink thrown at it over recent months, with both iron ore and crude oil prices falling substantially. However, we now believe the stock is being valued from a “glass half empty” perspective which by definition, creates a large degree of potential upside. The stock is currently valued on an undemanding 12.2x 2017 earnings while paying an est. 3% fully franked yield.
Similar to FMG and RIO, if / when iron ore stops falling, BHP looks poised to continue its recovery.
BHP Billiton (BHP) Weekly Chart
Conclusion (s)
We undoubtedly have our largest ever exposure to both resource stocks and iron ore, just when they are a touch on the nose i.e. BHP, FMG and RIO. We are currently comfortable with this exposure, happy to go against the crowd, but will remain prudent from a risk / reward perspective incase the iron ore weakness continues to unfold – FMG is likely to be the first stock we sell both on a rally, or a fall if we are wrong.
Overnight Market Matters Wrap
· The US equity markets rallied overnight, after positive economic data - Private payrolls increased by 253,000 jobs last month, ahead of expectations of 185,000.
· Risk was certainly back on, ignoring China’s weaker than expected manufacturing PMI data yesterday, with both the financials and major miners to outperform the broader market today – e.g. BHP in the US closed up and equivalent of 0.53% higher from Australia’s previous close.
· The June SPI Futures is indicating the ASX 200 to open 30 points higher, towards the 5,770 area this morning.
Disclosure
Market Matters may hold stocks mentioned in this report. Subscribers can view a full list of holdings on the website by clicking here. Positions are updated each Friday.
Disclaimer
All figures contained from sources believed to be accurate. Market Matters does not make any representation of warranty as to the accuracy of the figures and disclaims any liability resulting from any inaccuracy. Prices as at 02/06/2017. 8.30AM.
Reports and other documents published on this website and email (‘Reports’) are authored by Market Matters and the reports represent the views of Market Matters. The MarketMatters Report is based on technical analysis of companies, commodities and the market in general. Technical analysis focuses on interpreting charts and other data to determine what the market sentiment about a particular financial product is, or will be. Unlike fundamental analysis, it does not involve a detailed review of the company’s financial position.
The Reports contain general, as opposed to personal, advice. That means they are prepared for multiple distributions without consideration of your investment objectives, financial situation and needs (‘Personal Circumstances’). Accordingly, any advice given is not a recommendation that a particular course of action is suitable for you and the advice is therefore not to be acted on as investment advice. You must assess whether or not any advice is appropriate for your Personal Circumstances before making any investment decisions. You can either make this assessment yourself, or if you require a personal recommendation, you can seek the assistance of a financial advisor. Market Matters or its author(s) accepts no responsibility for any losses or damages resulting from decisions made from or because of information within this publication. Investing and trading in financial products are always risky, so you should do your own research before buying or selling a financial product.
The Reports are published by Market Matters in good faith based on the facts known to it at the time of their preparation and do not purport to contain all relevant information with respect to the financial products to which they relate. Although the Reports are based on information obtained from sources believed to be reliable, Market Matters does not make any representation or warranty that they are accurate, complete or up to date and Market Matters accepts no obligation to correct or update the information or opinions in the Reports.
If you rely on a Report, you do so at your own risk. Any projections are estimates only and may not be realised in the future. Except to the extent that liability under any law cannot be excluded, Market Matters disclaims liability for all loss or damage arising as a result of any opinion, advice, recommendation, representation or information expressly or impliedly published in or in relation to this report notwithstanding any error or omission including negligence.
To unsubscribe. Click Here


