Are seasonal statistics in rhythm & do they make sense?
We often quote the seasonal statistics when we are explaining our short-term view on the markets. The current period is definitely no exception. As you know October is usually the strongest month for the banking sector which makes sense considering that ANZ, NAB, and Westpac pay extremely attractive fully franked dividends in November, the 3-statistics that matter is as below:
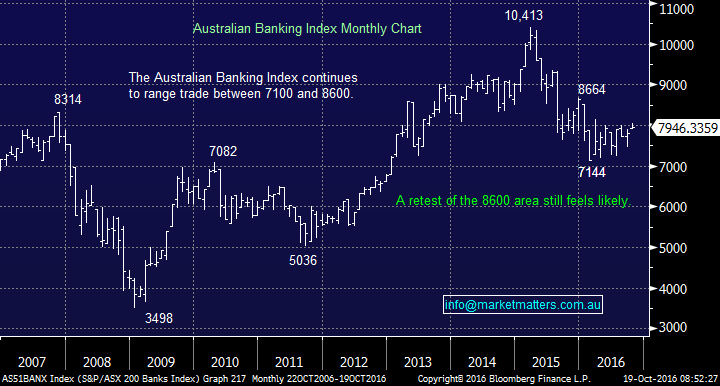
1. Since the year 2000, the Banking Index usually rallies ~4% in October, almost double the rest of the market sectors.
2. CBA has gained on average 6.6% in October over the last 5-years.
3. 12 of the last 16 Octobers have been positive for the Australian Banking sector.
So far this October the banking sector is +1.7% while CBA is up 3% hence implying we have seen around half of their likely gains with 9-trading days remaining. The current banking performance is especially impressive if we consider that over the same period the ASX200 is down 0.46%.
Australian Banking Sector Monthly Chart
Last night the US Banking Index rallied over 1.1% after some solid company reports from the sector, implying continued strength from our local banks today. Technically the US banks look poised for a breakout, with over 10% gains targeted.
US S&P500 Banking Index Monthly Chart

US investors are currently feeling like a "cat on a hot tin roof" jumping in all directions, one day they are scared of a looming bond-market crash, the next China or Europe, there is always something negative crossing the news wires. Potentially it sounds like the local property doomsday merchants BUT as we know Sydney property keeps climbing the wall of worry.
US fund managers have increased their cash holdings from 5.5% to 5.8% this month but the S&P500 is down only 1.3% and remains only 2.4% below its all-time high. Cash levels are back to the levels they were just after BREXIT - the last time they were higher was all the way back in late 2001 before 9/11. It's hard to imagine equities falling too far with so much cash on the sidelines unless we get a "black swan" event. Historically high cash levels have been a reverse indicator as we witnessed after both BREXIT and in 2002 when equities rallied.
Generally cash levels over 5% is a contrarian buy signal and below 3.5% a sell signal.
Imagine if bonds hold together (for now), inflation keeps slowly ticking higher, the Fed raises rates slowly and corporate American keeps beating the pessimistic earnings estimates – as we’ve seen this week.....the very high cash levels could easily produce the 6-8% advance for US stocks that we are targeting for a "blow-off" top.
The US statistics are interesting over coming months:
1. In a tight US election race stocks usually meander sideways and then rally ~4% in November whoever wins - probably needs a Hillary Clinton victory for this result.
2. Since the early 1970's the average return for the S&P500 in November is +1.5% and December 1.7%. When we combine these two statistics it is relatively easy to mount a contrarian bullish case for a ~4-5% gains into this Christmas for US stocks especially when we remember the Fed wants stocks firm.
US S&P500 Index Monthly Chart

So while we remain comfortable with our overweight banking position for the coming weeks, the obvious question is what are we planning to do next? November is usually the weakest month for our banking sector as the stocks fall more than their dividend amounts. The statistics that we are watching moving forward into Christmas:
1. Banks usually fall ~2.5% in November.
2. The Healthcare stocks usually rally over 4.5% from the end of October for the next 2 months. We only have exposure to CSL Ltd in the Healthcare space hence not surprisingly this sector will be explored closely over coming days.
US S&P500 Healthcare Sector Quarterly Chart

Summary
- We envisage selling another one of our bank holdings in the coming 2-weeks
- We are looking for opportunities within the healthcare sector
- *Watch for alerts*
Overnight Market Matters Wrap ·
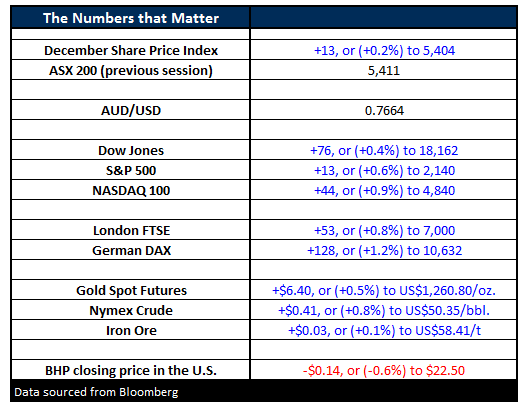
- The US markets had a better night on the back of stronger quarterly reports. The Dow at its highest was up just over 139 points but finished the day up 76 points (+0.4%) to 18,162. The S&P500 was stronger in its breadth, rising 13 points (+0.6%) to 2,140.
- Oil prices rose on a US$ weakening and expectations of OPEC cutting production, although there is an expectation of higher crude stockpiles. Crude finished up 41c (+0.8) to US$50.35/bbl. ·
- Gold managed the second day in the black, although expectations of it moving too much higher appear to be limited given the fact that expectations of a December rate increase are gaining ground. Gold finished up US$6.40 (+0.5%) to US$1,260.80/oz
- The ASX 200 is expected to open up 24 points this morning, around the 5,428 level, as indicated by the December SPI Futures.
All figures contained from sources believed to be accurate. Market Matters does not make any representation of warranty as to the accuracy of the figures and disclaims any liability resulting from any inaccuracy. Prices as at 19/10/2016. 7.30AM.
Reports and other documents published on this website and email (‘Reports’) are authored by Market Matters and the reports represent the views of Market Matters. The MarketMatters Report is based on technical analysis of companies, commodities and the market in general. Technical analysis focuses on interpreting charts and other data to determine what the market sentiment about a particular financial product is, or will be. Unlike fundamental analysis, it does not involve a detailed review of the company’s financial position.
The Reports contain general, as opposed to personal, advice. That means they are prepared for multiple distributions without consideration of your investment objectives, financial situation and needs (‘Personal Circumstances’). Accordingly, any advice given is not a recommendation that a particular course of action is suitable for you and the advice is therefore not to be acted on as investment advice. You must assess whether or not any advice is appropriate for your Personal Circumstances before making any investment decisions. You can either make this assessment yourself, or if you require a personal recommendation, you can seek the assistance of a financial advisor. Market Matters or its author(s) accepts no responsibility for any losses or damages resulting from decisions made from or because of information within this publication. Investing and trading in financial products are always risky, so you should do your own research before buying or selling a financial product.
The Reports are published by Market Matters in good faith based on the facts known to it at the time of their preparation and do not purport to contain all relevant information with respect to the financial products to which they relate. Although the Reports are based on information obtained from sources believed to be reliable, Market Matters does not make any representation or warranty that they are accurate, complete or up to date and Market Matters accepts no obligation to correct or update the information or opinions in the Reports.
If you rely on a Report, you do so at your own risk. Any projections are estimates only and may not be realised in the future. Except to the extent that liability under any law cannot be excluded, Market Matters disclaims liability for all loss or damage arising as a result of any opinion, advice, recommendation, representation or information expressly or impliedly published in or in relation to this report notwithstanding any error or omission including negligence.
To unsubscribe. Click Here