Are gold stocks slowly becoming attractive? (NCM, RRL, EVN)
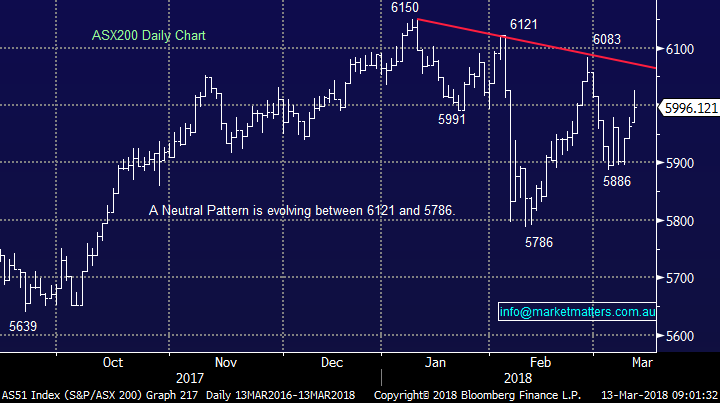
The ASX200 put in a pretty average performance yesterday only rallying 33-points / 0.55% following the Dow’s 440-point surge on Friday night. It’s easy to become frustrated with our local market when we compare it to some of our overseas equivalents, but at least we receive a higher yield than most, plus often these dividends are fully franked. This Thursday is the expiry of the extremely influential quarterly March futures contract and assuming we are correct and stocks are positioned to rally strongly into May, we would not be surprised if we have to see out this expiry before the local market can achieve some meaningful upside momentum.
The subdued advance yesterday could also be attributed to a certain degree to the following:
- The ASX200 can often “pick” overseas markets very well which is easy to comprehend a along with New Zealand, we are the first major stock markets to open after a weekend. Fund managers who intend to sell say the US or European markets can start with us in an attempt to add some cream to the cake on their performance. In this case we drifted 30-points from our highs and subsequently, US stocks struggled to advance overnight with the broad S&P500 closing down -0.13%.
- Labor’s announcement of a cash grab to the tune of $59bn from shareholders who have been enjoying cash refunds for excess dividend imputation credits. Certainly a more popular move than changing negative gearing, even though a number of retirees are in the crosshairs, they are more likely to be liberal voters - unfortunately a clear net negative for local stocks.
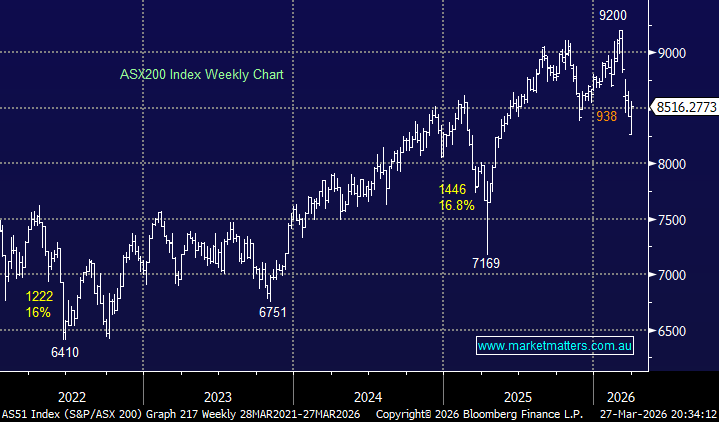
The ASX200 is set to open basically unchanged this morning and we would not be surprised to see the psychological 6000 area become a magnet for our market into Thursday’s futures expiry. MM remains bullish the ASX200 through March and April, targeting the 6250 area - now only ~4% higher.
Today’s report is going to focus on the gold sector something we have not discussed for a while but certainly came under pressure yesterday led by heavyweight Newcrest (NCM) which fell -4.59%.
ASX200 Chart
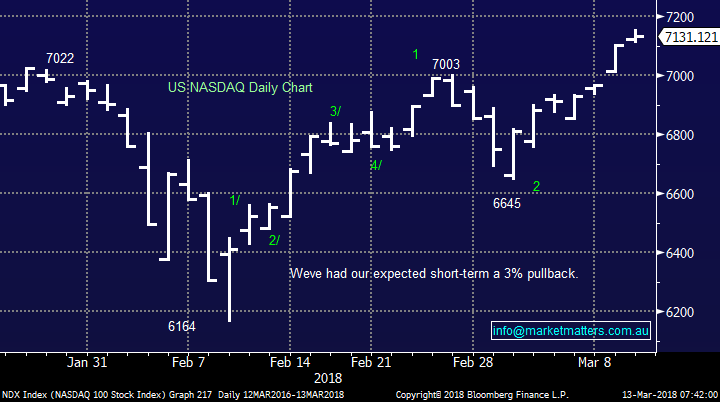
Overnight the tech leading NASDAQ index again closed at all-time highs, up +0.4%. We can see further strong gains from current levels while the 7000 level holds, excellent risk / reward and importantly an overall bullish sign for US stocks at least.
US NASDAQ Chart
Gold sector / stocks
Global gold stocks
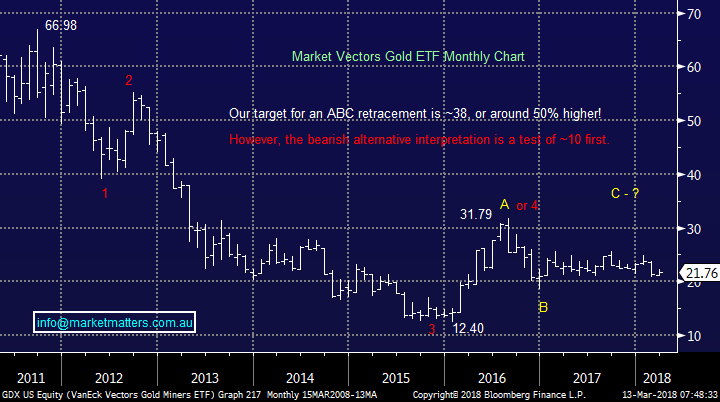
Our big picture view for the global gold sector is very 50-50, a frustrating view as we like to have strong opinions at MM!
- Either we can see a 50% plunge to fresh post GFC lows, or we can see a 50% rally back towards mid-2013 levels – both big moves.
At this point after 15-months of sideways price movement the sector is overdue a move, but on a technical basis we think it’s best to let the market tell you where it wants to go.
Market Vectors Gold ETF Chart
Seasonality of Australian gold stocks
Moving onto local gold stocks and the seasonality over the last 10-years, there are a couple of standout points:
- Be short, or out of the sector, between March and June i.e. now.
- Consistently the best time to go long / buy local gold stocks for at least a 5-10% rally is in July and December.
NB we looked at Newcrest (NCM), Regis Resources (RRL) and Evolution Mining (EVN) for these numbers.
Macro influence on Australian gold stocks
There are 2 major influences on the gold price at present assuming we get no surprise events like a North Korea blow-up.
1. Interest rates – The faster and higher global bond yields rise the less attractive gold investment becomes on a relative basis. If you’re getting say 5% p.a. on a term deposit compared to having to pay to store gold, it’s easy to see the relative appeal of cash as this 5% moves towards say 8%. We are bullish interest rates moving forward, implying gold stocks are only worth buying for quick short trades.
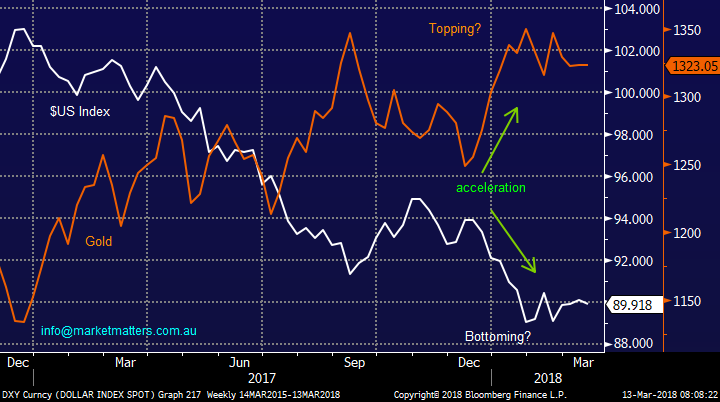
2. The $US – gold is denominated in $US i.e. last night it closed around $US1324. As the $US falls the price in $US usually rallies. The chart below shows that while the $US has declined ~14% since December 2016, the gold price has increased ~$US200/oz, or 17%. Importantly we believe that the $US is very close to a low / ~8% rally, which is bearish gold short/medium-term.
Gold v $US Chart
3 Australian gold stocks
Yesterday NCM tumbled ~5% following the announcement of a problem with its Cadia northern tailing dam embankment – unfortunately the stock has become the ‘QBE’ of our resources sector, always finding a way to disappoint.
Subscribers should remember there are 2 simple reasons in our opinion at MM to buy shares – dividends / yield and capital appreciation / share gains. As gold stocks at this point in time are not huge dividend payers, especially at the big end of town, we regard the gold sector as very much a trader’s / active investor’s domain.
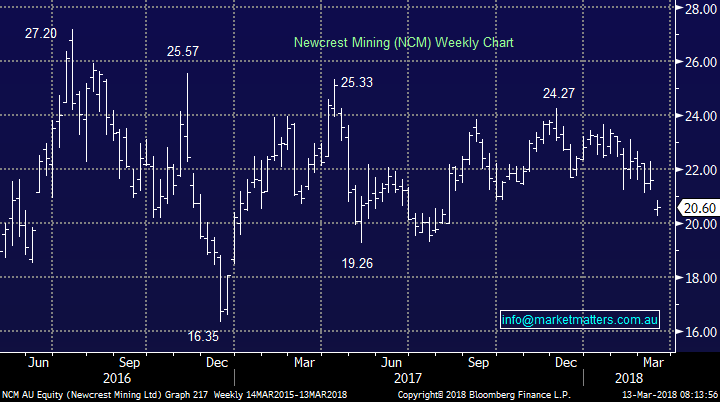
1 Newcrest Mining (NCM) $20.60
Cadia is a major contributor to NCM’s earnings and has the lowest cost structure of all their operations - as a consequence, any disruption here will have a big bearing on FY18 earnings.
Overall we are neutral NCM which like gold and gold ETF’s has basically traded sideways for since late 2016.
MM is neutral NCM at present and happily on the sidelines.
Newcrest Mining (NCM) Chart
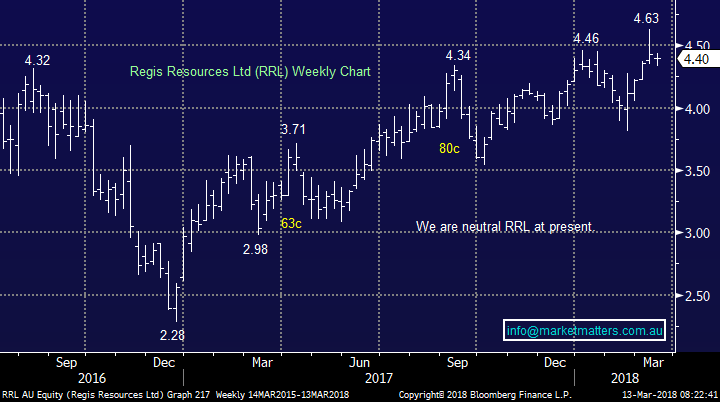
2 Regis Resources (RRL) $4.40
RRL has significantly outperformed NCM since late 2016 – remember the NCM / QBE comparison.
We’ve enjoyed some excellent forays into RRL over the last few years although we did miss the last pop above $4.50.
RRL remains our favourite stock in the sector, but from a risk / reward perspective sub $4 would be required to perk up our interest.
Regis Resources (RRL) Chart
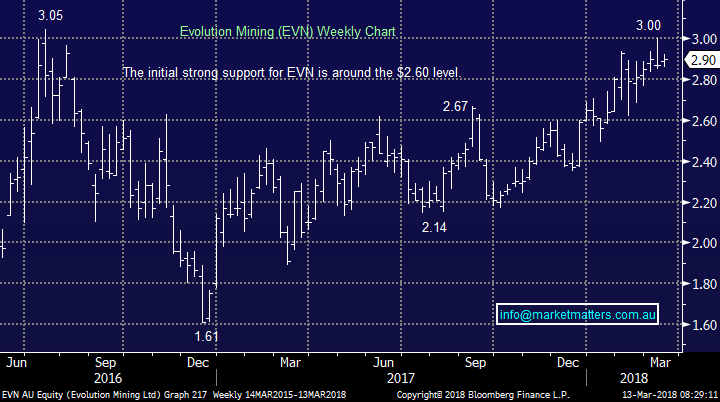
3 Evolution Mining (EVN) $2.90
EVN has also performed well since late 2016, it feels like wherever we look stocks are putting NCM to shame. However investors should remember that stock prices can be like an elastic band and we can see a period of relative outperformance by NCM not too far away.
However from a risk / reward perspective, we are negative EVN in the $3 region. A pullback towards $2.60 is required to make EVN again look attractive.
We are neutral EVN at best.
Evolution Mining (EVN) Chart
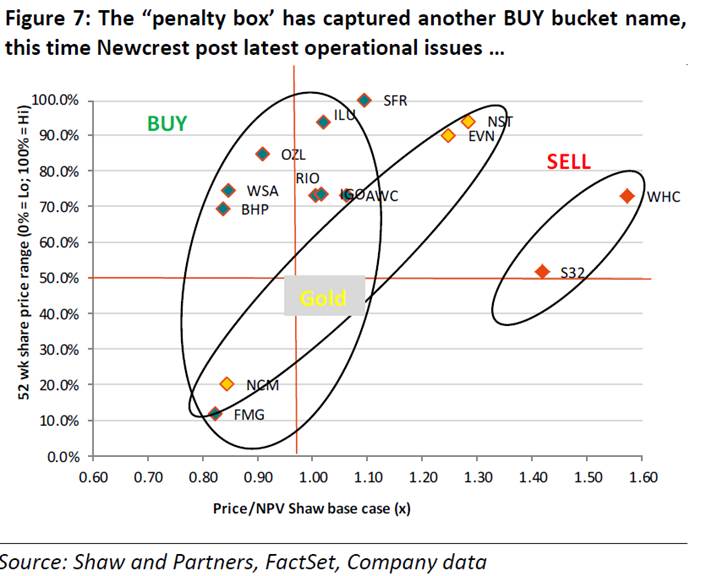
A good chart that we’ve used in the past from Shaw’s very good Resource Analyst, Peter O’Connor highlighting relative value across the commodity complex. NCM (on a relative value metric) looks cheap yet the uncertainty now around earnings will hurt in the short term.
Conclusion
- We are not attracted to the gold stocks / sector at this point in time, we believe patience will be rewarded here.
Watch for alerts.
Global markets
US Indices
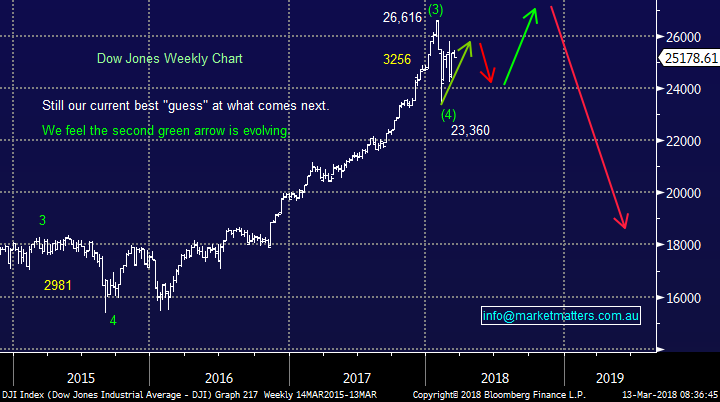
No major change, overall we believe US stocks have formed a low and they will be higher in 1-2 months’ time.
- While we expect US stocks to rally to fresh highs, the likely manner of the advance is far more choppy / indecisive than the almost exponential gains we have witnessed from late 2016 – feels accurate at the moment.
US Dow Jones Chart
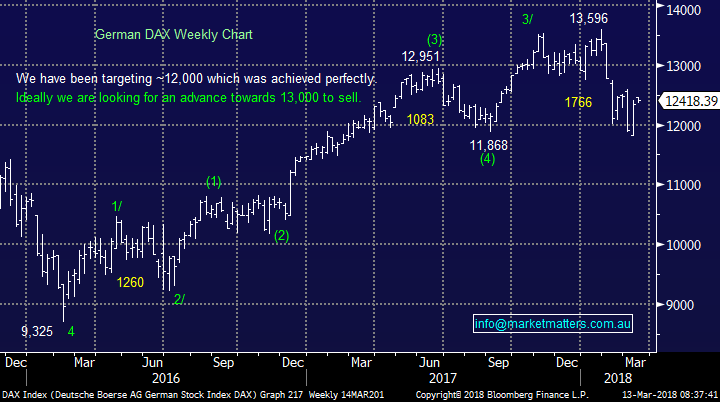
European Stocks
European indices have been lagging since late January but picked up over the last 48-hours, potentially we’ve seen their low for a few months.
German DAX Chart
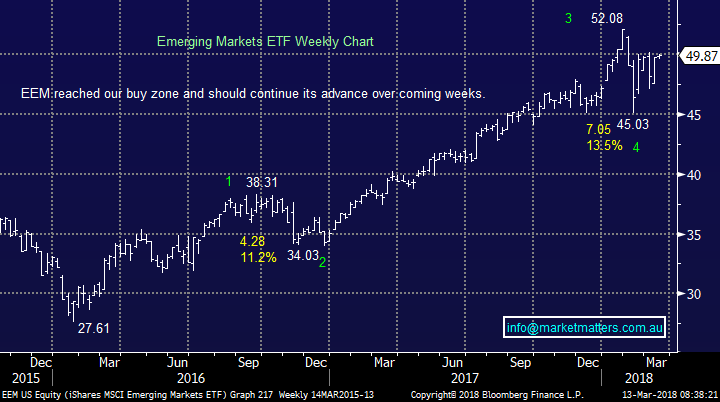
Asian Stocks / Emerging Markets
We remain bullish Asia at current levels, ideally targeting fresh 2018 highs in the next ~4-6 weeks – ideally the highly correlated Emerging markets Indices will trade in a similar manner, we are targeting ~10% gains.
Emerging Markets Chart
Overnight Market Matters Wrap
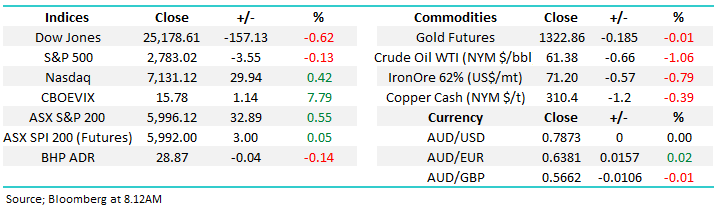
· The US equities were mixed overnight following uncertainties regarding the outcome of US Inflation data on Thursday and the Trump’s trade tariffs, with the NASDAQ 100 the only major to close in positive territory.
· Despite BHP ending its US session higher, it closed an equivalent of 0.14% lower from Australia’s previous close towards $28.87.
· Commodities traded mainly lower with crude oil losing some of its previous day gains down 1.06%, whilst iron ore stabilised continues to trade lower.
· The March SPI Futures indicating the ASX 200 to open with little change this morning to test the 6000 level again.
Disclosure
Market Matters may hold stocks mentioned in this report. Subscribers can view a full list of holdings on the website by clicking here. Positions are updated each Friday, or after the session when positions are traded.
Disclaimer
All figures contained from sources believed to be accurate. Market Matters does not make any representation of warranty as to the accuracy of the figures and disclaims any liability resulting from any inaccuracy. Prices as at 13/03/2018. 8.13AM
Reports and other documents published on this website and email (‘Reports’) are authored by Market Matters and the reports represent the views of Market Matters. The MarketMatters Report is based on technical analysis of companies, commodities and the market in general. Technical analysis focuses on interpreting charts and other data to determine what the market sentiment about a particular financial product is, or will be. Unlike fundamental analysis, it does not involve a detailed review of the company’s financial position.
The Reports contain general, as opposed to personal, advice. That means they are prepared for multiple distributions without consideration of your investment objectives, financial situation and needs (‘Personal Circumstances’). Accordingly, any advice given is not a recommendation that a particular course of action is suitable for you and the advice is therefore not to be acted on as investment advice. You must assess whether or not any advice is appropriate for your Personal Circumstances before making any investment decisions. You can either make this assessment yourself, or if you require a personal recommendation, you can seek the assistance of a financial advisor. Market Matters or its author(s) accepts no responsibility for any losses or damages resulting from decisions made from or because of information within this publication. Investing and trading in financial products are always risky, so you should do your own research before buying or selling a financial product.
The Reports are published by Market Matters in good faith based on the facts known to it at the time of their preparation and do not purport to contain all relevant information with respect to the financial products to which they relate. Although the Reports are based on information obtained from sources believed to be reliable, Market Matters does not make any representation or warranty that they are accurate, complete or up to date and Market Matters accepts no obligation to correct or update the information or opinions in the Reports.
If you rely on a Report, you do so at your own risk. Any projections are estimates only and may not be realised in the future. Except to the extent that liability under any law cannot be excluded, Market Matters disclaims liability for all loss or damage arising as a result of any opinion, advice, recommendation, representation or information expressly or impliedly published in or in relation to this report notwithstanding any error or omission including negligence.
To unsubscribe. Click Here