4 very interesting points relevant to our market (CBA, RIO, FMG, BHP)
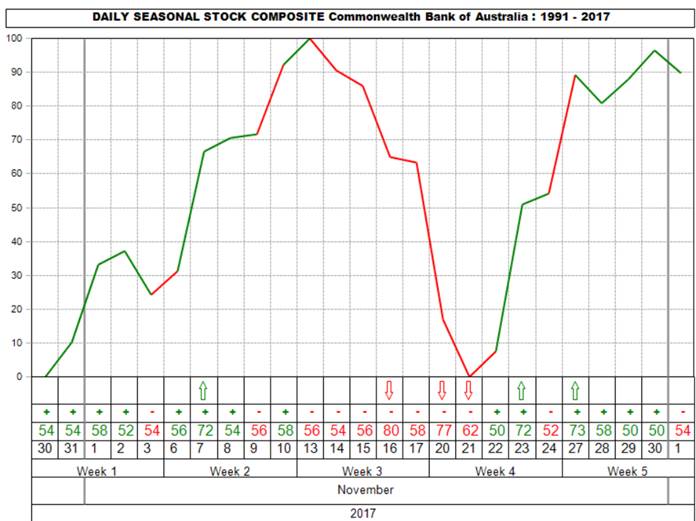
The local market managed to follow the strong rally in the US on Friday night but not in a particularly convincing manner with most of the +0.27% gains coming from the banks who go ex-dividend in the coming weeks e.g. BOQ +1.2%, ANZ +0.64%, NAB +0.61% and Westpac +0.6%. As we’ve pointed out a number of times recently our banking sector usually struggles in November with CBA correcting on average over 6% within the month since the GFC – a pretty hefty pullback considering CBA pays no dividend until February and we’ve been in an impressive strong bull market since the dark days of 2007/8. This brings me to a simple conclusion:
- The more our banking sector rises against the tide into November the more likely we are to take some profits in our large holding within the MM Growth Portfolio.
- We are likely to lock in some $$ on a bank going ex-dividend as we turn our focus on another paying dividends in early 2018, probably holding back on our buying until later in November – see CBA seasonality chart.
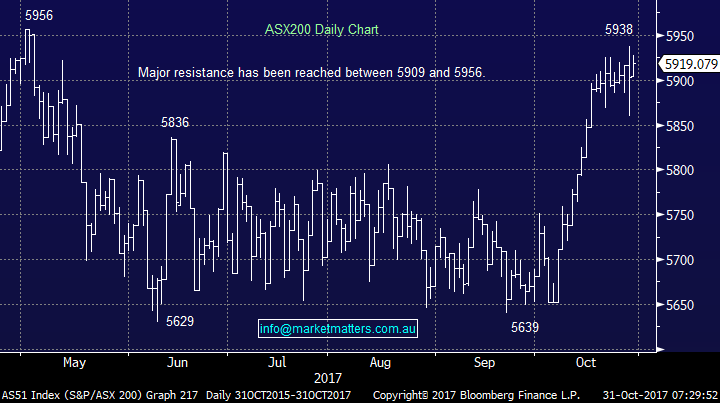
Overall while we remain bullish the ASX200 targeting well over 6000 in 2017/8 considering the looming weak seasonal period for our banks and the “toppy” feel in US indices we still believe a pullback towards 5850 is likely prior to a sustained rally over fresh recent highs.
ASX200 Daily Chart
CBA Seasonality Chart
1 Chinese stocks tumble with bonds
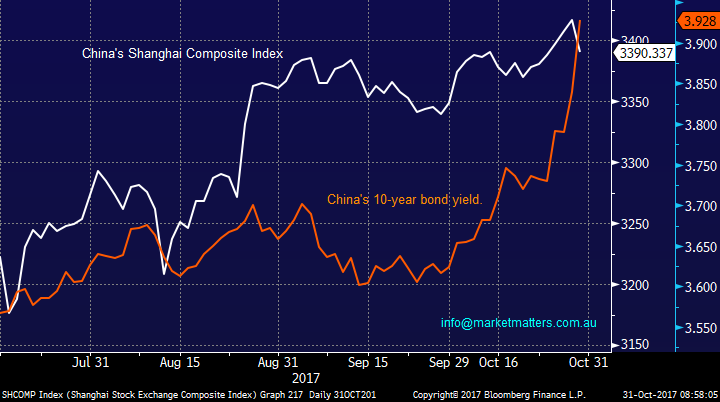
Chinese stocks finally succumbed to the local bond rout i.e. rising bond yields. At one stage yesterday the Shanghai Composite was down 1.8% before recovering ~half of the losses. The local 10-year bond yield rose close to its 3-year high just under 4%. In simple layman terms surging bond yields (lower bond prices) leads to higher funding costs for their domestic companies which is clearly bearish for stocks.
We believe the bond yields are the key to investing over the coming years on many levels but China showed us yesterday that if they rise too fast stocks will fall – we are getting clear warnings!
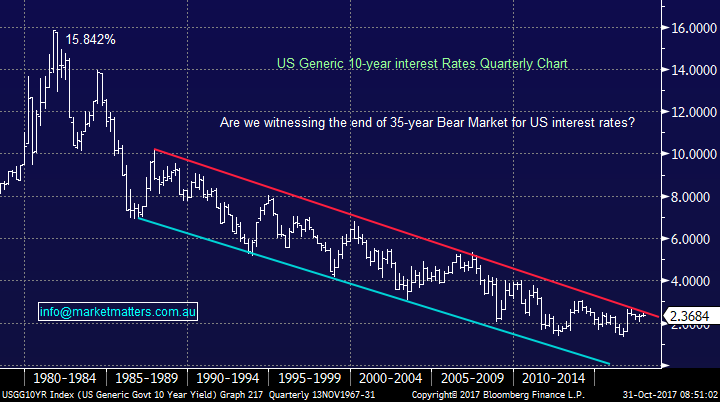
With US bond yields extremely close to breaking its 35-year bear market we believe that global equity markets are underestimating the risks of a sharp increase in bond yields, similar to China yesterday but on a larger scale. We believe bonds will give us the ~20% correction we continue to target over 2018/9.
China’s Shanghai Composite v China’s 10-year bond yield Daily Chart
US 10-year Bond yield Quarterly Chart
2 China and the ASX?
China’s Shanghai Stock Exchange has recently outlined plans for ongoing “closer links” with other global markets. This is likely to include additional purchases of stakes within other bourses similar to the 40% it purchased of the Pakistan stock exchange. The obvious question is how would the ASX fit into the picture? The points we see as relevant:
- We have no doubt that Chinese Exchange will purchase further stakes in other bourses globally – they have a distinct habit of implementing their rhetoric.
- The ASX has a logical fit because of our time-zone proximity, no current significant strategic alliances and of course we are a resources rich market.
- The ASX but in particular the Australian government simply need a happy China so a “diplomatic” alliance we believe should get a green light – previously in 2011 Swan and the Gillard government blocked a merger with the Singapore Exchange.
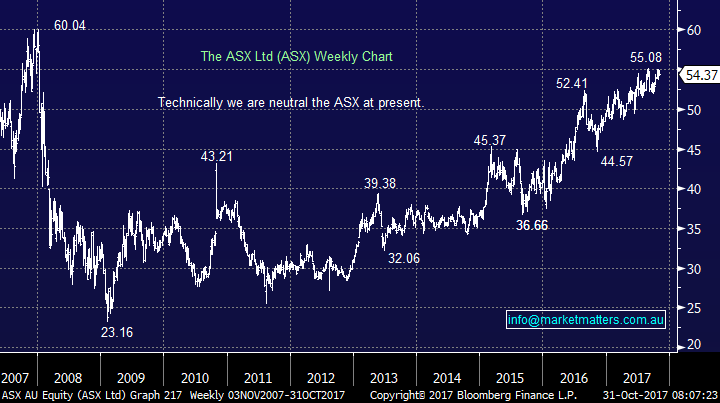
So we think there is a good possibility of an ASX – Shanghai Exchange “deal” in the years to come which should be very positive for the ASX. The problem is around $54 the ASX is not cheap trading on a P/E of 23.44x est. 2018 earnings and yielding only 2.87% fully franked + this is very expensive relative to other global exchanges.
We are buyers of the ASX but only into weakness, since 2011 the ASX has corrected over $7 on 3 occasions and we’re due another - we would be keen to start accumulating ASX under $50.
ASX Ltd (ASX) Weekly Chart
3 Iron Ore’s Bear Market continues
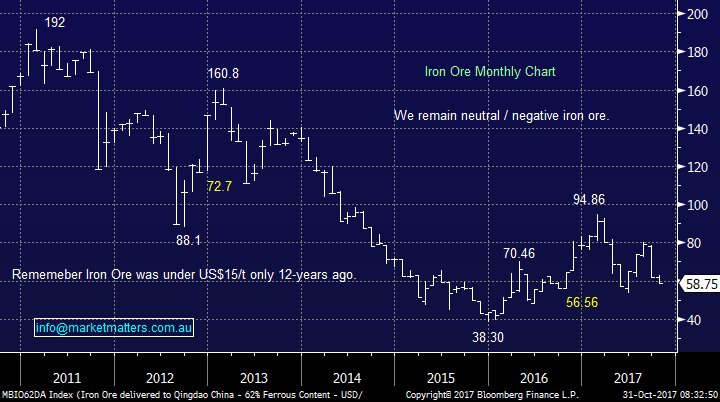
Iron ore fell another 2.2% last night, leaving the bulk commodity down 38% from its highs of 2017 – another example of China implementing what they say, in this case reducing pollution. When we look at our 3 major iron ore producers their performance in 2017 is very different:
- BHP $27.96 – BHP has only corrected 4.8% from its highs of 2017, assisted by positive capital management and obviously significant diversification.
- FMG $4.74 – The pure iron ore play has fallen 34.8% from its 2017 high and remains vulnerable to further falls in iron ore.
- RIO $69.98 - RIO has only corrected 2.8% from its highs of 2017, assisted by positive capital management / a large buyback and obviously some diversification. RIO is actually above its February swing high unlike BHP and FMG.
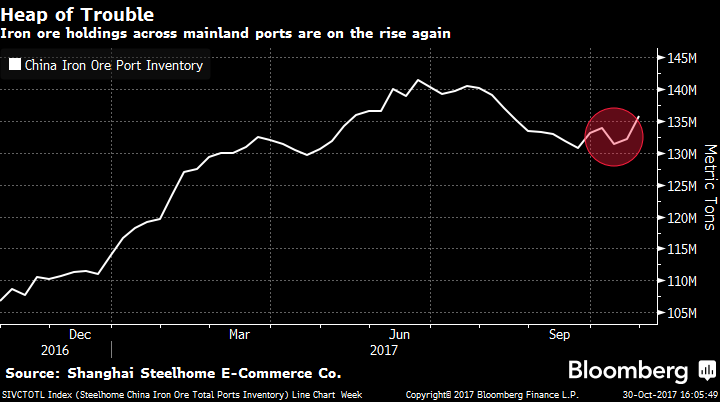
With iron ore stockpiles still increasing there’s no reason in the short-term to fight the bearish trend. Hence we see no reason to chase the likes of BHP and RIO who we do not believe are exciting / cheap at current levels – remain patient for now increasing our resources exposure.
Iron Ore Monthly Chart
Iron Ore Stockpiles going up again which should keep pressure on prices
4 The US Stock Market
US Stocks
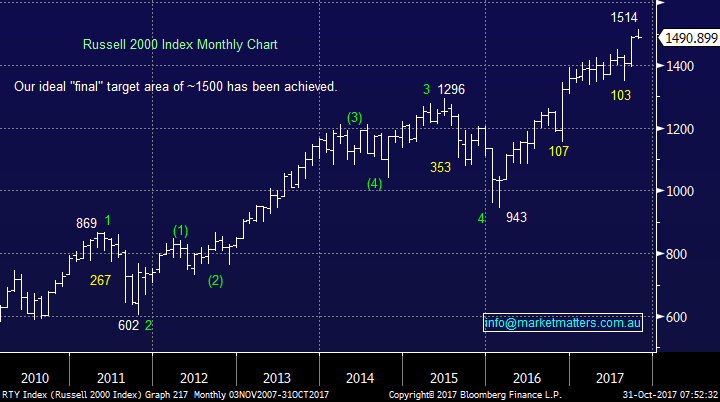
Last night the Russell 2000 fell over 1% threatening to make fresh monthly lows, its largest one day fall since August – a period when we witnessed a 7% correction for the small cap index. The weakness was caused by the US House now considering a 5-year phased cut to corporate tax, making it 2022 before we see the rate reach 20%. Importantly its Donald Trump and the Republicans who want this change to the tax system - he will be fighting another election well before 2022, whether he will win again must have a big question mark over it, however we didn’t expect him to get the keys to the White House the first time!
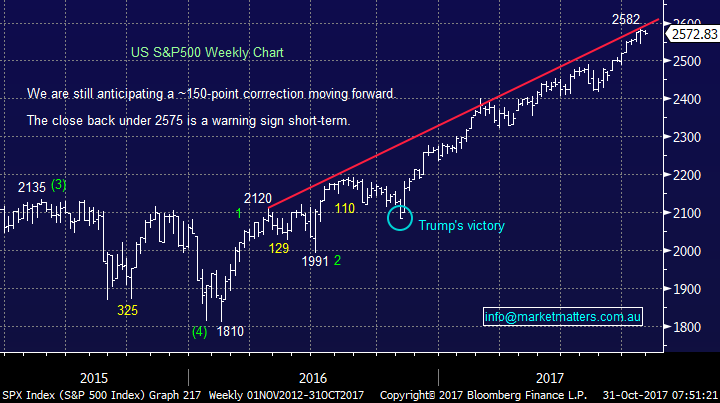
In our opinion the larger and more important S&P500 index, is now “looking for a short-term top” and we would be sellers from a trading perspective at current levels.
There is no change to our short-term outlook for US stocks, ideally we are targeting / need a ~5% correction before the risk / reward will again favour buying this market.
US Russell 2000 Monthly Chart
US S&P500 Weekly Chart
Overnight Market Matters Wrap
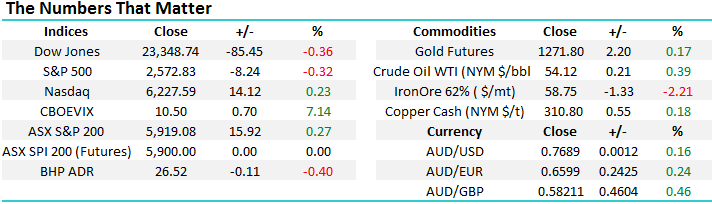
· The US equity markets closed marginally lower, except the NASDAQ 100 (+0.23%) as investors grow wary that any corporate tax cuts may take longer than anticipated.
· US reporting season has passed the half way mark with three-quarters of companies beating analyst expectations.
· Copper, zinc and nickel were better on the LME, while oil and gold are also trading higher. Iron ore continues to fall.
· A flat start is expected this morning in the ASX 200, still around the 5920 level as indicated by the December SPI Futures.
Disclosure
Market Matters may hold stocks mentioned in this report. Subscribers can view a full list of holdings on the website by clicking here. Positions are updated each Friday, or after the session when positions are traded.
Disclaimer
All figures contained from sources believed to be accurate. Market Matters does not make any representation of warranty as to the accuracy of the figures and disclaims any liability resulting from any inaccuracy. Prices as at 31/10/2017. 8.00AM.
Reports and other documents published on this website and email (‘Reports’) are authored by Market Matters and the reports represent the views of Market Matters. The MarketMatters Report is based on technical analysis of companies, commodities and the market in general. Technical analysis focuses on interpreting charts and other data to determine what the market sentiment about a particular financial product is, or will be. Unlike fundamental analysis, it does not involve a detailed review of the company’s financial position.
The Reports contain general, as opposed to personal, advice. That means they are prepared for multiple distributions without consideration of your investment objectives, financial situation and needs (‘Personal Circumstances’). Accordingly, any advice given is not a recommendation that a particular course of action is suitable for you and the advice is therefore not to be acted on as investment advice. You must assess whether or not any advice is appropriate for your Personal Circumstances before making any investment decisions. You can either make this assessment yourself, or if you require a personal recommendation, you can seek the assistance of a financial advisor. Market Matters or its author(s) accepts no responsibility for any losses or damages resulting from decisions made from or because of information within this publication. Investing and trading in financial products are always risky, so you should do your own research before buying or selling a financial product.
The Reports are published by Market Matters in good faith based on the facts known to it at the time of their preparation and do not purport to contain all relevant information with respect to the financial products to which they relate. Although the Reports are based on information obtained from sources believed to be reliable, Market Matters does not make any representation or warranty that they are accurate, complete or up to date and Market Matters accepts no obligation to correct or update the information or opinions in the Reports.
If you rely on a Report, you do so at your own risk. Any projections are estimates only and may not be realised in the future. Except to the extent that liability under any law cannot be excluded, Market Matters disclaims liability for all loss or damage arising as a result of any opinion, advice, recommendation, representation or information expressly or impliedly published in or in relation to this report notwithstanding any error or omission including negligence.
To unsubscribe. Click Here


