HMC Capital (ASX: HMC) $3.26
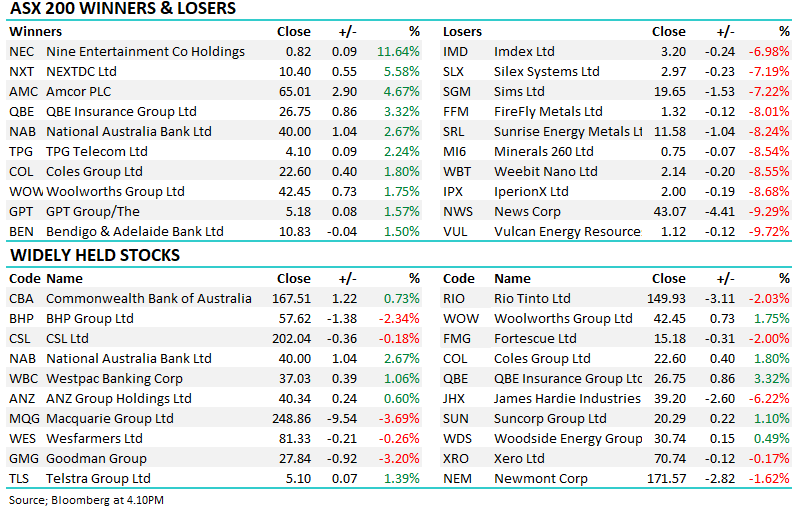
HMC +11.26%: Has come out with a much stronger FY27 outlook than the market expected, overshadowing a softer FY26 where operating earnings fell materially as transaction and performance fees normalised.

20 minute delayed
Join Market Matters and get full access to all our Opinion + Action
No consensus estimates are available for this company.
Undervalued
Morningstar Quantitative Rating as of 30 OCT 2026.
Quantitative Equity Rating Methodology – view here
Five-star price 2.66 Fair value 3.18 One-star price 3.81
Morningstar Quantitative Rating as of 30 OCT 2026.
Morningstar Quantitative Rating as of 30 OCT 2026. The slider runs from the five-star price (2.66) to the one-star price (3.81).
| Ratios |
|---|
| Currency (Price/reporting): AUD/AUD |
| Exchange Rate: 1.0000 |
| Price - closing or last bid | 3.00 |
| Price - 12 month high | 4.62 |
| Price - 12 month low | 2.16 |
| Pricing date | 29 OCT 2026 |
| Volume - avg. trading volume for the last ten days | 1.71 |
| Market capitalization | 1,237.85 |
| 12 Month High price date | 13 JAN 2026 |
| 12 Month Low price date | 30 MAR 2026 |
| Volume - avg. trading volume for the last 3 months | 1.34 |
| Price - 1 Day % Change | 2.04% |
| Price - 13 week price percent change | 2.39% |
| Price - 26 week price percent change | 20.97% |
| Price - 5 Day % Change | 11.94% |
| Price - 52 week price percent change | -5.36% |
| Price - YTD price percent change | -24.24% |
| Price % Change Month To Date | 0.67% |
| EPS excluding extraordinary items - most recent fiscal year | 0.046 |
| EPS excluding extraordinary items - trailing 12 month | 0.046 |
| EPS Normalized - most recent fiscal year | 0.483 |
| Revenue/share - most recent fiscal year | 0.441 |
| Revenue/share - trailing 12 month | 0.441 |
| Book value per share - most recent fiscal year | 1.869 |
| Book value per share - most recent half-year | 1.869 |
| Book value (tangible) per share - most recent fiscal year | 1.431 |
| Book value (tangible) per share - most recent half-year | 1.431 |
| Cash per share - most recent fiscal year | 0.024 |
| Cash per share - most recent half-year | 0.024 |
| Cash Flow per share - most recent fiscal year | -0.055 |
| Cash Flow per share - trailing 12 month | -0.055 |
| Dividend per share - most recent fiscal year | — |
| Dividends per share - trailing 12 month | 0.120 |
| EBITD per share - trailing 12 month | -0.124 |
| EPS Basic excluding extraordinary items - most recent fiscal year | 0.046 |
| EPS Basic excluding extraordinary items - trailing 12 month | 0.046 |
| EPS including extraordinary items - most recent fiscal year | -0.119 |
| EPS including extraordinary items - trailing 12 month | -0.119 |
| Free Cash Flow per share - trailing 12 month | -0.072 |
| P/E excluding extraordinary items, most recent fiscal year | 65.50 |
| P/E Normalized, most recent fiscal year | 6.21 |
| Price to sales - most recent fiscal year | 6.81 |
| Price to Tangible Book - most fiscal year | 2.10 |
| Price to Free Cash Flow per Share - most recent fiscal year | — |
| Price to Cash Flow per share - trailing 12 month | — |
| Price to Book - most recent fiscal year | 1.61 |
| P/E excluding extraordinary items high, trailing 12 months | 75.55 |
| P/E excluding extraordinary items low, trailing 12 months | 7.94 |
| Net Debt, LFI | -59.00 |
| Net Debt, LFY | 131.60 |
| Dividend Yield - 5 Year Average | 2.03% |
| Dividend Yield - indicated annual dividend divided by closing price | 4.08% |
| Current Dividend Yield - Common Stock Primary Issue, LTM | 4.00% |
| Free Cash Flow - most recent fiscal year | -29.70 |
| LT debt/equity - most recent fiscal year | 19.65% |
| Payout ratio - most recent fiscal year | — |
| Total debt/total equity - most recent fiscal year | 19.96% |
| LT debt/equity - most recent half-year | 21.08% |
| Total debt/total equity - most recent half-year | 28.53% |
| Free Cash Flow - trailing 12 month | -29.70 |
| Payout ratio - trailing 12 month | — |
| Revenue - most recent fiscal year | 181.90 |
| Revenue - trailing 12 month | 181.90 |
| EBITD - most recent fiscal year | -51.30 |
| EBITD - trailing 12 month | -51.30 |
| Earnings before taxes - most recent fiscal year | -76.20 |
| Earnings before taxes - trailing 12 month | -76.20 |
| Net Income available to common - most recent fiscal year | -49.10 |
| Net Income available to common - trailing 12 months | -49.10 |
| Earnings before taxes Normalized - most recent fiscal year | 92.00 |
| Net Income Available to Common, Normalized - most recent fiscal year | 199.40 |
| Earnings per Share, Normalized, Excluding Extraordinary Items, Avg. Diluted Shares Outstanding, TTM | 0.48 |
| Net Profit Margin % - 1st historical fiscal year | -23.97% |
| Net Profit Margin % - trailing 12 month | -23.97% |
| Operating margin - 1st historical fiscal year | 27.10% |
| Operating margin - trailing 12 month | 27.10% |
| Pretax margin - trailing 12 month | -41.89% |
| Pretax margin - 1st historical fiscal year | -41.89% |
| Operating Margin - 5 year average | 31.88% |
| Pretax Margin - 5 year average | 102.98% |
| Free Operating Cash Flow/Revenue, 5 Year Average | 5.12% |
| Free Operating Cash Flow/Revenue, TTM | -16.33% |
| Net Profit Margin - 5 year average | 97.61% |
| Return on average assets - most recent fiscal year | -1.72% |
| Return on average assets - trailing 12 month | -1.72% |
| Return on average equity - most recent fiscal year | -2.70% |
| Return on average equity - trailing 12 month | -2.70% |
| Return on average assets - 5 year average | 7.09% |
| Return on average equity - 5 year average | 9.44% |
| Net Income/employee - most recent fiscal year | — |
| Revenue/employee - most recent fiscal year | — |
| Revenue growth rate, 5 year | 21.25% |
| EPS growth rate, 5 year | — |
| Growth rate% - dividend, 3 year | 0.00% |
| Revenue/share (5 yr growth) | -8.12% |
| Growth rate% - Revenue, 3 year | 38.32% |
| Growth rate% - EPS, 3 year | — |
| Book value per share growth rate, 5 year | 1.10% |
| Capital Spending growth rate, 5 year | — |
| Earnings Before Interest, Taxes, Depreciation & Amortization, 5 Year CAGR | — |
Financial forecast (AUD, millions except per share)
No consensus estimates are available for this company.
Financials (AUD, millions)
| Period end: | JUN 22 | JUN 23 | JUN 24 | JUN 25 | JUN 26 |
| Fiscal year: | 2022 | 2023 | 2024 | 2025 | 2026 |
| Period length: | 12 months | 12 months | 12 months | 12 months | 12 months |
Announcements
| DATE | TIME | HEADING | PAGES |
| Price sensitive |
HMC +11.26%: Has come out with a much stronger FY27 outlook than the market expected, overshadowing a softer FY26 where operating earnings fell materially as transaction and performance fees normalised.
In an update last week, HMC announced another important step in broadening its funds management platform, securing commitments from two global institutional investors to deploy up to $1.35 billion into private credit. This is strategically significant. HMC’s private credit business has so far been built largely through wholesale and high-net-worth investors, with more than $2 billion of assets under management. Institutional backing expands the opportunity and gives HMC the chance to replicate some of the success it has already achieved in real estate.
HMC +17.06% rallied strongly after announcing a major operational restructure, as management moved to simplify the business, sharpen its focus and improve returns. The group, led by David Di Pilla, has been under pressure across several fronts, including the underperformance of its HMC Capital Partners Fund, a weaker share price, and challenges within DigiCo Infrastructure, its listed data centre vehicle. While the restructure is not a silver bullet, it is a clear attempt to clean up the portfolio and refocus HMC around areas where it believes it has the strongest competitive advantage.
HMC has gone from one of the market’s most celebrated alternative asset managers to one of its most heavily discounted. The share price is down ~70% over the past year (-76% from late-2024 highs), as investors lost faith in the group’s ability to deliver on its ambitious targets; $50bn assets under management (AUM) and 20% return on equity (ROE) targeted within 3-5 years - first announced at its AGM in November 2024. That implied a compound annual growth rate of ~23 % over five years (or ~42 % over three) from then-current levels. (The 20% ROE target had been discussed earlier).
We are making several changes to the Emerging Companies Portfolio
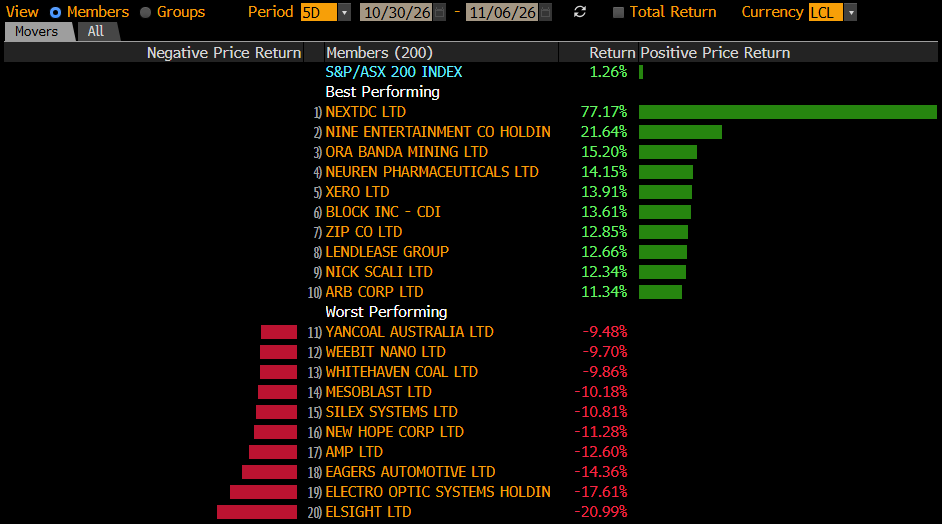
HMC has been a horrible performer over the past year, down nearly 70%, putting it as the weakest performing stock in the ASX 200 (followed by IDP Education, Dominos, Reece, Treasury Wines and Telix). We hold the stock in the Emerging Companies Portfolio, with our initial 5% weighting now down to ~2%.
It’s been a tough period for HMC Capital (HMC), the alternative asset manager that grew funds very quickly to $18.5bn, amid ambitions to grow this to $50bn over the next 3-5 years. The pressure compounded yesterday after they announced the delay in settling its $950 million acquisition of Neoen's renewable energy assets, plus, they also announced the unexpected departure of Angela Karl, Head of Energy Transition.
HMC –5.8%: was weaker today after CEO David Di Pilla provided a trading update at the Macquarie Conference and downgraded FY25 earnings. The asset manager now forecasts Earnings Per Share (EPS) of 66c, below the 70c projected a month ago in the half-yearly update.
We discussed HMC in detail this time last month, just before Liberation Day! Our thesis hasn’t changed, and we believe the stock is oversold/cheap as the “AI Trade” comes back into vogue courtesy of its major position in DigiCo (DGT) – the weak and speculative longs have certainly been washed out of both DGT and HMC.
The bearish thesis on HMC had been around valuation relative to their funds under management. As a broad rule of thumb, a funds management business will typically trade on 5-10% of their Assets Under Management (AUM), adjusted up or down for expected inflows/outflows.
MM remains long and bullish HMC
MM remains optimistic on HMC, looking for a turnaround in FY27
MM remains long & bullish HMC ~$3
MM is sticking with HMC, seeing deep value sub $3
MM is adding to HMC in the Emerging Companies Portfolios– reinforcing a 4% portfolio target weight
MM is looking to average our HMC position
MM remains long and cautiously bullish HMC
MM is neutral to mildly bullish HMC ~$4
MM is long and bullish HMC
MM remains long and bullish HMC

HMC Capital Ltd is an alternative asset manager that invests in high-conviction and scalable real asset strategies on behalf of individuals, large institutions and super funds. The Group's reportable operating segments are: Real Estate, Private Equity, Private Credit, Digital Infrastructure, and Corporate. Maximum revenue is derived from the Real Estate segment, which includes the Group's real estate strategies, including HMC Capital managed HomeCo Daily Needs REIT, HealthCoHealthcare and Wellness REIT, HMC Wholesale Healthcare Fund, the Last Mile Logistics Fund, HMC Unlisted Grocery Fund and HMC Australian Retail Partnership.






Forgot password? Request a One Time Password or reset your password
One Time Password
Check your email for an email from [email protected]
Subject: Your OTP for Account Access
This email will have a code you can use as your One Time Password for instant access
A link to create a new password will be sent to the email address you have registered to your account.

Hi, this is only available to members. Join today and access the latest views on the latest developments from a professional money manager.

Our Smart Phone App will give you access to much of our content and notifications. Download for free today.
Hi, this is only available to members. Join today and access the latest views on the latest developments from a professional money manager.
JOIN NOW
Something went wrong. Please try again in a moment.