Bulls run ahead of Trumps ‘phenomenal’ tax plan
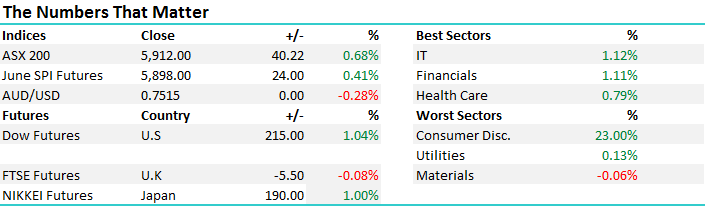
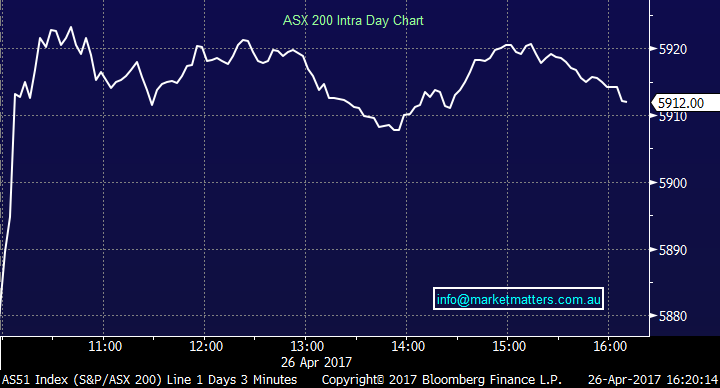
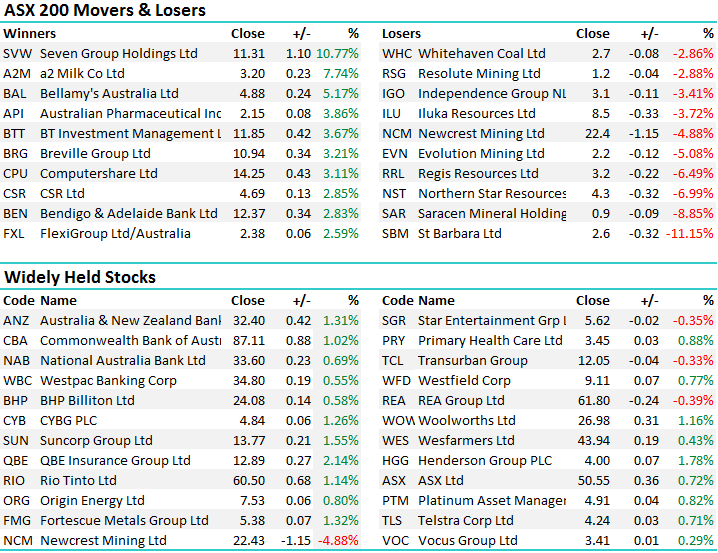
The market played out pretty well to script today with the financials seeing most of the buying while the Gold stocks copped it on the chin, most down more than 5% as we see ‘risk on’ ahead of Mr Trumps self-described ‘phenomenal’ tax plan set for release tomorrow. Two days of trade in the U.S while we were off saw the DOW JONES up more than 400pts, so clearly our market was going to play some catch up today, and we certainly did. We opened with a bang, rallying hard, before tracking sidewise for much of the day – a trading range of +/- 43 points, a high of 5923, a low of 5912 and a close of 5912, up +40pts or +0.68%.
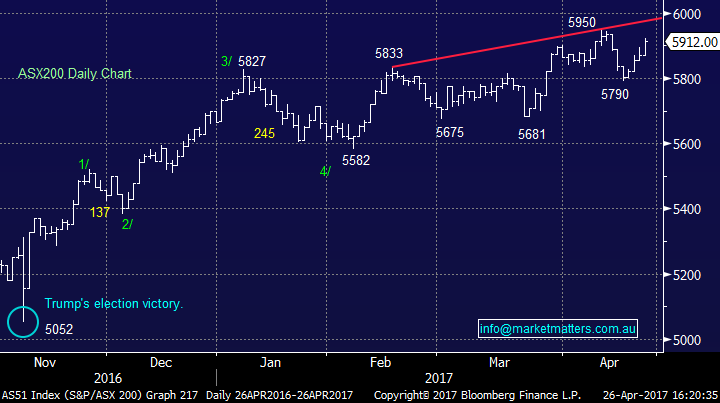
Although the ASX200 has clearly been lagging its global counterparts over recent weeks, primarily because of our Resources and Telco's sectors, we continue to target fresh 2017 highs in coming weeks, towards the 6000 level, but we believe from an overall market perspective this will be an opportune time to reduce market exposure and be nett sellers.
ASX 200 Intra-Day Chart
ASX 200 Daily Chart
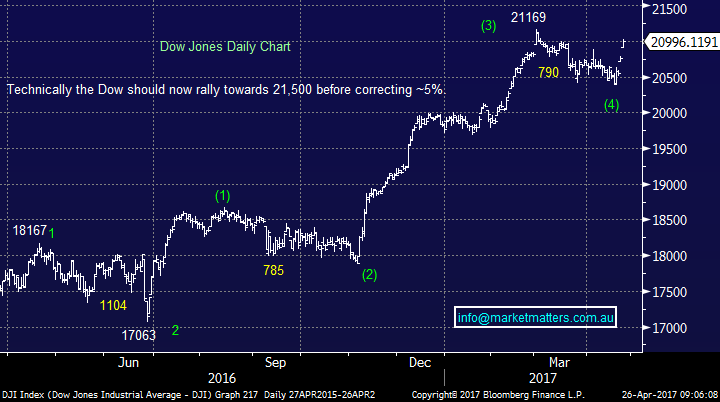
Before we get onto stock specific moves today, and a look more broadly at the economic picture currently playing out, it’s worth-while revisiting our shorter term view for US equities given US stocks look solid for at least another 1-2 weeks. Our target for the Dow is around the 21,500 area, or 2.5% higher, however given recent strength it now feels like we are heading towards a classic "sell in May and go away" scenario. Assuming we get a 5% correction over May and June, similar to last year, we will be keen buyers into this weakness targeting further gains in 2017.
US Dow Jones Daily Chart
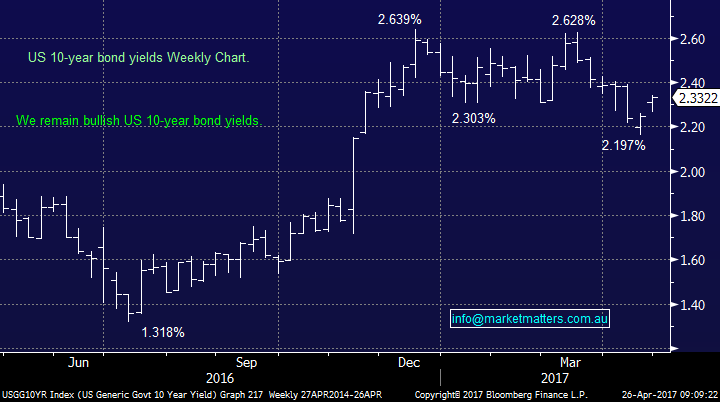
As it stands, our portfolio is skewed to a couple of specific themes given the current macro backdrop. Firstly, we think interest rates are going higher and this is being shown by the break back above 2.3% for the US 10-year bond yield, which technically confirms the recent correction is complete and we are set to advance to fresh 2017 highs for bond yields i.e. towards 2.8%, buoyed somewhat by inflationary Trump policies. In this sort of environment, financials do well and we have a broad exposure to financial stocks currently in the MM portfolio.
US 10-year bond yields Weekly Chart
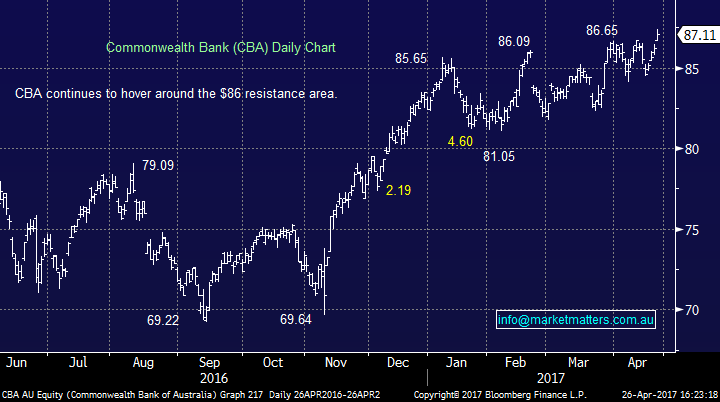
The other interesting aspect today that helped the banks was news that Global banking standard-setters have promised to pause new policy initiatives until 2019 so they can assess the impact of post-crisis reforms. APRA are now on their own in regards to tightening capital requirements. Australian banks are definitely going to be “unquestionably strong”. Clearly, less regulation globally will be a positive for global bank’s share prices and flow into Aussie banks. We continue to like banks however as outlined this morning, we’ll look to tweak our exposures if we see continued strength at the back end of April / early May.
Commonwealth Bank (CBA) Daily Chart
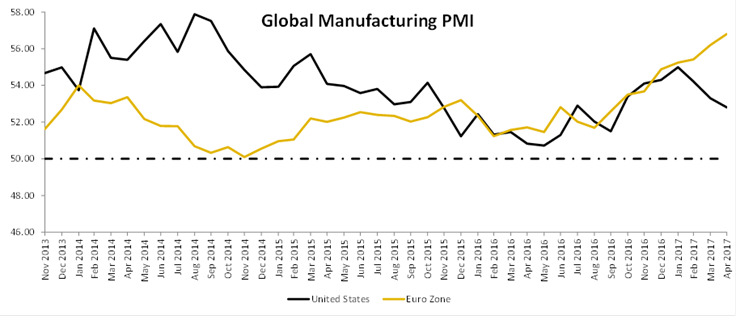
We’re also keen on exposure to Europe and it was interesting to note that the trend in Euro region growth remains strong – with the EuroZone now growing faster than the US. For this exposure we have positions in CYBG (CYB) and Henderson Group (HGG) - both of which had solid days today….We remain bullish both stocks from current levels.
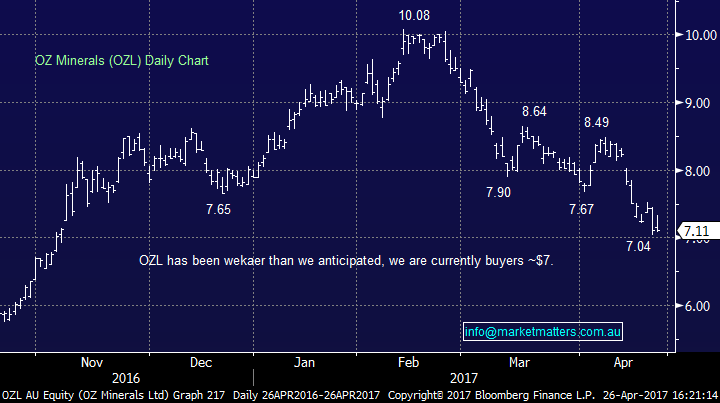
…and finally, the reflation trade globally is not dead, we’ve just seen a hiccup in the last few weeks and a drop in key commodity prices now looks overdone. For exposure here we have positions in the diversified miners and more recently Oz Minerals (OZL) that was added to the portfolio today. These are stocks that fit our bigger picture views but also have catalysts for share price appreciation in the near term, something we’re always conscious of.
Last week’s update from Oz in terms of production + their Carrapateena project was met with selling by the market. Production numbers were soft, which was expected while their Carrapateena project remains on track. The disappointment stemmed from the Board’s postponement of the final investment decision, which is now likely to be 6 months away. We stress, the project remains on track. Weakness in the stock presents an opportunity in our view particularly given the short term positive backdrop for the Copper price, which has a positive technical setup in the shorter term.
Oz Minerals (OZL) Daily Chart
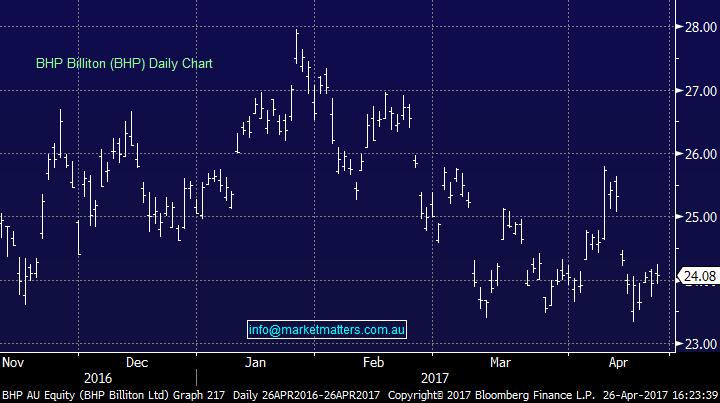
In terms BHP, which we do own, they were out with production numbers this morning and although headline numbers were soft, it was broadly as expected. Iron Ore and Met Coal were impacted by bad weather in the north, Copper was impacted by strikes at Escondida in Chile, while it was interesting to see them make reference to selling ‘none core’ assets from their US shale portfolio which is clearly a result of pressure from the Elliott agitation - which is likely to be ongoing. The stock closed up +0.58% to $24.08 today.
BHP Billiton (BHP) Daily Chart
Have a great night,
The Market Matters Team
Disclosure
Market Matters may hold stocks mentioned in this report. Subscribers can view a full list of holdings on the website by clicking here. Positions are updated each Friday.
Disclaimer
All figures contained from sources believed to be accurate. Market Matters does not make any representation of warranty as to the accuracy of the figures and disclaims any liability resulting from any inaccuracy. Prices as at 26/04/2017. 5.00PM.
Reports and other documents published on this website and email (‘Reports’) are authored by Market Matters and the reports represent the views of Market Matters. The MarketMatters Report is based on technical analysis of companies, commodities and the market in general. Technical analysis focuses on interpreting charts and other data to determine what the market sentiment about a particular financial product is, or will be. Unlike fundamental analysis, it does not involve a detailed review of the company’s financial position.
The Reports contain general, as opposed to personal, advice. That means they are prepared for multiple distributions without consideration of your investment objectives, financial situation and needs (‘Personal Circumstances’). Accordingly, any advice given is not a recommendation that a particular course of action is suitable for you and the advice is therefore not to be acted on as investment advice. You must assess whether or not any advice is appropriate for your Personal Circumstances before making any investment decisions. You can either make this assessment yourself, or if you require a personal recommendation, you can seek the assistance of a financial advisor. Market Matters or its author(s) accepts no responsibility for any losses or damages resulting from decisions made from or because of information within this publication. Investing and trading in financial products are always risky, so you should do your own research before buying or selling a financial product.
The Reports are published by Market Matters in good faith based on the facts known to it at the time of their preparation and do not purport to contain all relevant information with respect to the financial products to which they relate. Although the Reports are based on information obtained from sources believed to be reliable, Market Matters does not make any representation or warranty that they are accurate, complete or up to date and Market Matters accepts no obligation to correct or update the information or opinions in the Reports.
If you rely on a Report, you do so at your own risk. Any projections are estimates only and may not be realised in the future. Except to the extent that liability under any law cannot be excluded, Market Matters disclaims liability for all loss or damage arising as a result of any opinion, advice, recommendation, representation or information expressly or impliedly published in or in relation to this report notwithstanding any error or omission including negligence.
To unsubscribe. Click Here


